This page explains my ideas on valuation and modelling analysis for M&A analysis. I walk through a number of different valuation alternatives including. For each of the valuation alternatives, my valuation ideas with respect to M&A analysis are not conventional. In particular, on this page I discuss different ways of thinking about how to measure the present value of synergies; how you should interpret and calculate the accretion or dilution in a merger and how to simulate a leveraged buyout transaction in developing valuation. In many of the alternatives, the EV/EBITDA is used and I show the dangers of applying comparable company analysis. I also discuss my ideas about how to assess the terminal value in DCF analysis in the context of M&A and how you can consider cost of capital issues. Some of the subjects that I address include:
- Alternative Valuation Techniques and Alternative Ways to Evaluate M&A including synergy valuation, accretion and dilution analysis and simulated leverage buyout value
- Corporate Modelling for DCF and Use of Corrected Terminal Value in the context of M&A
- Valuation from EV/EBITDA and P/E Multiples and Financial Mathematics
- Evaluating Reasonable Cost of Capital in Models and Problems with Un-Lever and Re-Lever of Beta and Equity Market Risk Premium
- Avoidance of Idiotic Adjustments for Country Risk and for Private/Public Analysis
For each of the sections of M&A analysis I have made a video that reviews the points discussed in the course. The first video that provides an overview is included below. There are a total of five videos that discuss the various different issues.
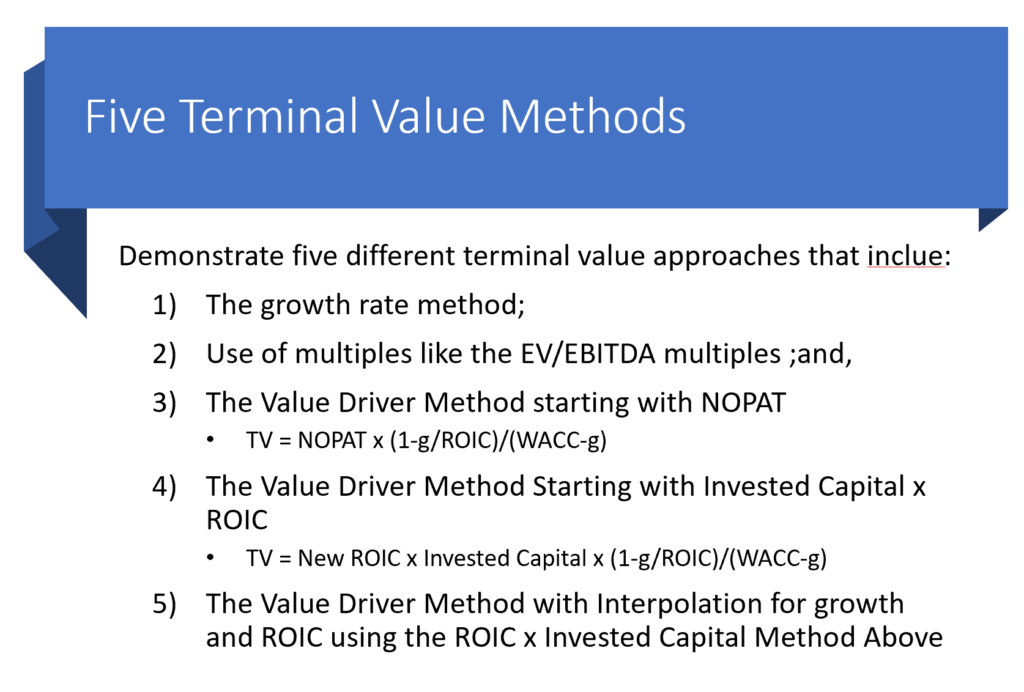
Comprehensive Power Point Slides Discussing M&A Analysis with Nuanced Valuation Analysis
Avoiding Magic Potion in M&A Analysis
Like other pages, I will explain why I think a lot of aspects of valuation in a corporate modelling and M&A context are more like magic potion than solid financial financial analysis. Some of the aspects of valuation that are typically used in M&A analysis and resemble magic potion include:
- Computing EV/EBITDA ratios from comparable companies with explicitly considering changes in ROIC, growth, asset lives and tax rates
- Estimating the value of synergies using traditional discounted cash flow rather than start-up analysis with development probabilities
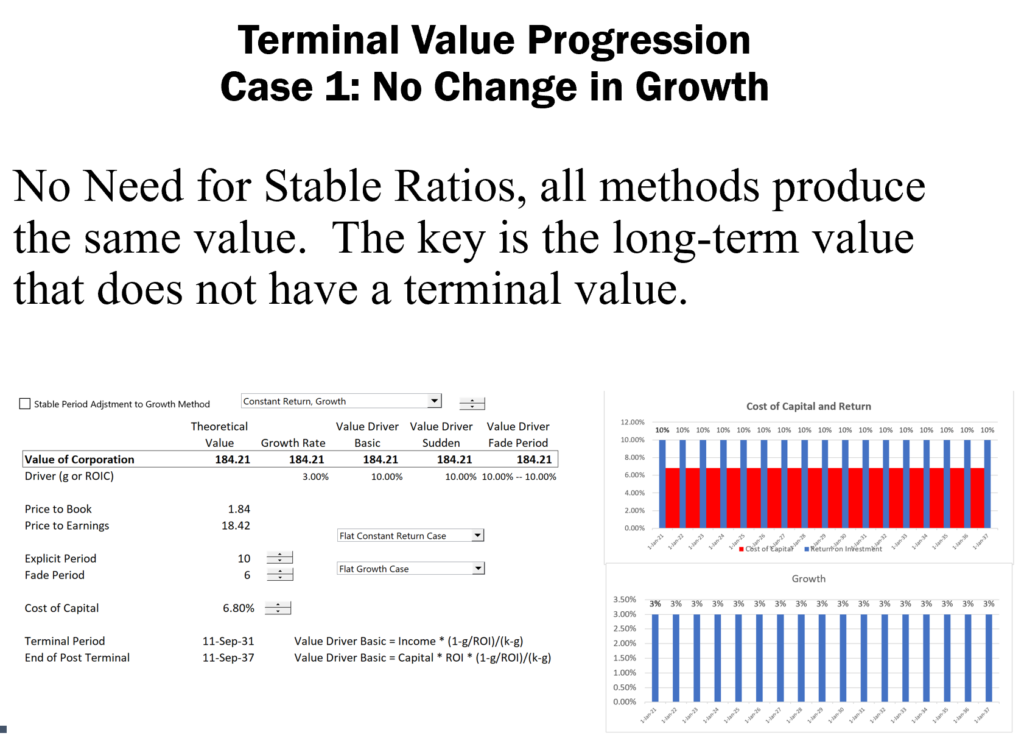
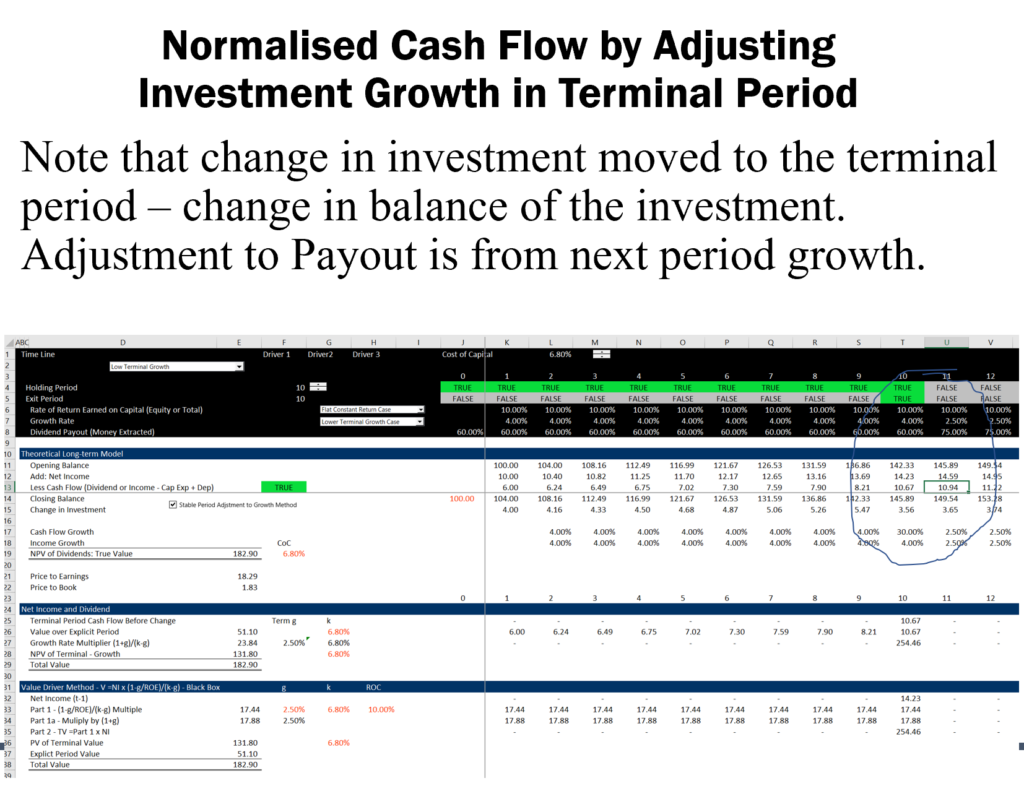
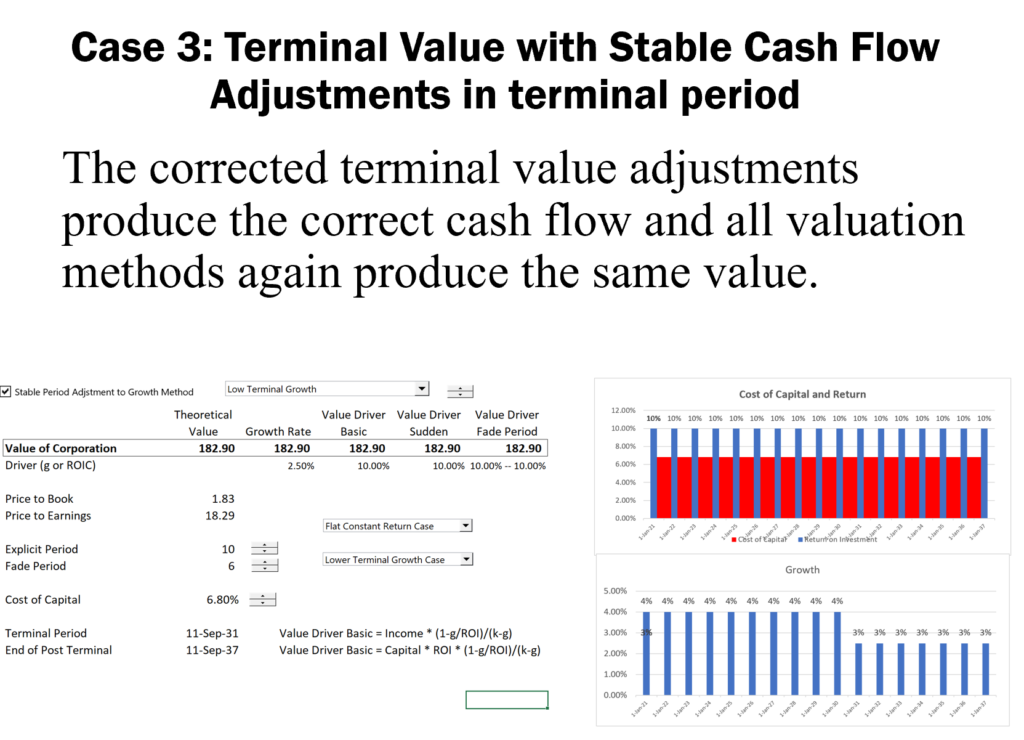
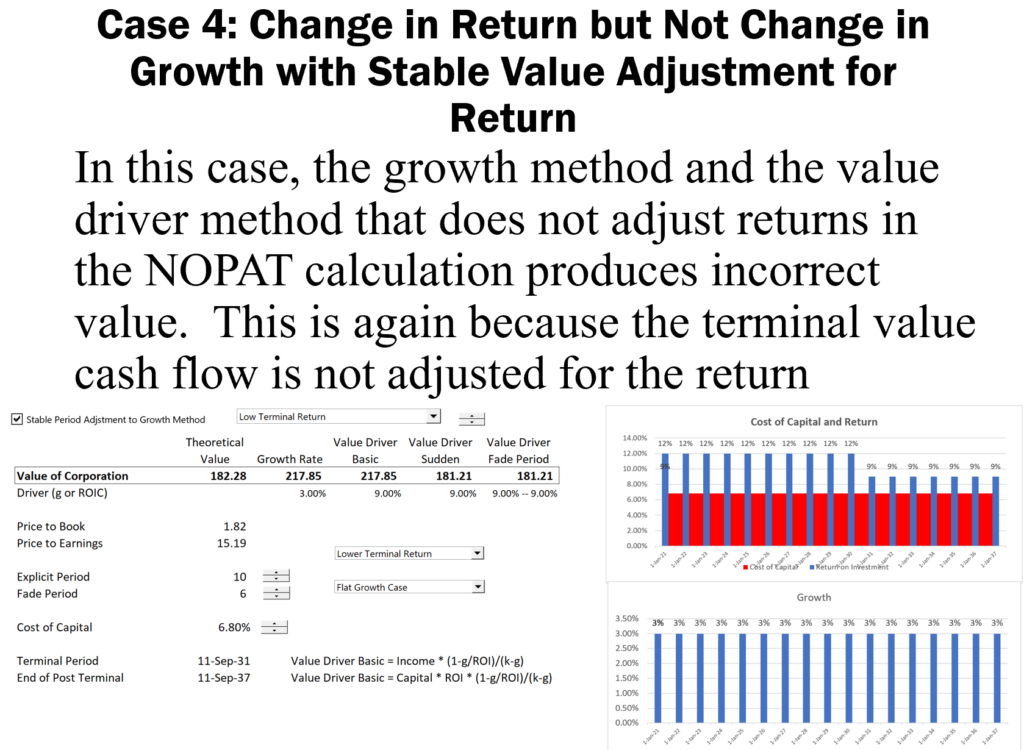
- Use of normalized cash flow in the terminal period of the discounted cash flow analysis
- Calculation of Cost of Capital with CAPM and Expected Market Risk Premium
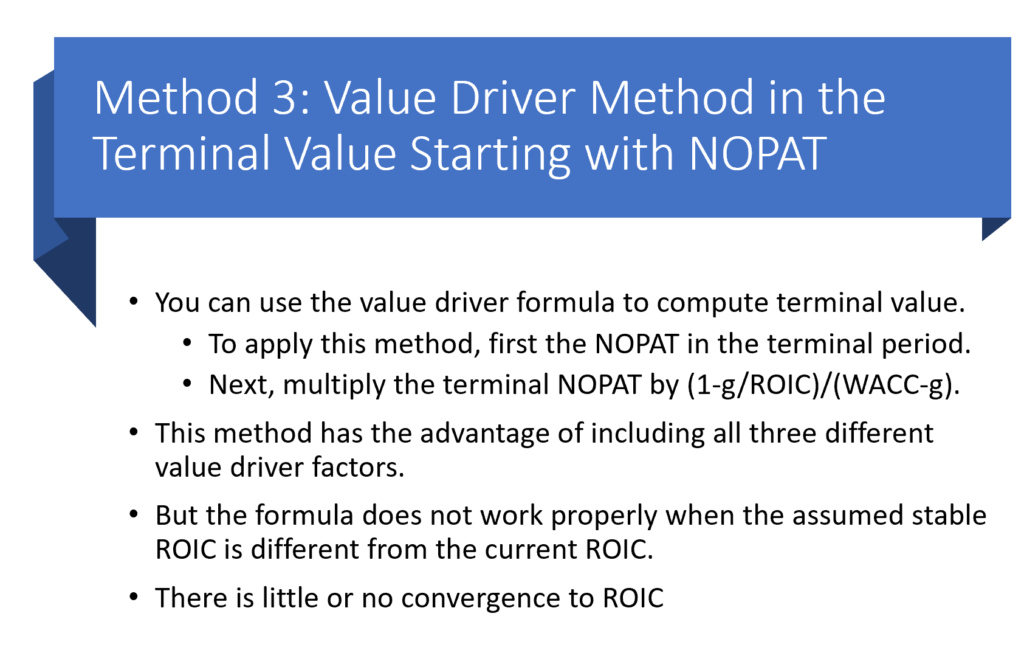
- Use of Valuation Formula: Value = Income x (1-g/ROIC)/(WACC-g)
- Assumption that a Company will suddenly become a stable company in equilibrium
- Myriad of adjustments for political risk, liquidity, beta mean reversion, small company risk …
- Methods to Normalise Cash Flow in Terminal Period

Applying Bureaucratic Valuation Techniques without Thinking
- Using 5 years for explicit period
- Using growth model (Gordon’s Model) without normalizing
- Not explicitly considering the rate of return output in the financial model
- Using EV/EBITDA ratios from comparable companies without adjusting for ROIC, depreciation, taxes and growth
- Not considering strategic implications of synergies and discount rates
- Un-levering and Re-levering Beta without Accounting for Changing Credit Spreads and Implied Debt Beta
- Cost of Capital Inputs with EMRP and Small Business Premiums etc.
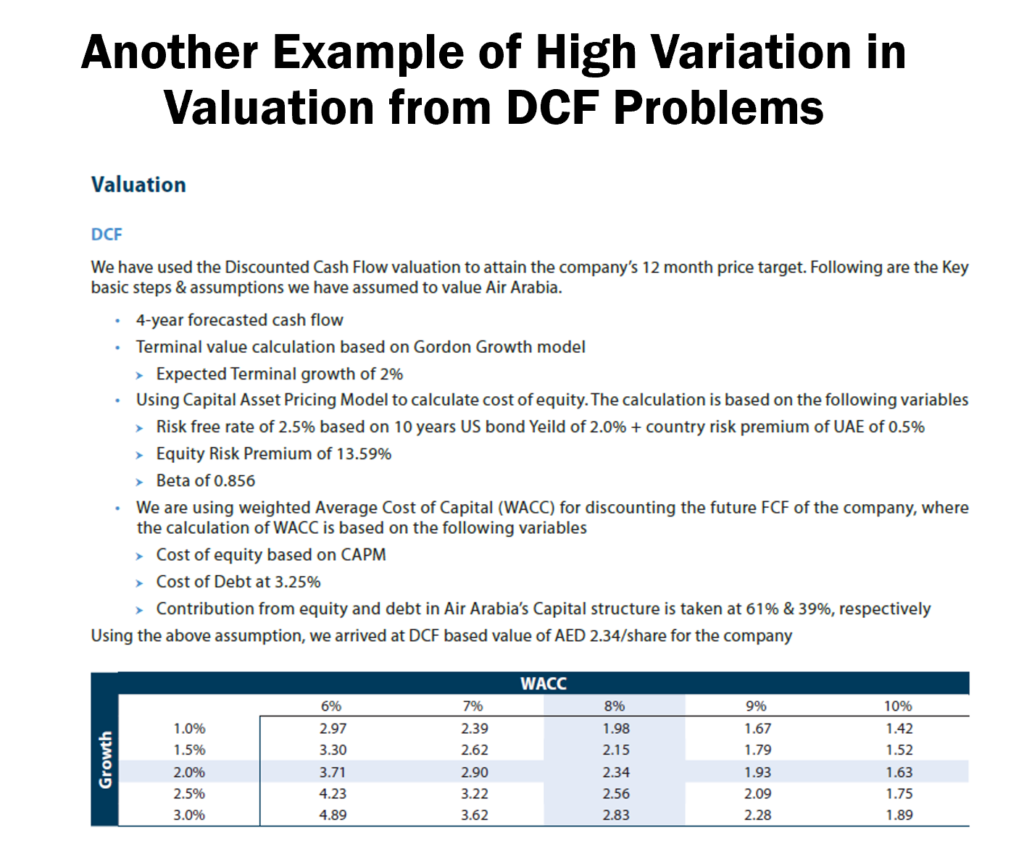
I have been a bit naive in believing that valuation methods for M&A and in other contexts have improved a lot. But then I received an article from my friend Karnen in Indonesia. This article which I will refer to a bit below demonstrates that I was completely wrong and the completely BS terminal value, cost of capital, explicit periods, DCF methods are extremely basis.
Part 1: Alternative M&A Methods
The different methods for considering M&A include the following. I will emphasize that for each of the methods you need to think about how general valuation issues and in particular how to measure the value of new management strategies. I of course complain a lot about traditional application of the various methods in detail.
- Economics; Change in Strategy; Synergies and Premium
- Accretion and Dilution with Private and Public Company
- LBO Analysis with EV/EBITDA and Financing
- DCF with Synergy Added and Appropriate Terminal Value
- Use of Multiples in M&A
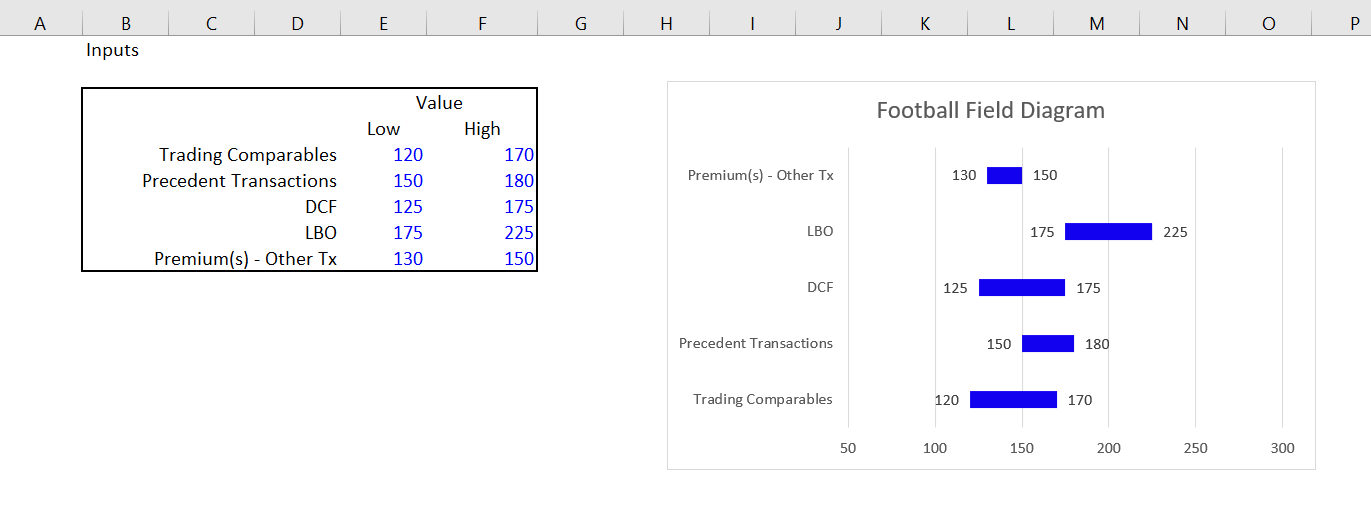
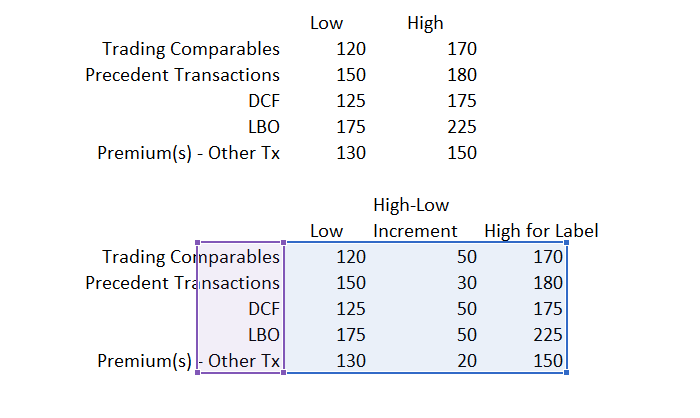
When presenting the M&A methods I will use a football field diagram.
Football Field Diagram and Alternative Valuation Approaches with Different Ranges in Value for M&A Evaluation
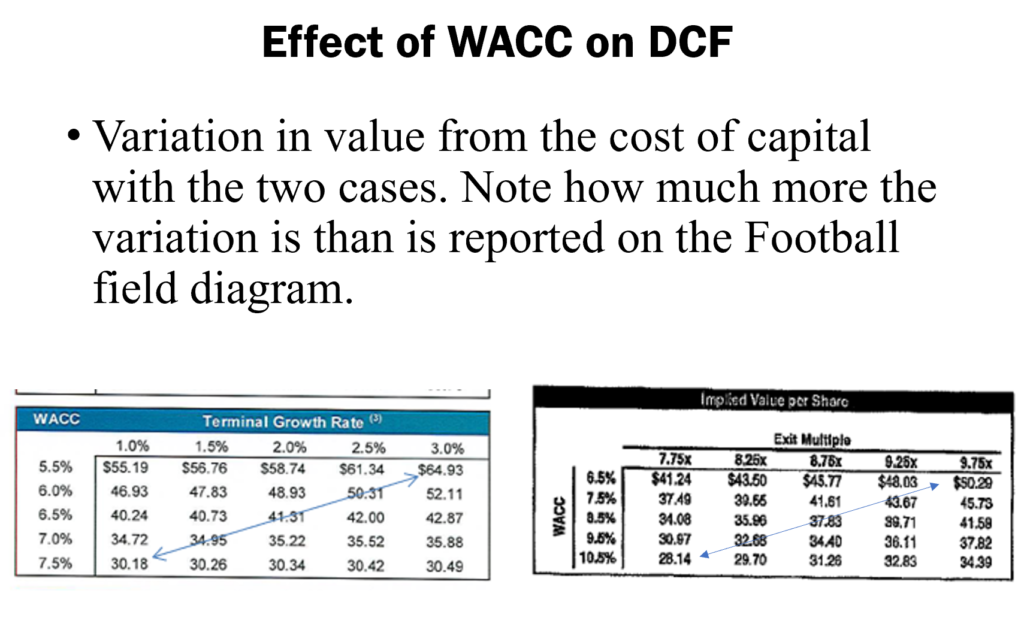
In one course I taught, the person who directed the course wanted to have everything discussed in terms of a Football Field Diagram. This american football field diagram shows how one team gets the ball and then travels a little. Then the team kicks the ball and the other teams begins to go the other way. In the end there are a lot of blocks with different lengths. This can be used in M&A valuation to demonstrate that different methods can be used and to also demonstrate that the different methods do not result in one single value, but a range in values. The diagram below shows a football field diagram from a transaction where public comparable companies, M&A comparable transactions, DCF, LBO and premium paid comparable companies were used. These different valuation techniques were compared to the purchase price offer.

If you want to create your own file, the file that you can download from clicking on the button below walks through the steps for creating a football field diagram from the assumed ranges in values from different methods shown in the screenshot below. The screenshot shows above illustrates the end of the process that includes the bars and the tricky to implement labels. Subsequent screenshots on this page demonstrate how to get from the values in a table of value ranges to the football field diagram with data labels. As usual, I have also included a video describing the process.
Excel File with Step by Step Description of How to Create Football Field Diagram and Include Labels
Once you have the data with the different valuation techniques and the ranges for each technique, the key step is create a table with the low range, the increment and the high range. The low range is for the data label that goes on the left and the high range is for the data label that goes on the right. The big deal is to create the increment that is calculated as the difference between the high case and the low case. The screen shot below demonstrates how to set up this key part of the process of making a little table.
Part 2: General Review of Valuation in the Context of M&A
First, Don’t be Intimidated by Fancy Financial Language
Many think that M&A valuation like other areas of finance requires you to talk fast, make things complex and use big words. I hope to go in the other direction and just like with any finance problem first understand the overall value before financing (the enterprise value). In the vein of Modigliani and Miller, once you understand the financing and the rate of return without financing, you In Finance M&A is some kind of magic and requires highly technical and advanced knowledge:
•Sun Edison Quote:
SunEdison will transfer to Seller Note LLC, and Seller Note LLC will pledge, on a first priority basis, additional shares of the Class B Securities in connection with any adjustment to the exchange rate, so that, at all times, the Class B Securities equal to the full number of shares of TerraForm Power Class A Common Stock issuable upon exchange of the Exchangeable Notes shall be held by Seller Note LLC and subject to such first priority lien.
•…repurchase date is after a regular record date and on or prior to the interest payment date to which it relates, Seller Note LLC will instead pay interest accrued to the interest payment date to the holder of record of the Exchangeable Note as of the close of business on the regular record date, and the Fundamental Change purchase price shall then be equal to 100% of the principal amount of the note subject to purchase and will not include any accrued and unpaid interest. In addition, following certain events that constitute “Make-Whole Fundamental Changes” (as defined in the Exchangeable Notes Indenture), Seller Note LLC will increase the exchange rate for holders who elect to exchange Exchangeable Notes in connection with such events in certain circumstances.
Sun Edison Shortly Went Bankrupt
M&A transactions can involve partial share exchange and partial cash payments; different forms of debt can be used as to fund the acquisition. A merger can involve a series of options including earn out provisions. Terms of transaction may lead to accretion or dilution in earnings per share or other measures. Private equity transactions can involve complex debt terms. But here is the key point:
Do not assume that these things make M&A analysis fundamentally different than other valuation analyses.
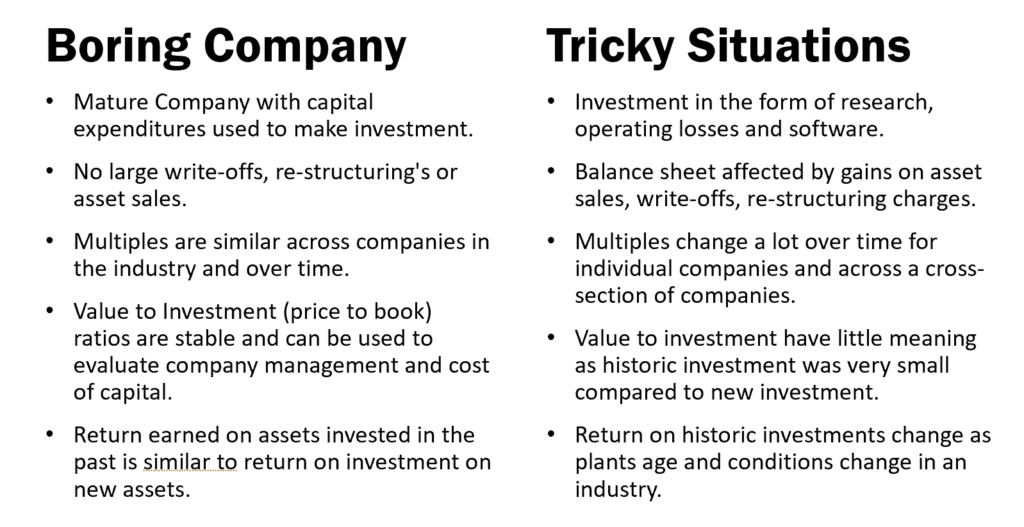
Second, Don’t Forget Valuation Fundamentals and Understand the Difference Between Boring Companies and Development or Start-up Operations
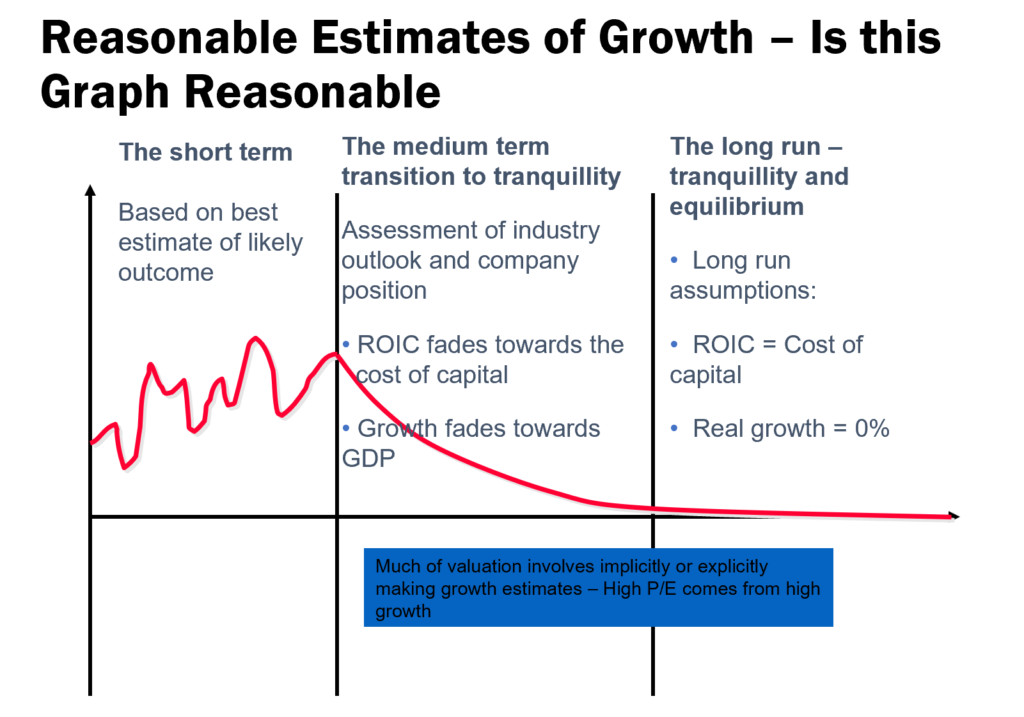
Valuation of boring company and valuation for start-up. Companies are on this curve. Problem is that value M&A issues as if they were only boring companies.
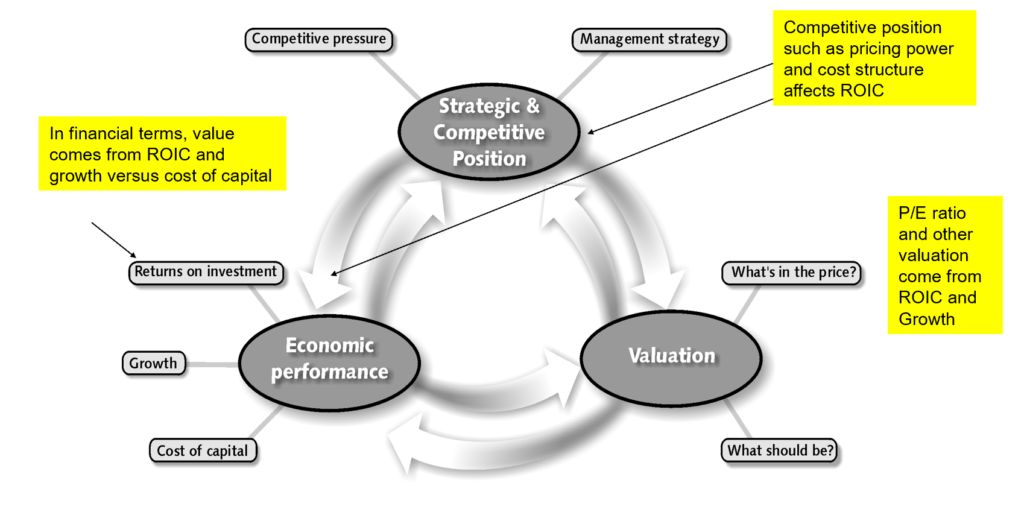
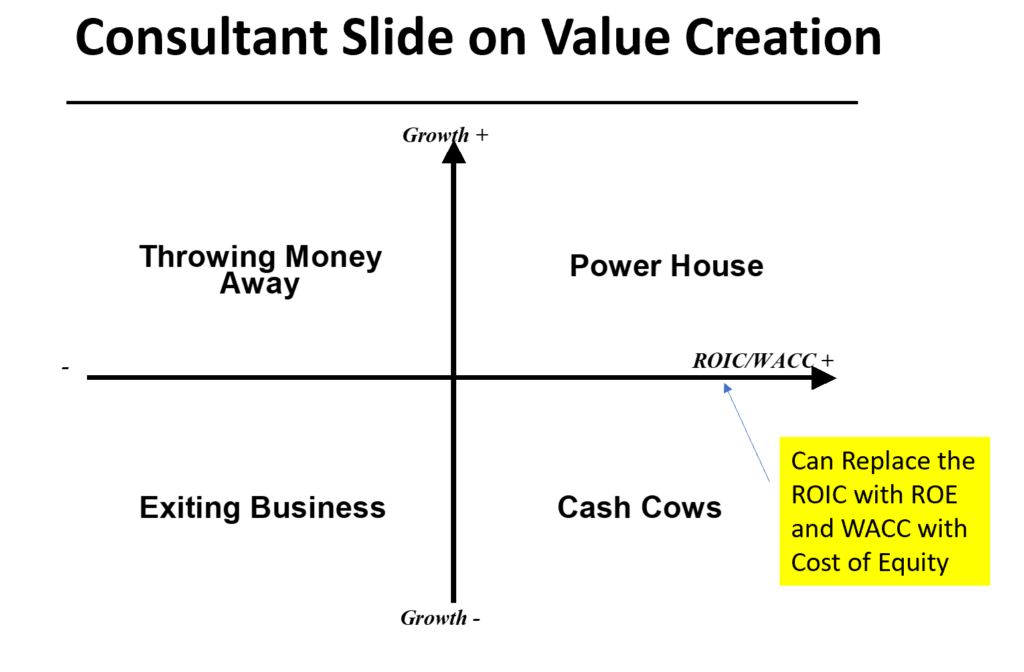
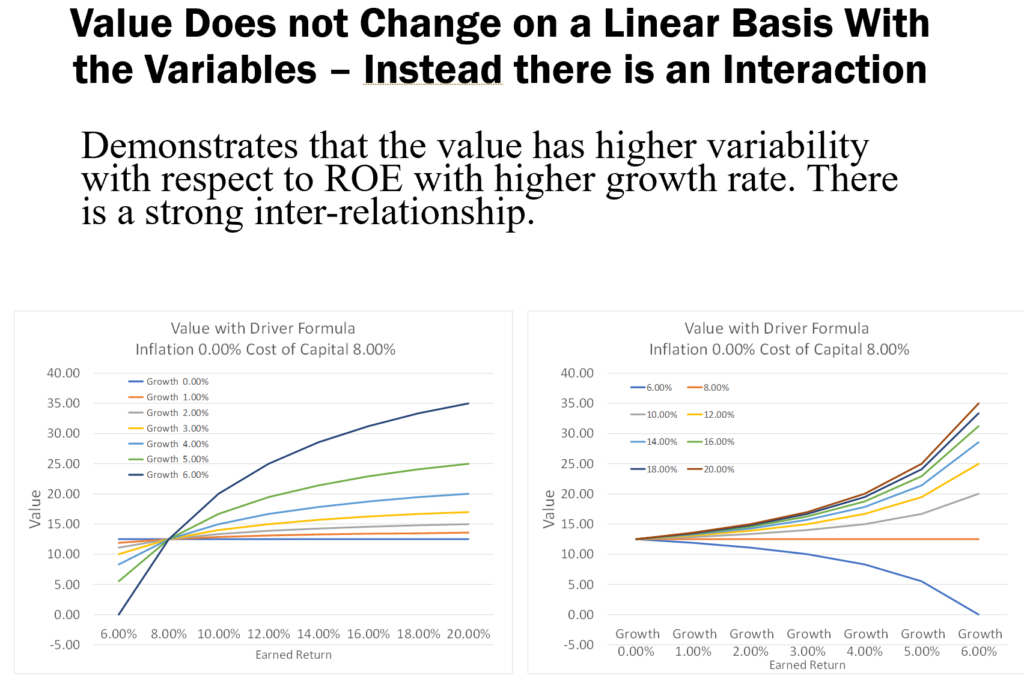
The objective of any corporation is get high returns and then to grow these profits. The value of cash flow from these profits depends on the risk associated with the cash flow or the cost of capital. That means three things drive value:
- Rate of Return on Investment
- Growth
- Cost of Capital Adjusted for Risk
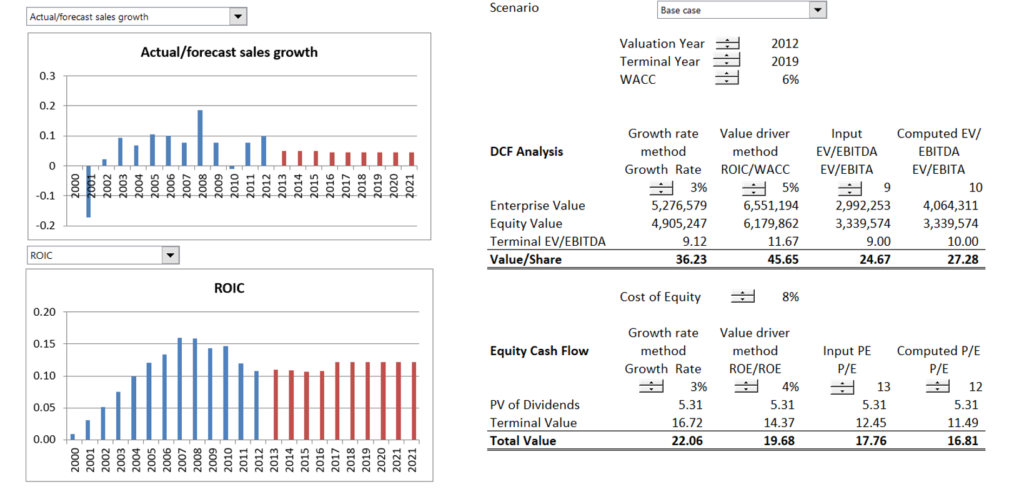
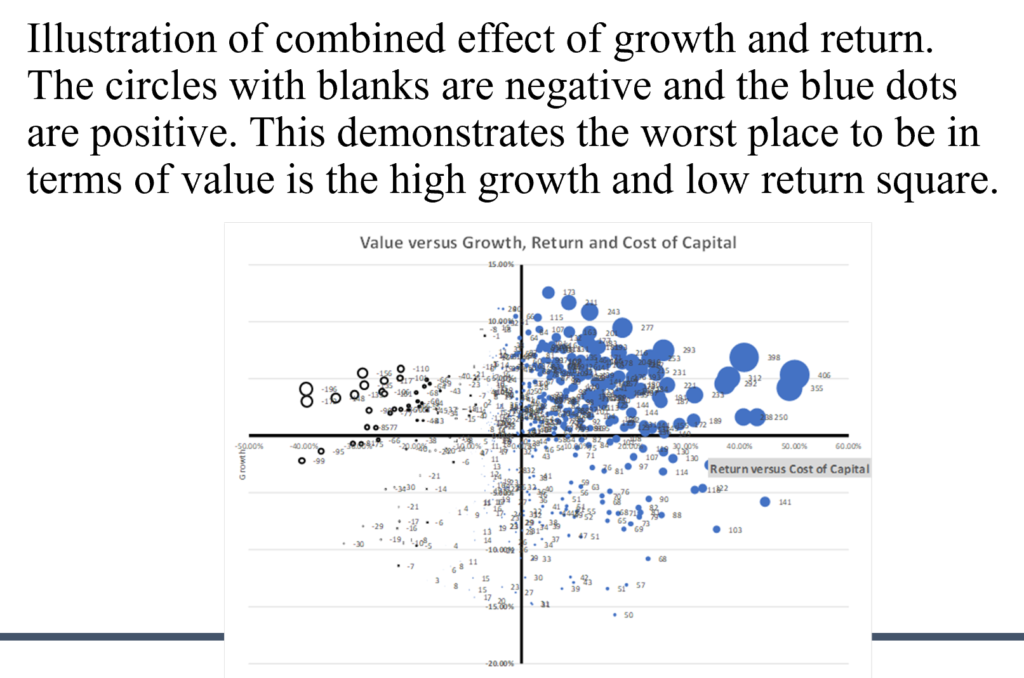
There is no question about theses basic ideas and one can think of valuation as forecasting movements in these three variables. The graph below from a corporate model illustrates how the growth, return and cost of capital variables can be evaluated.
Third, Focus on Return on Invested Capital in Forecasts and M&A Assessment
My son gave me some slides from an MBA course he attended for private equity and M&A. I was amazed that I could not find one mention of ROIC in all of the slides. I also could not find one mention of ROIC in the article.
Let’s say the acquisition is in your industry (it is really stupid to think you can get synergies from operating in other industries).
You would rather buy a company that is earning a low return than a high return because there is room for improvement.
This idea does not work if returns are a function of sunk cost investments like policies in the insurance industry.
- Simple Rule:
- Same industry
- Target has low return on investment
- Target has potential for more growth
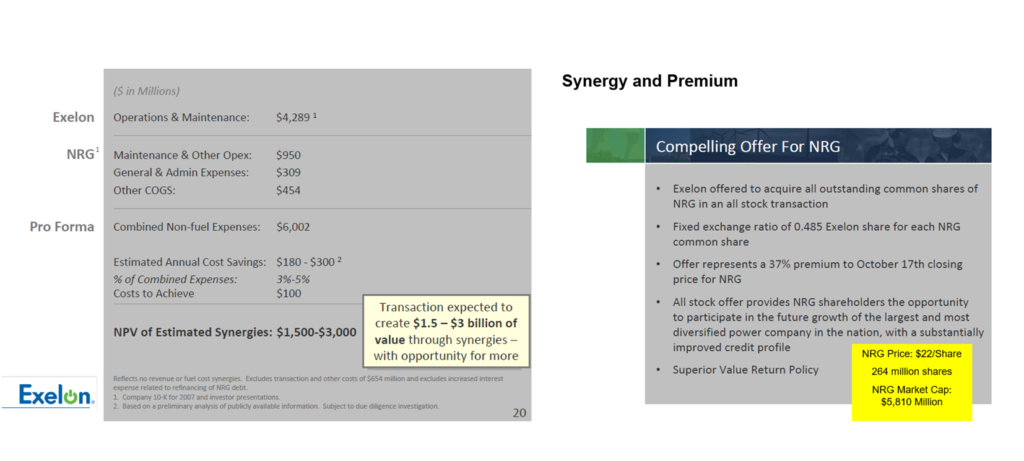
Part 3: Economic Value of Synergies and Premium
Here is the good news about synergy estimates. Nobody can ever check whether you were correct. You will be comparing the actual costs experienced with a hypothetical case. So if any consulting company tells you that they have a study of actual synergies, you should say B.S. A few points about synergies include:
- Some synergies are almost risk free:
- Reduction in overhead costs
- Savings from capacity (e.g. trucks are not at capacity)
- Other Synergies may be pretty sure
- Increase growth with more capital expenditures
- Incorporate target company in your company
- Synergies that are risk
- Revenue increase from new strategy
- Increase price with competition
- Cannot Apply the Same Discount Rate to Different Strategies
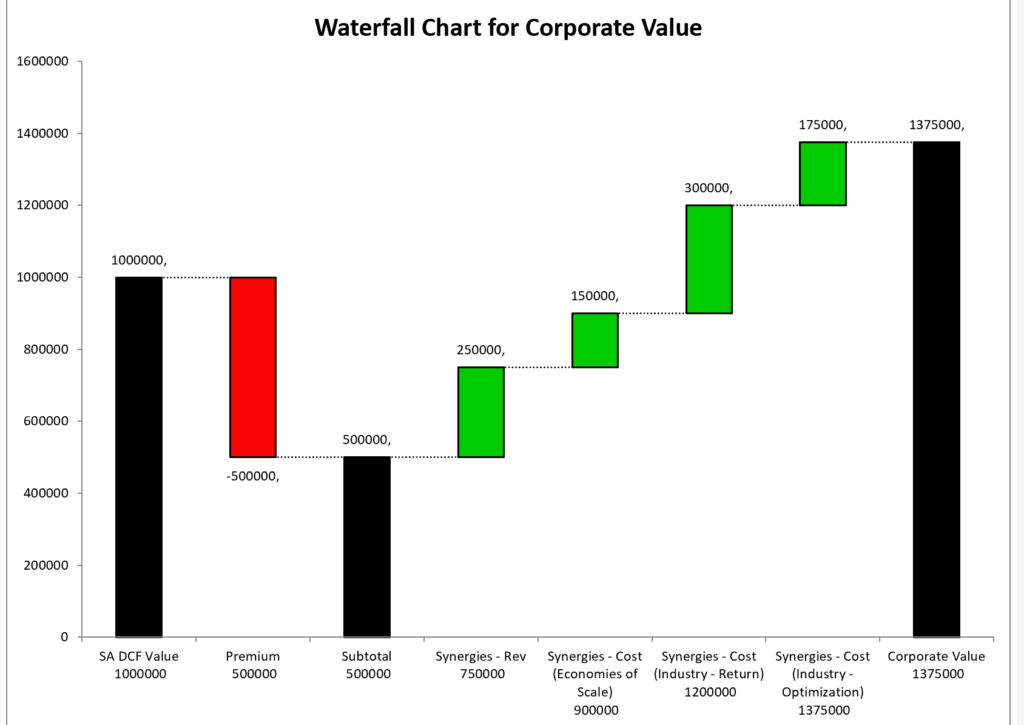
Before addressing the valuation methods, the M&A analysis should consider the most fundamental equation in M&A analysis. This equation is:
Benefits of Merger = Value of Synergies – Value of Premium
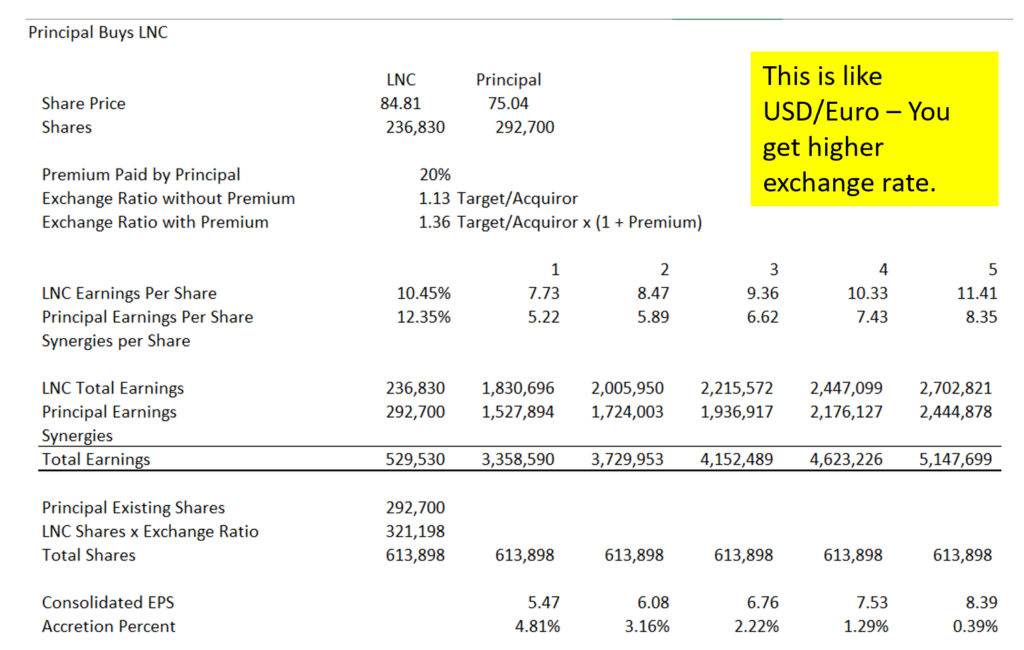
Part 4: M&A Valuation from Accretion and Dilution Analysis
•Protective life purchased at 34% premium. No change in management by Dai-ichi.
•Dai-ichi said the favorable foreign exchange rate Dai-ichi secured in the acquisition of Protective largely offset the premium it paid. The yen has weakened 14% against the dollar since the purchase agreement.
•Dai-ichi plans to set up a holding-company structure in October 2016 under which Tokyo headquarters will delegate more power to North American and Asian regional heads. Understand that management not changed – implies no synergies.
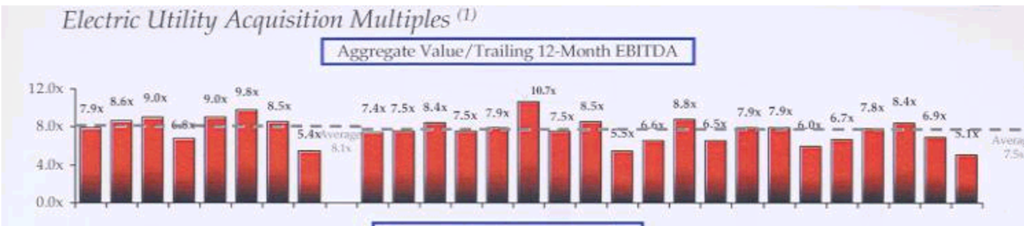
Part 5: LBO – Valuation from Multiples and EV/EBITDA
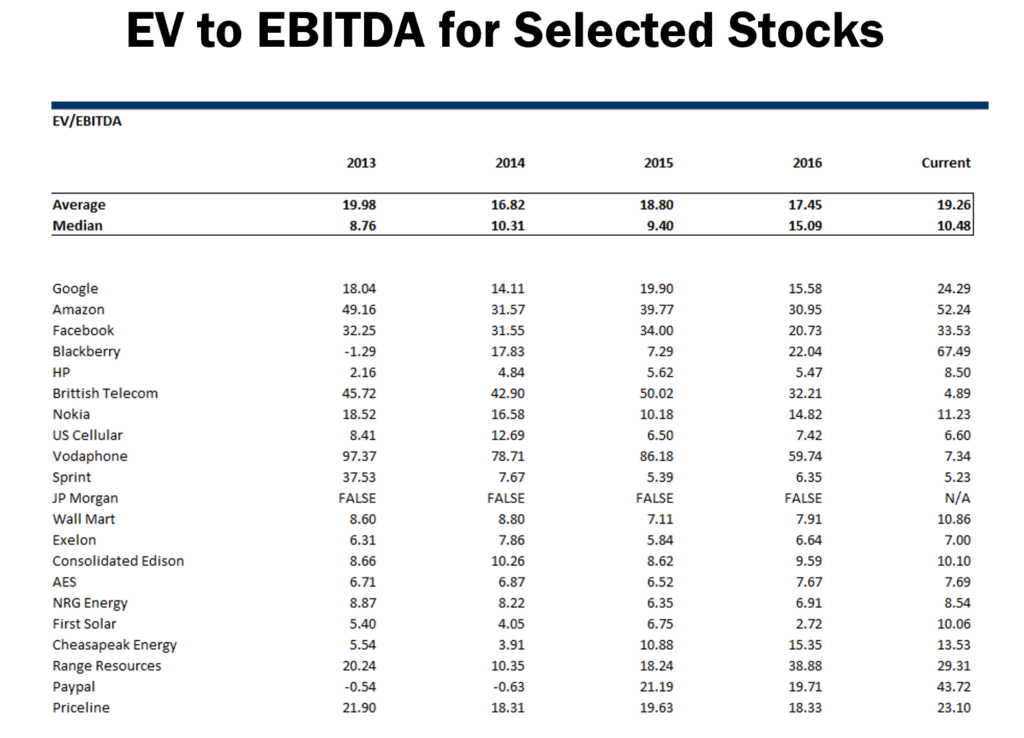
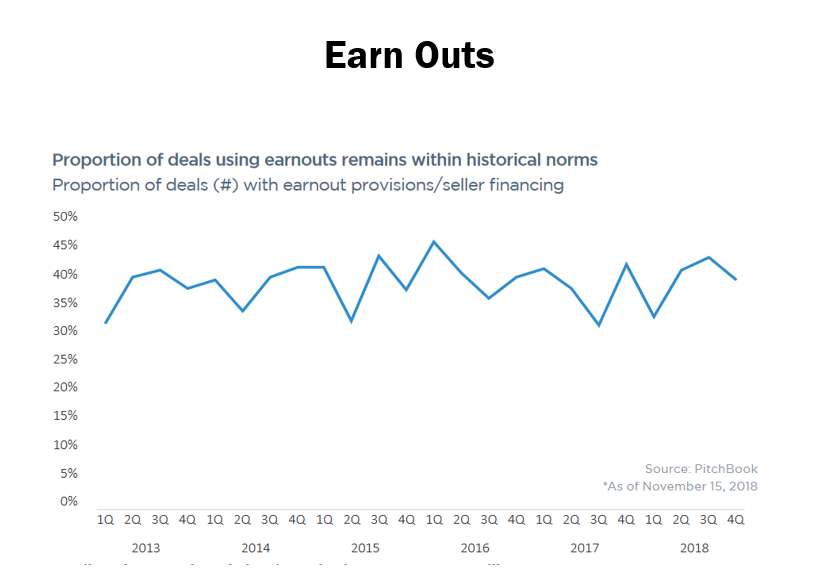
Multiples often used in M&A analysis. Can be trading multiples or precedent transactions. Note how unstable real comparables are over time and across companies.
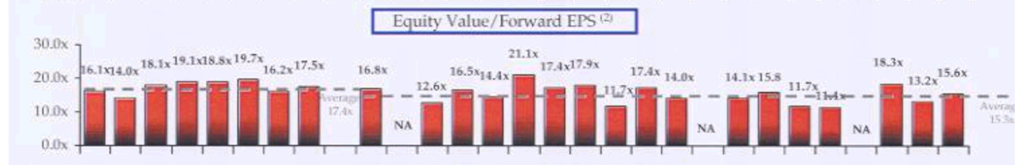
•The most popular multiple is EV/EBITDA (enterprise value to EBITDA). Eighty-four percent of respondents answer that they use this multiple always or almost always (conditional on using multiples). For consultants and private equity professionals it is higher.
•Investment bankers are heavy users of P/E. This may reflect that investment bankers and asset managers are more focused on listed firms. Industry specific multiples are more popular among consultants than among other valuation professionals. EV/EBITDA is also the most popular choice across all education levels and both experience levels, with P/E being the second highest choice.
•The comparables set is crucial with respect to the performance of a multiples valuation. Valuation professionals do not tend to simply pick the Bloomberg comparables; while 60% use it some of the time, only 16% use this set almost always or always. Rivals and firms in the same industry which 91% and 89%, respectively, of respondents use almost always or always.
This problem with multiples also exists in the same boring industry
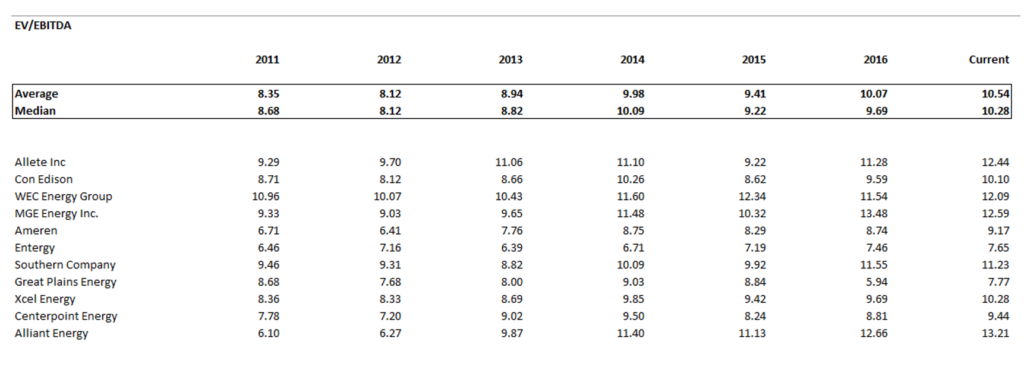
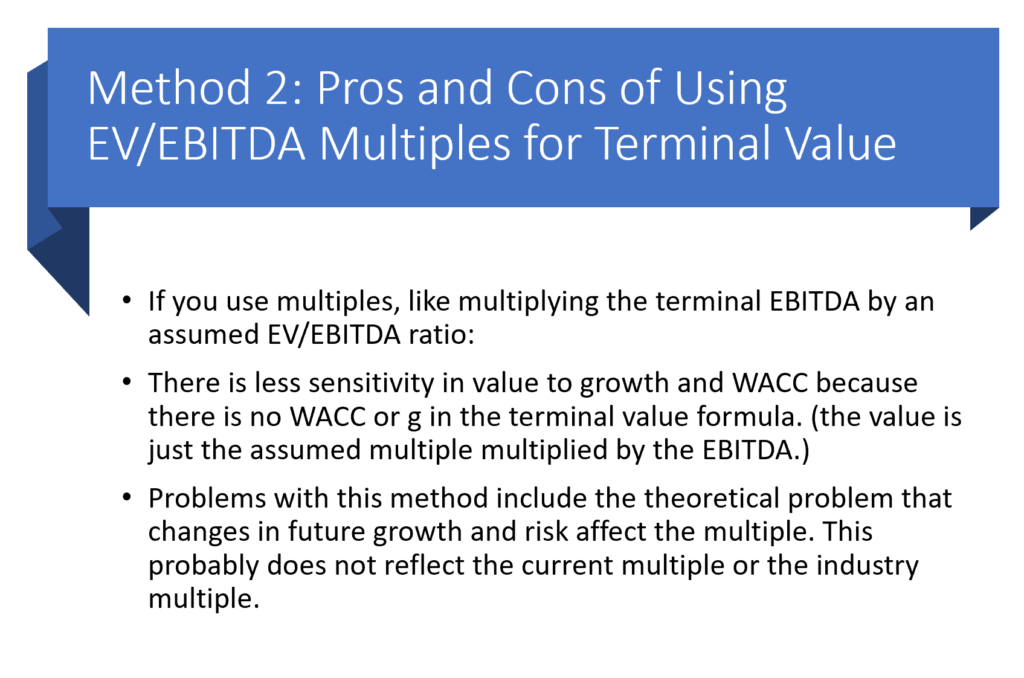
The big problem with multiples is that the EV/EBITDA multiple depends on:
- Changing ROIC
- Asset Life and Asset Replacement
- Tax Rate
- Changing Growth
- Working Capital Investment
- Cost of Capital (Weighted)
For comparison, the comparison companies should have the following characteristics as the company being valued:
- Projected Trends in ROIC
- Projected Trends in Growth with ROIC
- Asset Lives
- Working Capital Investment Relative to EBITDA
- Tax Rates
- Risk and Cost of Capital and Capital Structure
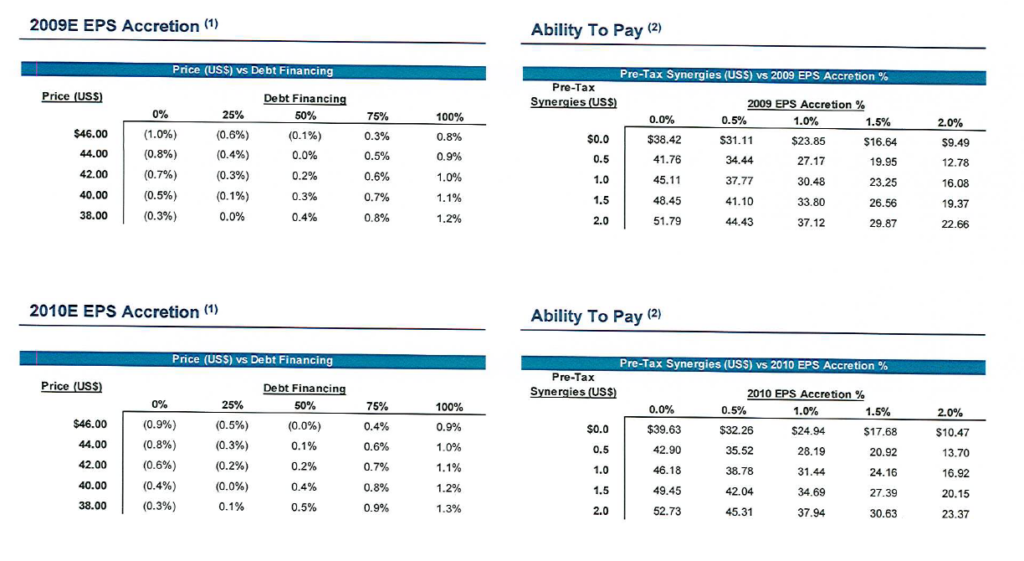
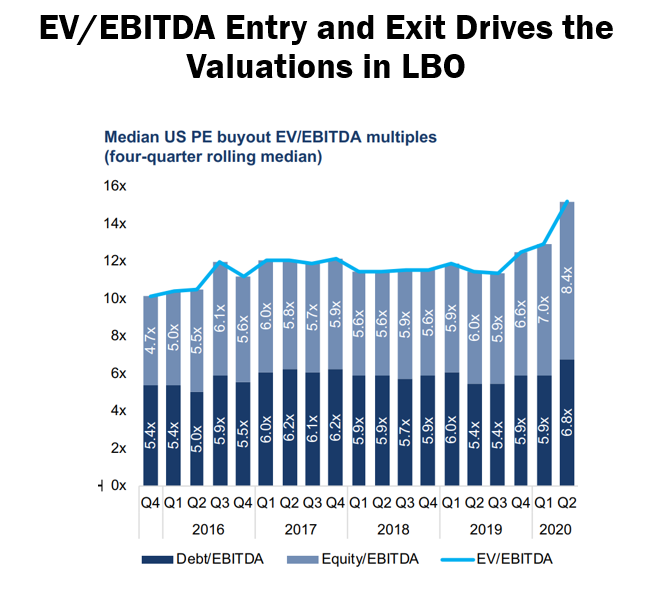
The big variable that drives the LBO analysis is the Entry EV/EBITDA and the exit EV/EBITDA. The slide below suggests that an average EV/EBITDA has increased (which is occuring in the overall market). This could be due to lower cost of capital or due to the changed tax law.
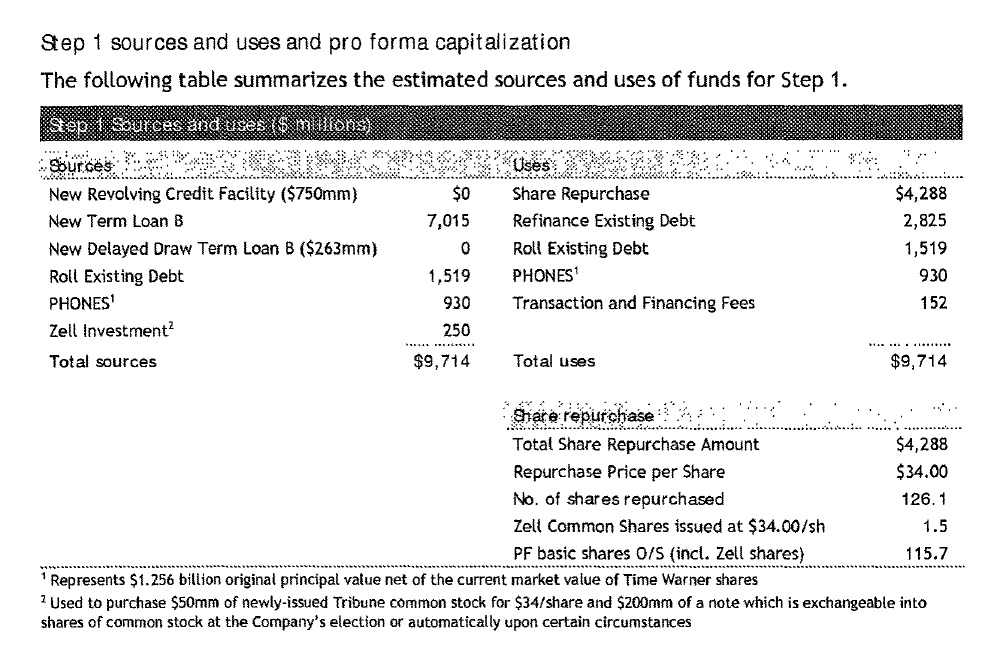
When you develop a LBO analysis you should start with a sources and uses statement. In this case the sources of funds included 1.256 billion of shares of another company. Note also that the debt that is rolled over is included in both the sources and uses of funds. Other uses include the re-financing of existing debt.
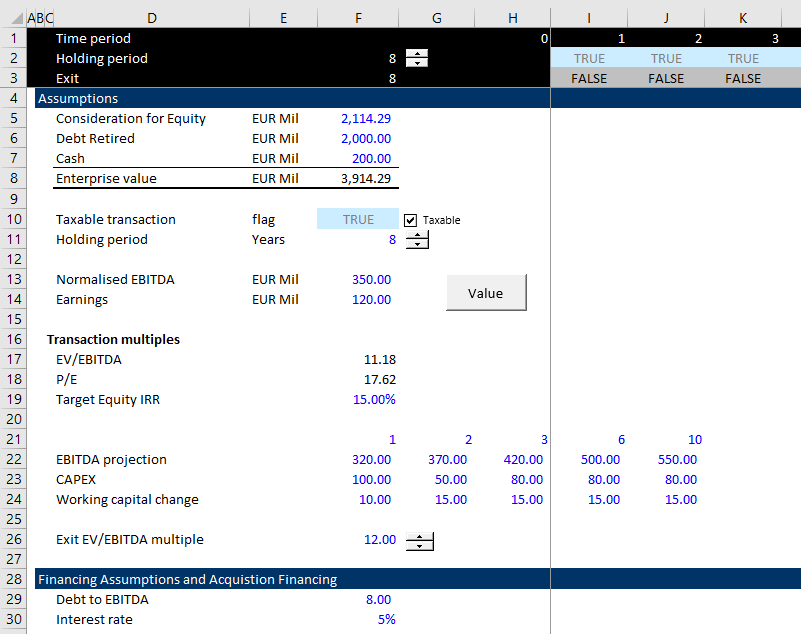
Assumptions for the LBO model with the implied entry EV/EBITDA and the exit EV/EBITDA and the Debt/EBITDA are illustrated on the screenshot below. The key to the analysis is the increase in EBITDA which is like assuming synergies. Note that I also I put in a target equity IRR. When you press the button, it runs a goal seek that re-computes the value of the company to meet the target.
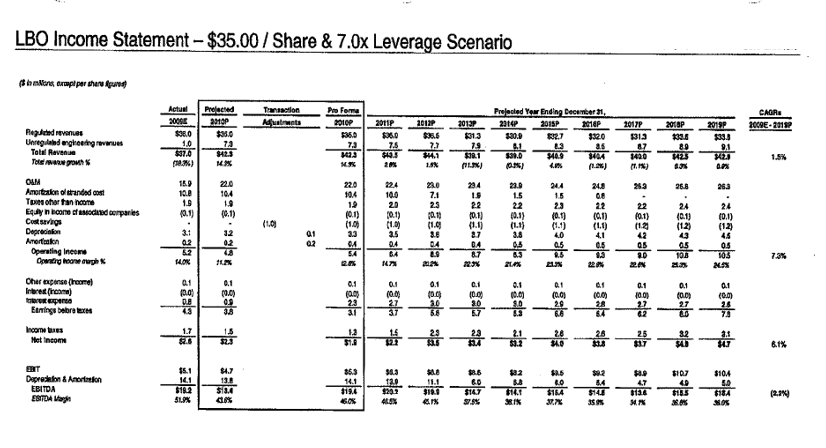
The screenshot below is the example of a simulated LBO analysis for a transaction that did not use a LBO. The IRR is computed using a 7x Debt to EBITDA ratio. The IRR should be shown on this screenshot.
Part 6: Discounted Cash Flow Analysis in M&A
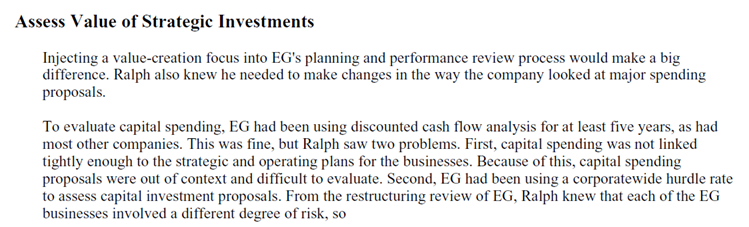
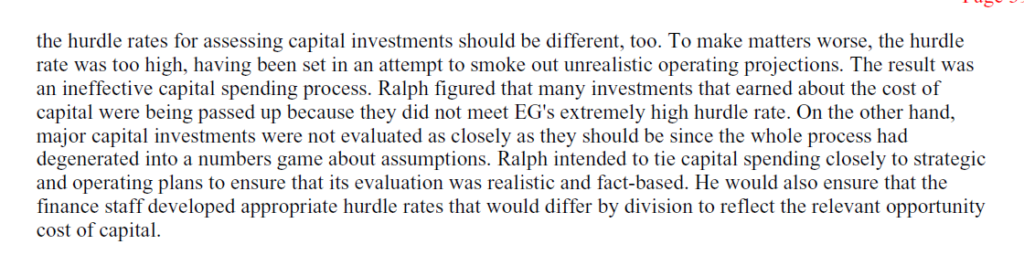
The discounted cash flow model is almost always used directly or indirectly for valuation in M&A. I have worked on transactions where the DCF was used as a basis for negotiations in determining the purchase price where instead of simply arguing about the final number, the assumptions in the DCF analysis were the basis for the discussions. I continue to complain about the beauratric application of the DCF model without carefully considering the time it takes to reach equilibrium, normalisation of cash flows, evaluation of the return on invested capital, application of the terminal value and reasonable thinking about the cost of capital and rate of return.
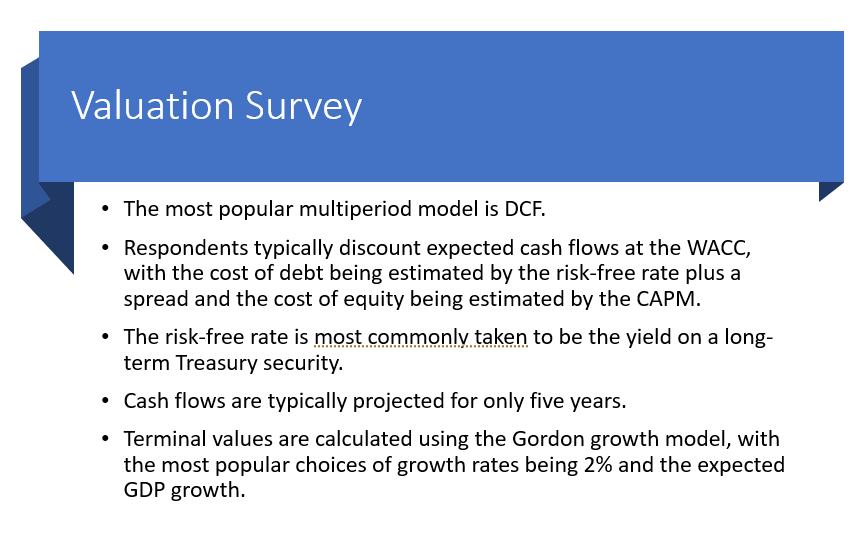
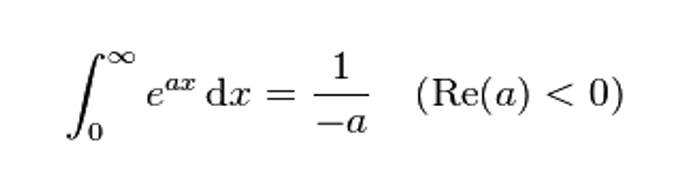
Gordon’s model is only a simple integral formula


Adjustments for Company Size, Private/Public and Foreign Company Operations
At one time I was impressed by adjustments to the EV/EBITDA ratio for private companies where investment bankers make presentations and have rational for why the EV/EBITDA ratio should be lower for private companies because they have less liquidity and their financial statements are audited with less rigour.
Part 7: Cost of Capital in M&A
Here is a quote from the original McKinsey book which is not in the updated versions. The most interesting comment is about how assumptions are changed because the cost of capital is too high.

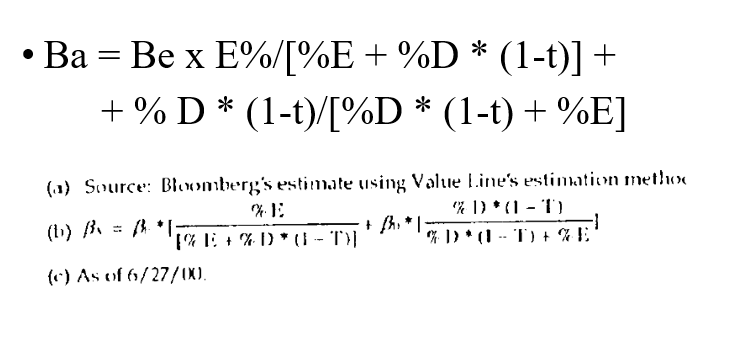
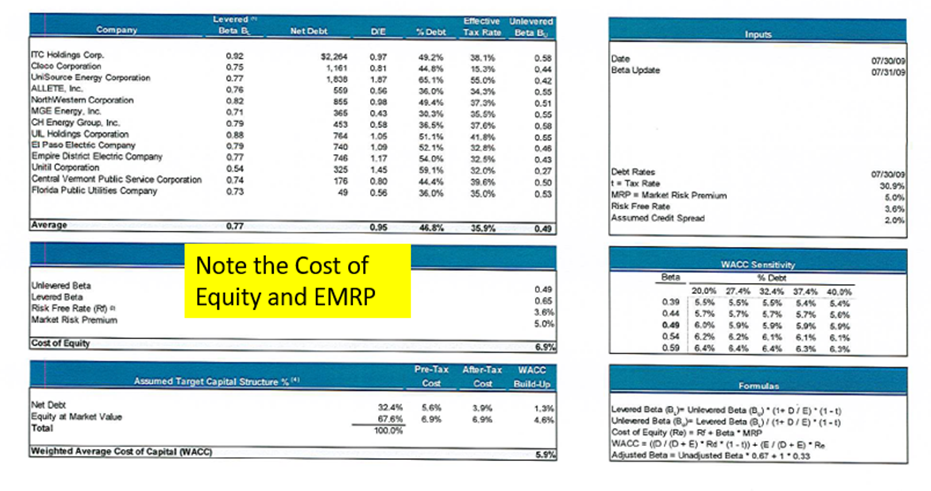
I am sorry to become emotional about this. But it is impossible to call the un-levering and re-levering of beta anything other than total BS. The amazing thing is that this type of analysis is typically made by investment bankers and included in the presentations. It is also part of Harvard Business School cases. The enormous problem is that the implied debt beta is not included in the analysis.
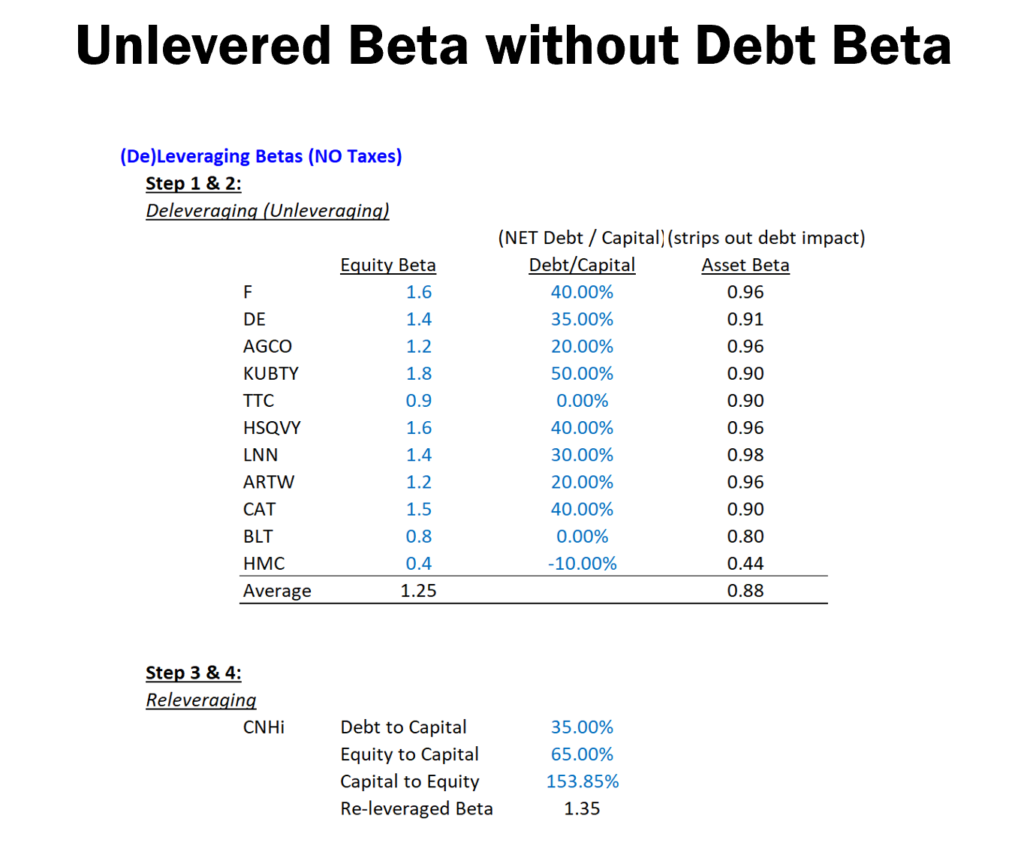
The problem with the analysis below, is that there is no recognition of the debt beta.

If you include debt beta this has a big effect on the cost of equity. If you have a number for EMRP (a very questionable issue), then you can back in the Bd from the credit spread. For example, if the credit spread is 2.5% and the EMRP is 5% and the risk free rate is 1.5%, then:
Rd = Credit Spread + Rf
Rd = Rf + Debt Beta * (EMRP)
Credit Spread = Debt Beta * EMRP
Debt Beta = Credit Spread/EMRP
Debt Beta = 2.5%/4.5%
So, in our example, the debt beta is .55 and not close to zero.
It is clear that when the debt to capital increases, the credit spread should also increase. This implies that the debt beta should change along with the debt to capital ratio.
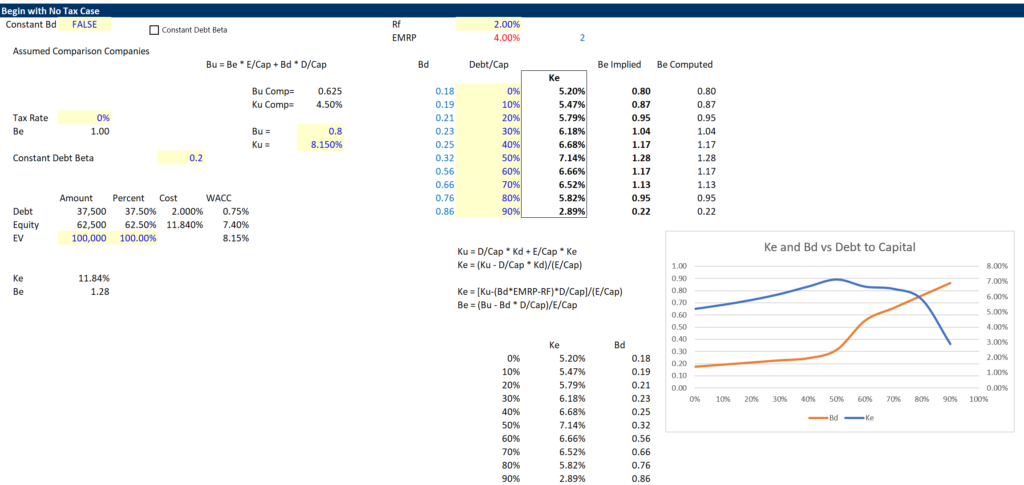
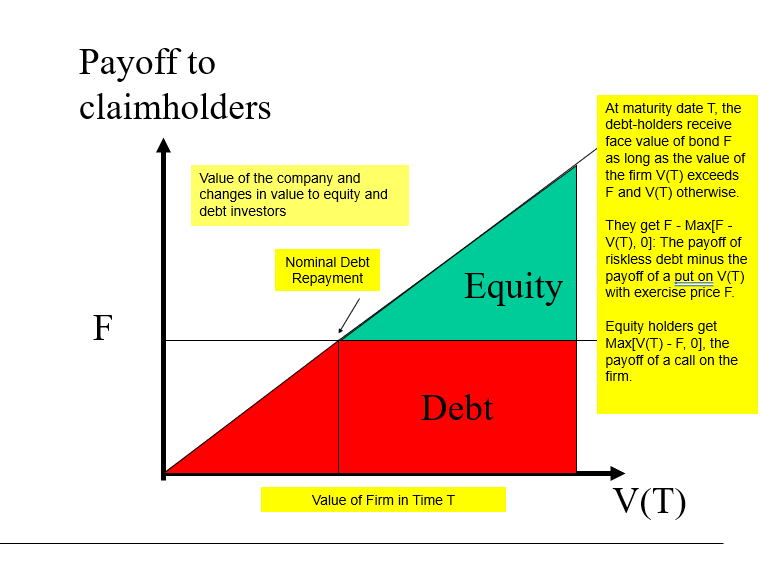
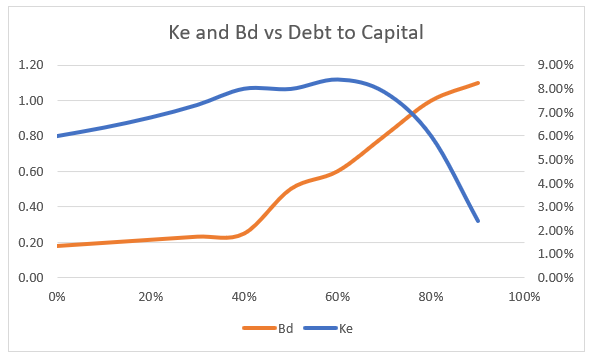
The graphs shows that when the debt beta is increasing (the orange line), then the cost of equity declines. This is completely logical as debt is a sold call put option where the credit spread increases and you have more debt. But the equity is a call option and if you only have upside, the cost of equity should decline.
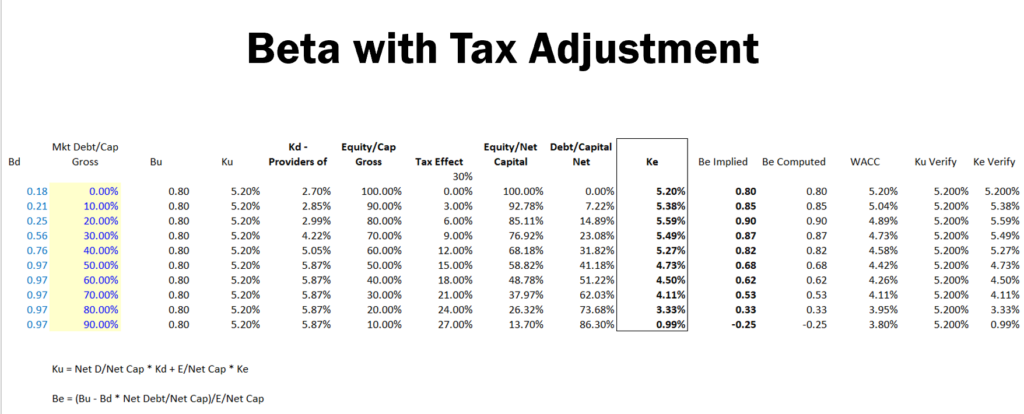
To see why the cost of debt can fall below the cost of equity, you can think about the fact that debt is a sold put option and equity is a purchased call option. If you have a strike price that is closer to being in the money, than equity has limited downside and a big upside. The rate of return on a call option would be much less if you only have upside. You should ask how could you possibly not account for the put option and call option characteristics of debt and equity when you compute WACC.
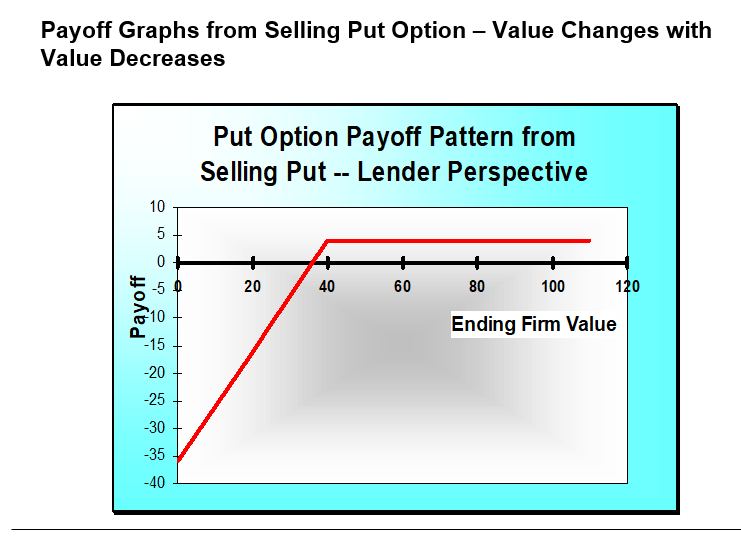
The screenshot below illustrates both the debt and equity in terms of the variation of the value of the firm. When the value is lower than the vertical black line the debt begins to take a loss and the equity is out of the picture.