I have included a case study of a real company that I have used to illustrate the construction of a corporate model. I demonstrate real issues in construction of the case that includes sensitivity analysis and exchange rate issues. The case also demonstrates how to include multiple different debt issues in modelling a corporation. In this case the company provided balance sheets and a revenue forecast. The company provides tea, spices and other goods to international markets. It owns processing facilities and other capital to acquire raw food stuffs from farmers and then makes the exports. The company experienced some problems in recent years and expects to recover. You can download the file by clicking on the button below
Step 1: Incorporate Revenue Forecasts
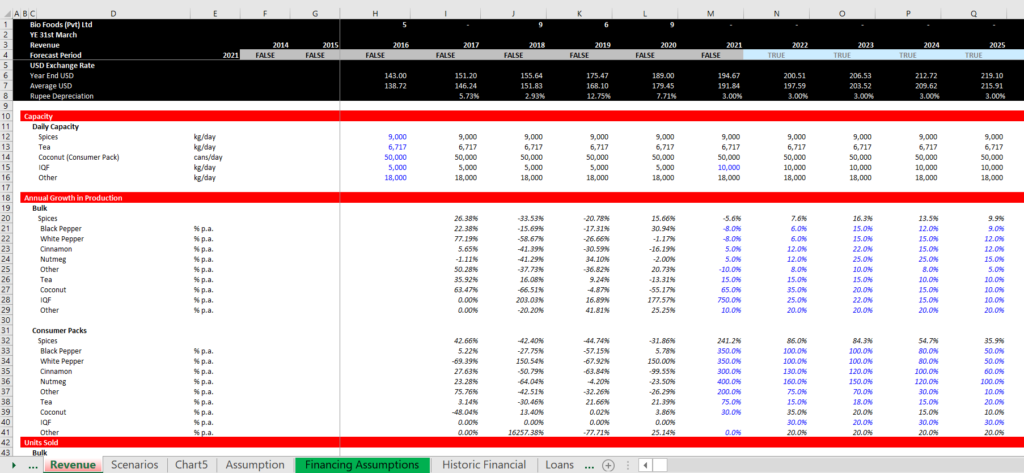
The company provided detailed forecasts of revenues by item. You need to take these forecasts and evaluate what drives the forecasts. The forecasts provided by the company were in an order that did not reflect the simple fact that revenues are made up of prices and quantities. Further quantity growth without capital expenditure growth does not make sense. So you can re-order the revenue forecasts (uses SHIFT, CNTL, + when pasting things around.) The company also made made nice and pretty colours, but it did not show what was driving the forecast. The first thing I do is to re-format the revenue forecasts so that you can see exactly what is driving the forecast, what is an input etc. Note that one of the first things you can do is to create an HISTORIC switch. Not that once you re-format the sheet, you can see how the inputs are working.
You can go to Chapter 1 and find the commodity prices and then check the forecasts against historic levels. The screenshot below shows how you can find the commodity price analysis. I have tried other things to get files, but this one works fast and is effective in comparing different items.
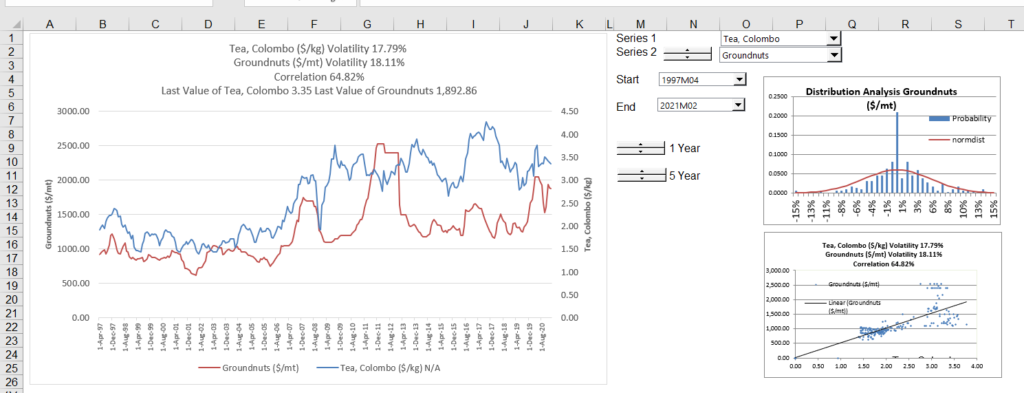
The company sells a lot of tea and products from coconuts. You can compare the prices with historic levels. These prices are in nominal amounts and you need to be careful that you are not over-estimating the prices by applying simple inflation rates to low or high levels. As soon as you have the amounts, you can compare your forecast of commodity prices with historic levels.
Once you have re-formatted the revenue assumptions, you can add the little spark lines (INSERT, SPARK LINES) in the menu.
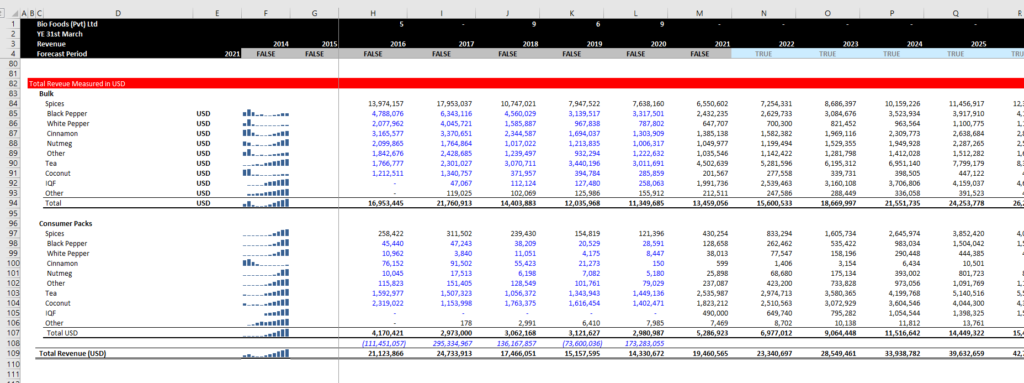
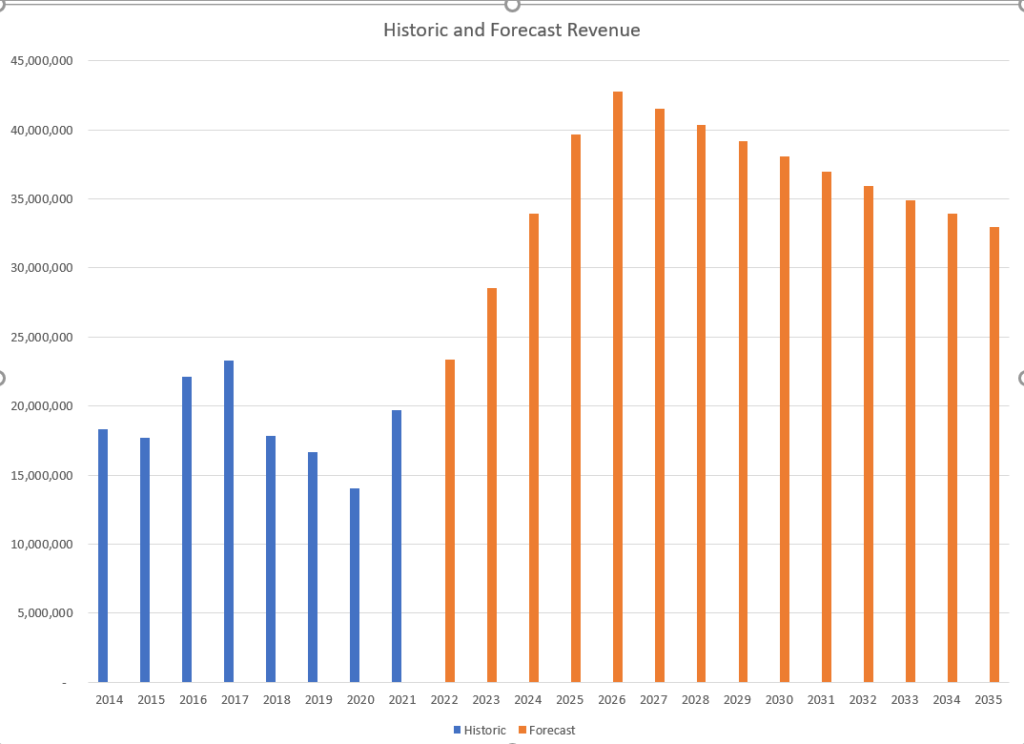
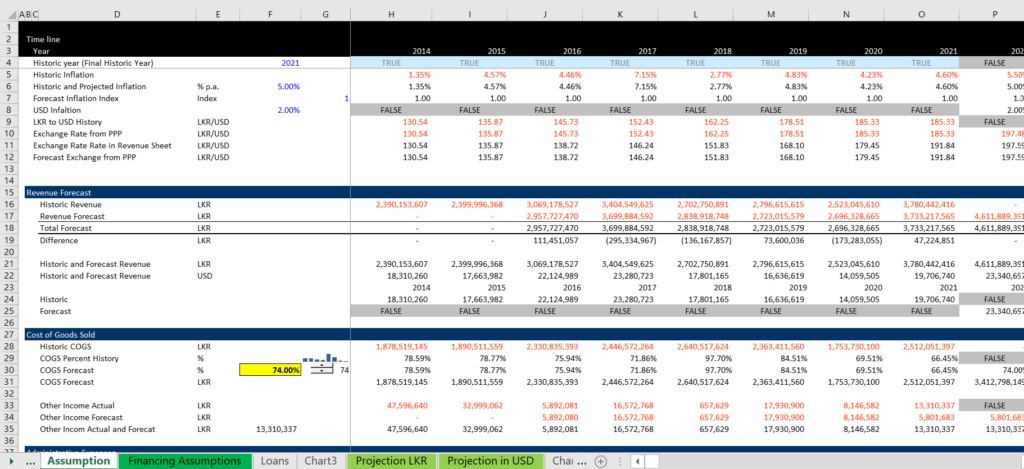
Once you have the revenue forecast re-formatted, may a forecast of the revenues in a major currency and use this to challenge the assumptions. You would like to do something to make the assumptions easy to change and to understand. You can take the major line in the model and then create a line for history and forecast. When you have the history line, use a very simple IF statement with the flag for history. Do the same thing for the forecast and then use the NOT function.
Get the Historic Financial Statements and Create Assumptions
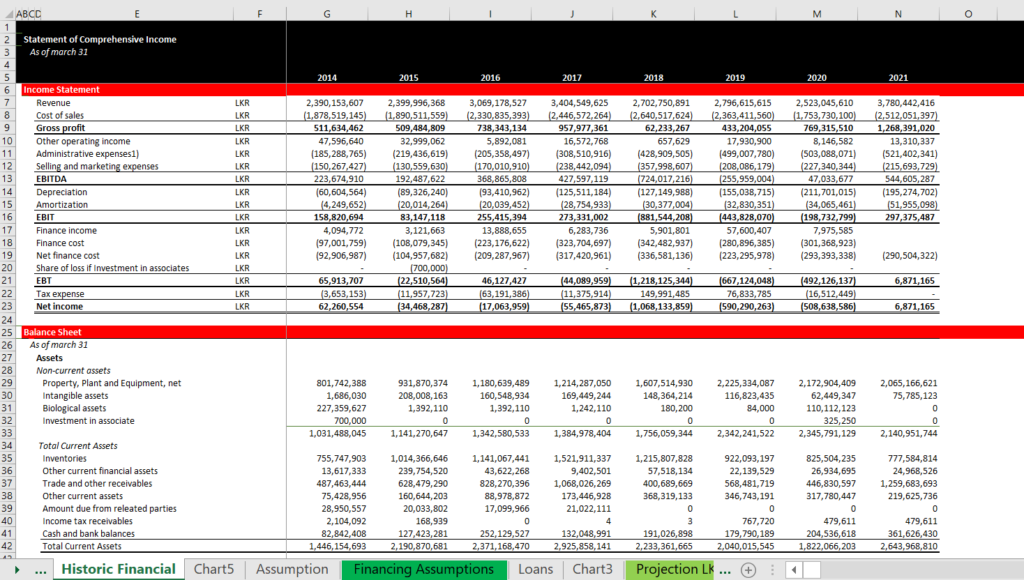
It is essential to acquire historic financials for many reasons in a corporate model. The first reason is that you can find the base for many opening balances including the plant balance, the debt balance, the intangible balance, the equity balance, the current asset balance etc. The historic financial statements are also essential to develop many other assumptions such as the cost of goods sold percent; the depreciation rate; the tax rate; the working capital percentages and so-forth. When you get the financial statements, put them all on the same page (the cash flow is a little less important) and then take out any ratios like gross margin percent. I also use CNTL E and CNTL G to add underlines.
After you have put together the financial statements in a single page, make an assumptions section or an assumptions page. After doing this so many times, my opinion is that you should absolutely not worry about the format of the assumptions.
When I work through the assumptions I work down through the income statement. The revenues and operating costs are elements where you may use a lot of judgement and you remember that you will make some alternative assumptions. You can add simple growth rates and make assumptions as a percent of revenues. In the screenshot below, note how you use the TRUE/FALSE historic switch and then you use an IF statement with this flag. In the case of revenues, you can use the revenue switch to evaluate the growth rates. Note that I have included a spinner button with a reset key so you can do some sensitivity analysis.
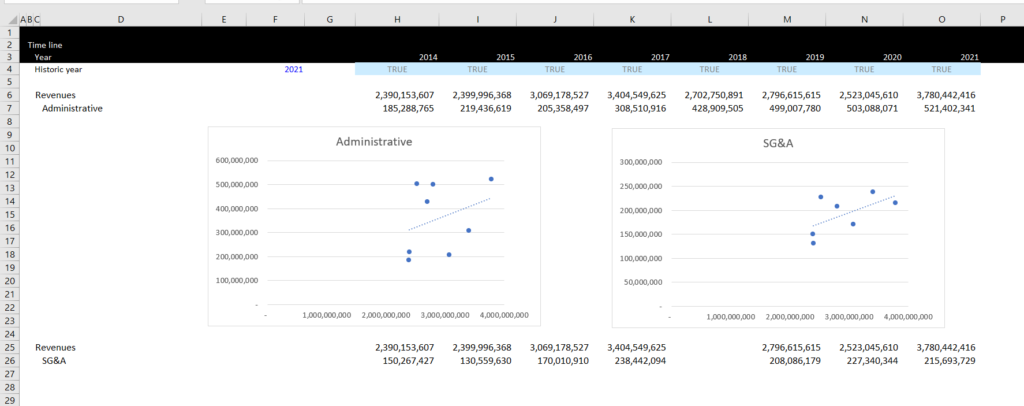
When evaluating a model, how much of the costs are variable and how much are fixed can be an important issue.
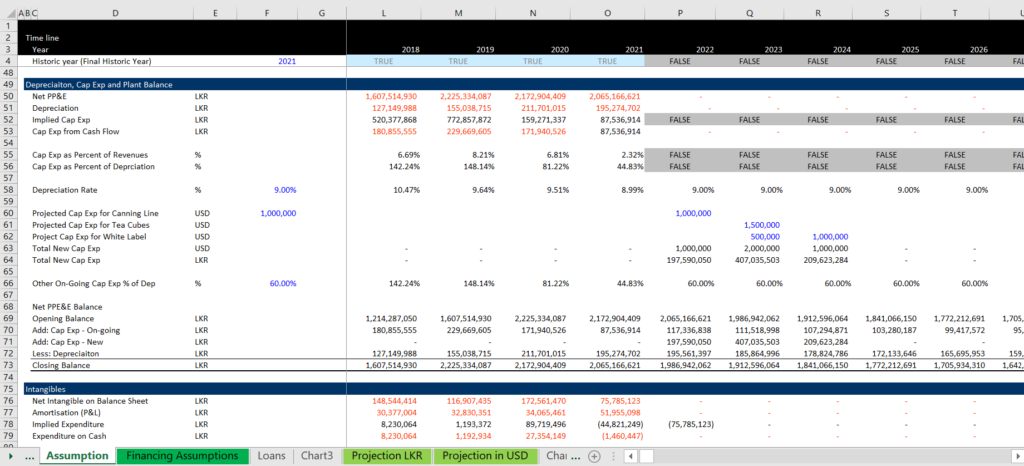
Then you move to depreciation, plant balances and capital expenditures. This is a little more tricky and where the flag is most essential.
Financial Model and Financing
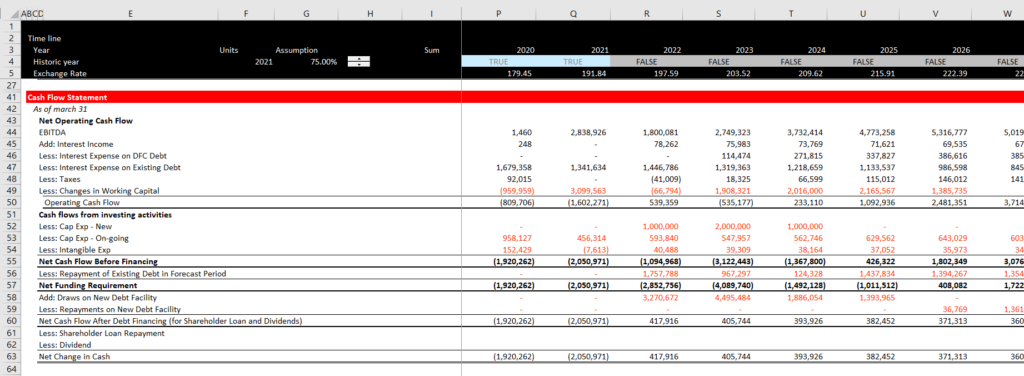
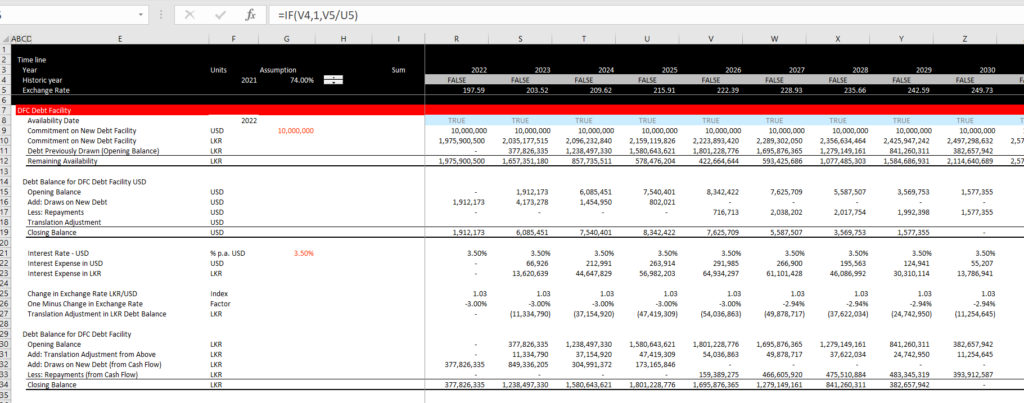
In the financial modelling sheet you will make forecasts of the cash flow and the profit and loss. The cash flow statement will provide a surplus or deficit in cash flow that you must do something with. Above the financial statements you can put in the debt facilities and or cash facilities that result from the cash flow. For me this is an important structuring element. In this example, the debt facility is expressed in USD, but the financial model is in Rupee. When you set-up the financial statements, if you set-up things like this with an exchange rate at the very top that is always in view, the modelling challenge is taken away. Note that the closing balance is zero for the debt issue in both issues. The debt is computed in USD and the minimum is tested in USD. The translation adjustment uses the percent change in the exchange rate and adjusts the opening balance and not the closing balance. The draws and repayments are computed from the cash flow statement. Note that no dividends are allowed.
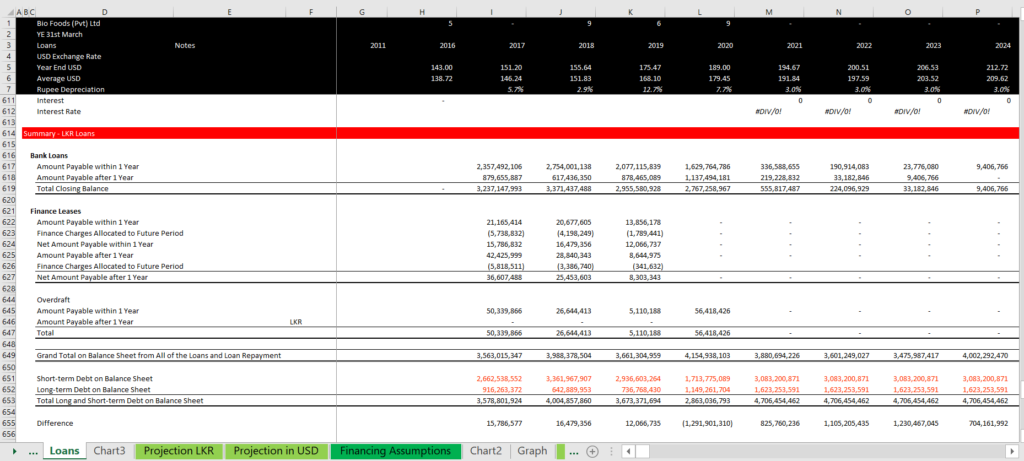
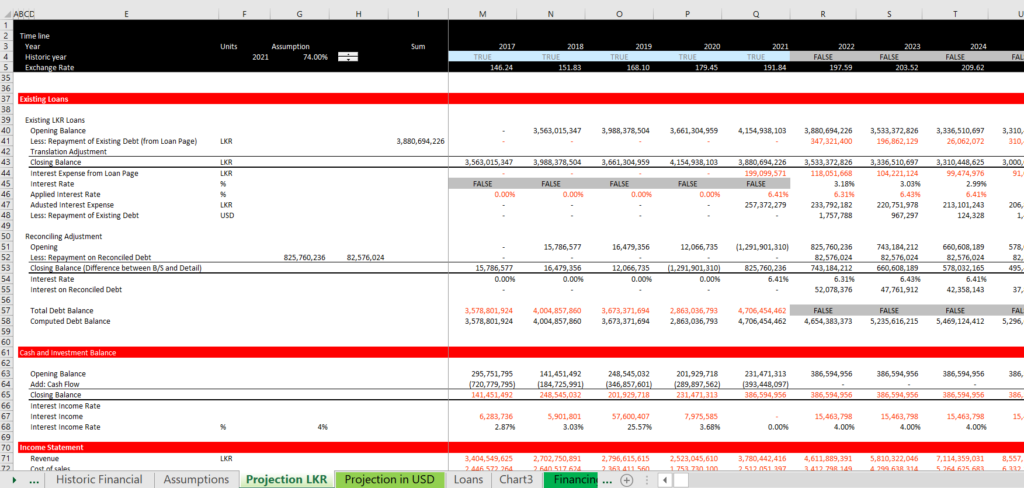
The issue in this case and other corporate modelling cases is how to deal with existing debt. In this case, the company has provided detail of exactly how the repayment is made and these issues are accumulated.
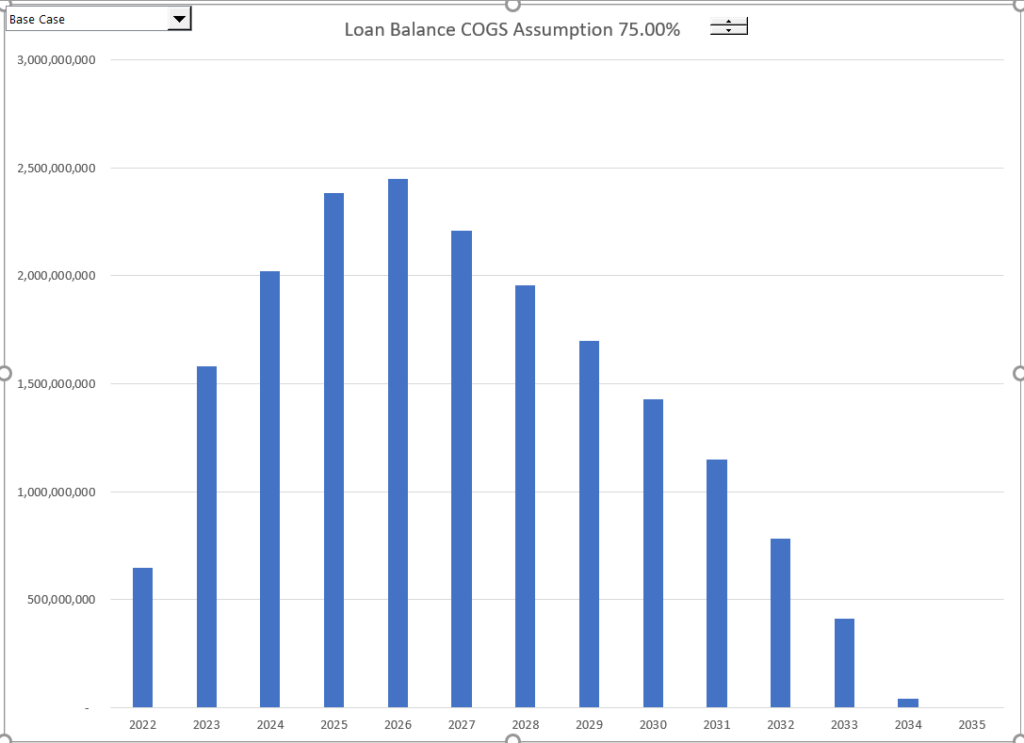
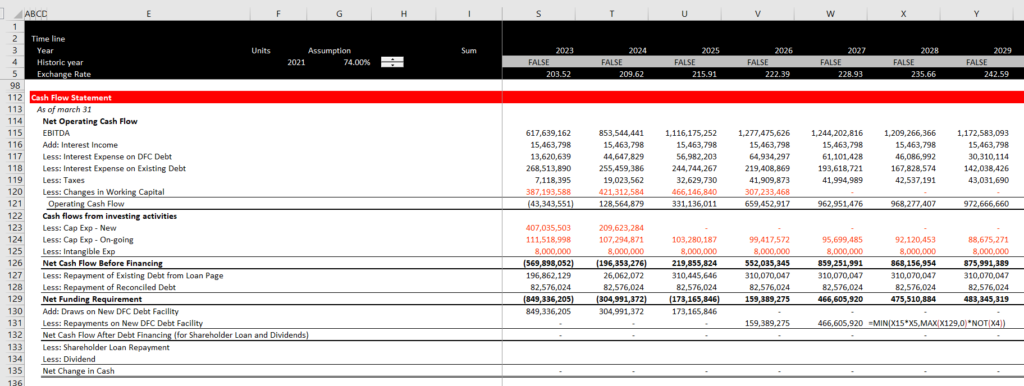
After setting-up the debt, you are ready to compute the cash flow and the profit and loss statement. The repayment is computed with the standard min and max functions. Note the the cash flow statement is re-stated in a simple way and the cash flow before the loan is computed. Once you reach this level, you can use the MIN and MAX functions to compute the draws and the repayments on the new loan. Ultimately you can evaluate what break-even assumptions allow the loan to be repaid. See lines 129 to 131.
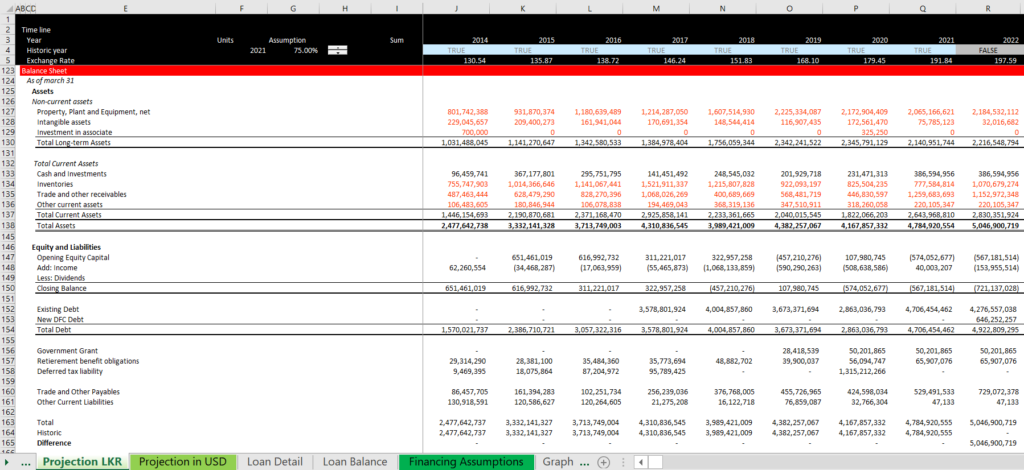
After you complete the cash flow statement it is time to balance the balance sheet. I suggest going step by step in the following way:
- Balance the historic assets
- Create and equity balance from the opening balance and income and dividends and then balance the liabilities
- Work on the forecast balance sheet and when you have a difference compute the accumulated difference. Don’t give up.
The balance sheet using this technique is illustrated below