This page walks through analysis of a micro grid to evaluate the costs and benefits of adding different technologies given alternative demand profiles. The definition of a micro grid is an independent system that can produce energy without support from a central utility. The analysis of a micro grid is something like building a supply and demand analysis for a utility company and includes much of the analysis discussed in the battery part of this menu. This once was called least cost analysis or least cost studies that had to be performed before new resources would be added to a system. Microgrid analysis includes analysis of different possible demand profiles, solar patterns, battery sizing analysis, seasonal hydro analysis, diesel cost analysis and other subjects. In addition the microgrid analysis includes evaluation of corporations that construct solar home systems and microfinance institutions that my finance microgrids or their components. In making the analysis I have tried to start with simple exercises and cases that form the basis of the microgrids and then move to more difficult subjects.
As with other parts of my analysis, I urge you not to use anything I say as some kind of bureauratric instructions. I hope you don’t listen to me too much and instead you take a few of my ideas and look at things in a different way. I have included two different examples of how you can structure the model in the files below.
.
.
Structure of Microgrid Analysis
The analysis of any utility system, whether EDF in France or a microgrid in rural Rwanda should start with demand analysis and then move to how the demand will be supplied from different sources. If there is no storage from batteries, the sources and uses analysis can be pretty simple. It gets more complex when you must determine the amount of battery capacity and you must evaluate the timing of the charging and discharging of the batteries.
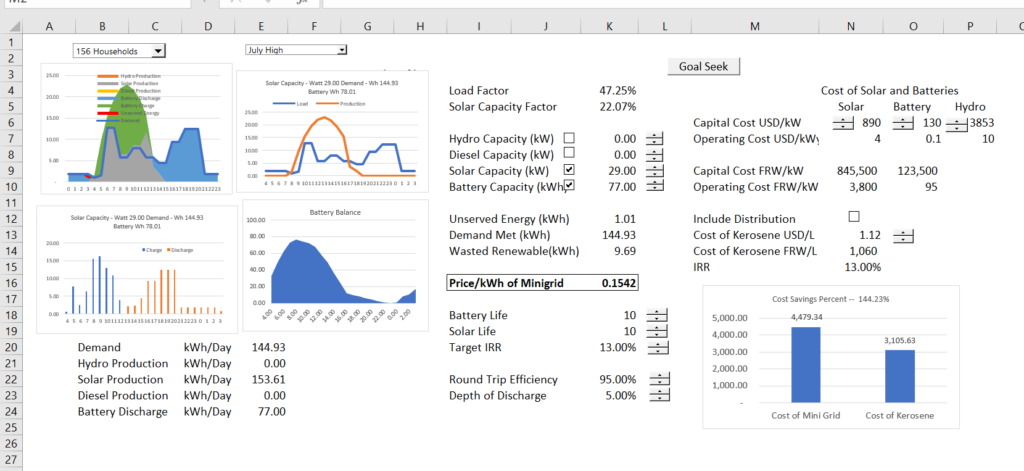
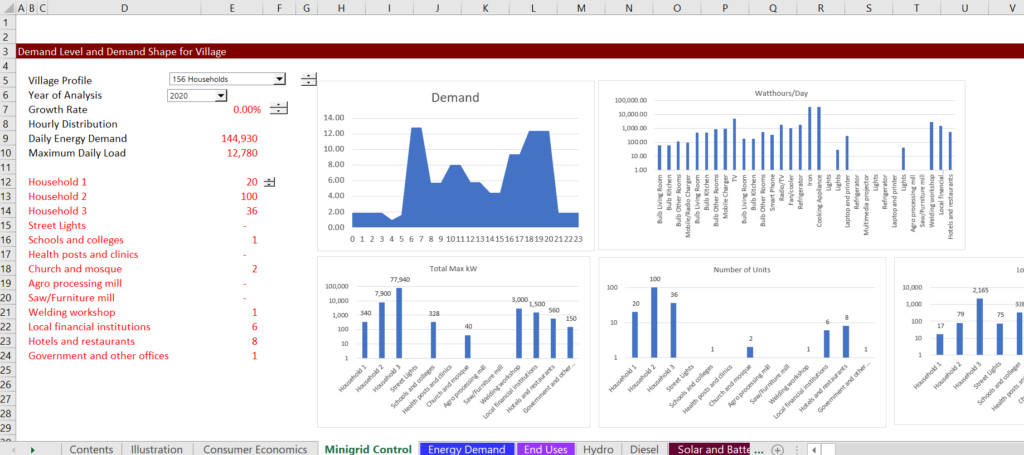
Once the sources and uses of energy are determined, the sources and uses of funds can be used to convert the physical data into financial data. You need to evaluate the cost structure of different sources of energy including the capital cost, the operating costs and potentially the fuel costs. The screenshot below illustrates the summary page where you can evaluate diffent supply strategies given the demand.
.
.
Part 1 – Demand Analysis
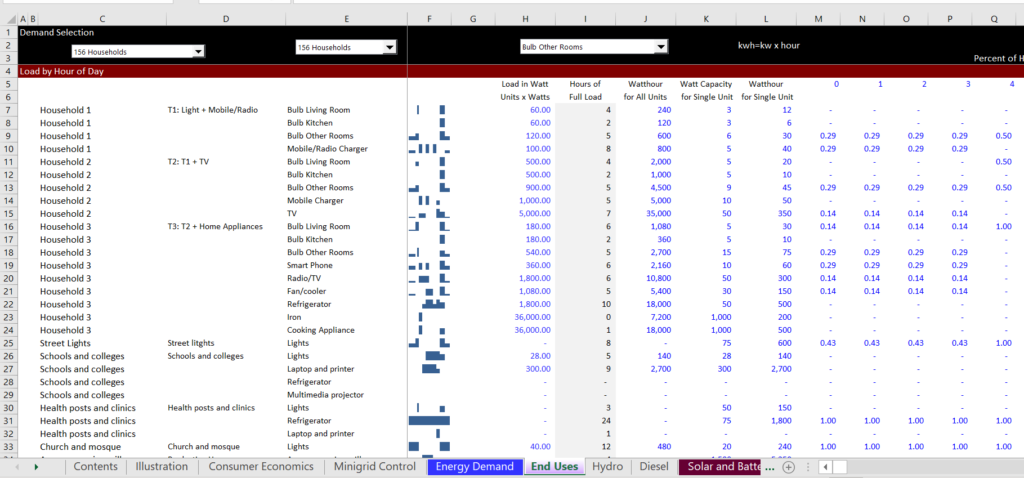
For the demand analysis you can put together different uses to try and estimate a demand curve. In some of the analyses that I have seen, the amount of electricity demand from different uses is derived. You can estimate the hourly usage of an appliance, whether it is a toaster, a fan, a battery phone charger or a light bulb. You can also add the same kind of end use analysis for businesses, religious buildings, municipal buildings and other entities. You can find the file I am referring to in the folder named mini grid analysis. I will work through some of the pages in a file that is located in the folder.
Part 2 – Hourly Solar Analysis
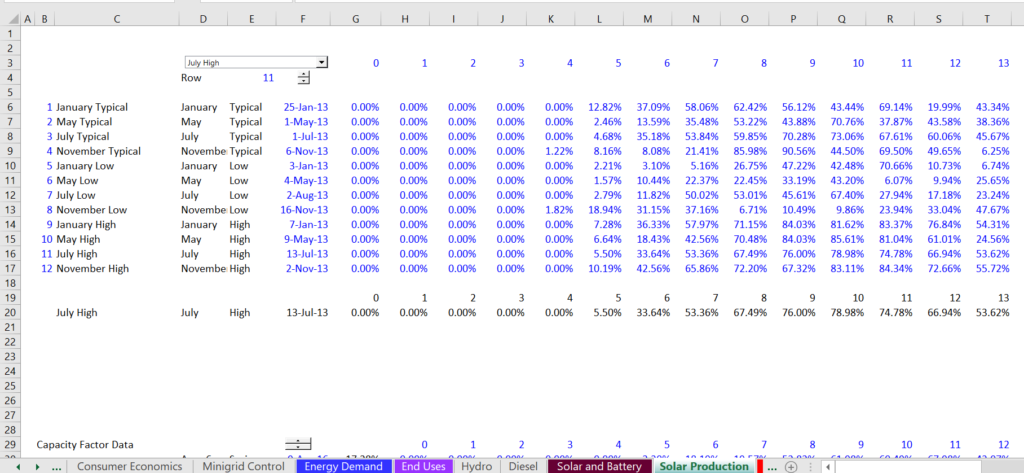
Once you have developed the demand, if you are evaluating solar power as a source of energy, you should extract solar power analysis. You can extract solar data for the solar resource from the EU PVGIS website. To limit the amount of data I have extracted different solar profiles from alternative seasons. If you are in a place without a rainy season and without many clouds the difference between seasons will be much less and you can make the system more economic without as much battery and extra solar panels. In the screenshot below taken from a page of the mini-grid model that you can download, I have selected different hourly profiles.
Part 3 – Hydro in Mini-Grid
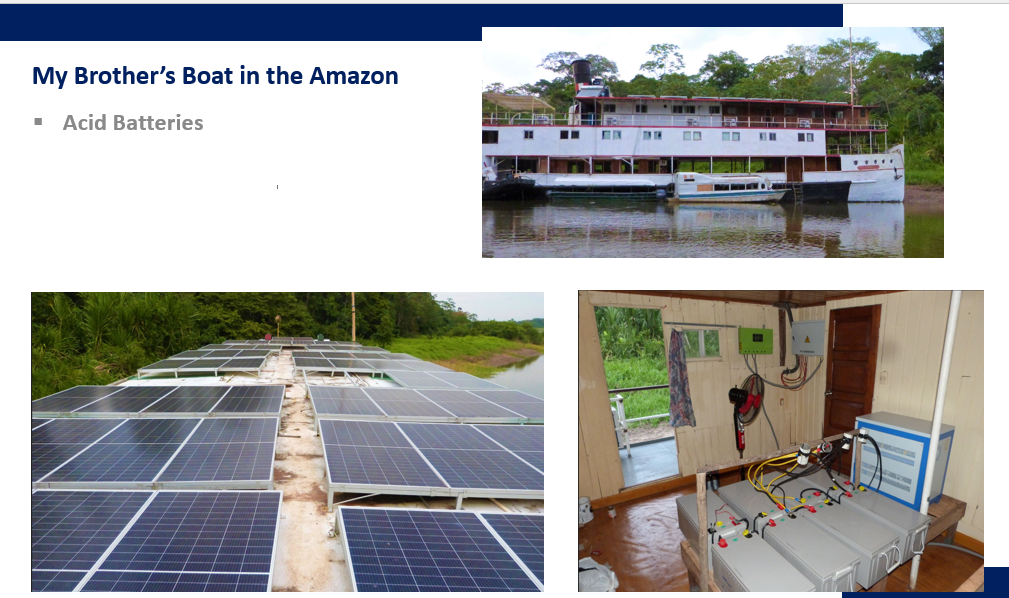
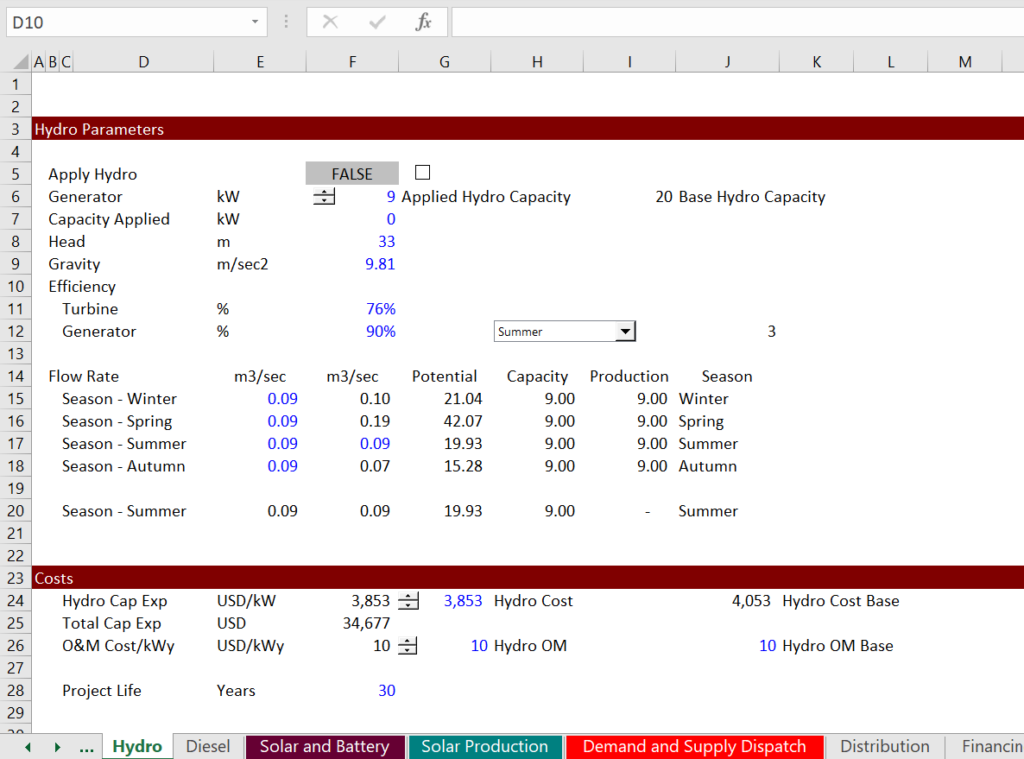
Unlike solar, if you include a mini-grid the hourly distribution would probably not vary like the solar distribution. But the hydro may vary by season and have more production when it is rainy than when it is sunny. Maybe the hydro works well with the solar. The hydro production depends on the volume of water flow, the head and size of the generator. The picture below illustrates how the head works and how a mini-hydro project can work. The water must be diverted and moved to a generator. Then, the water is flowed back to the river.

Part 4 – Supply Analysis without Batteries
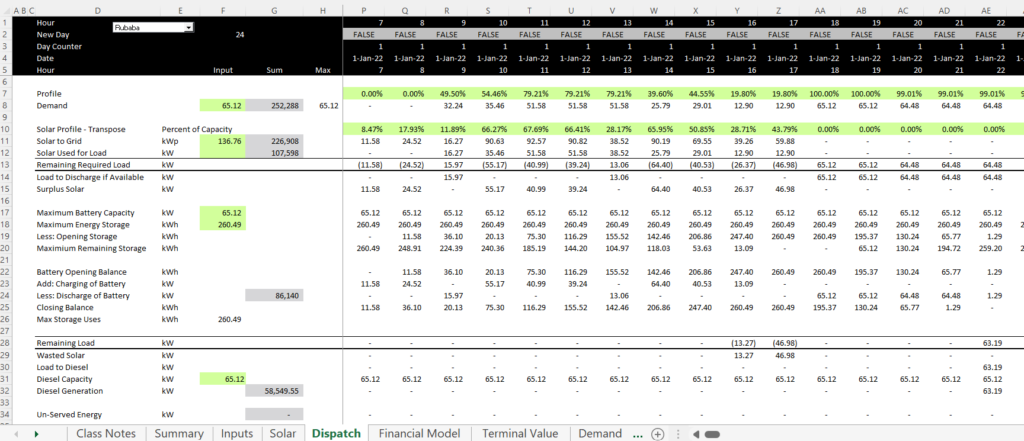
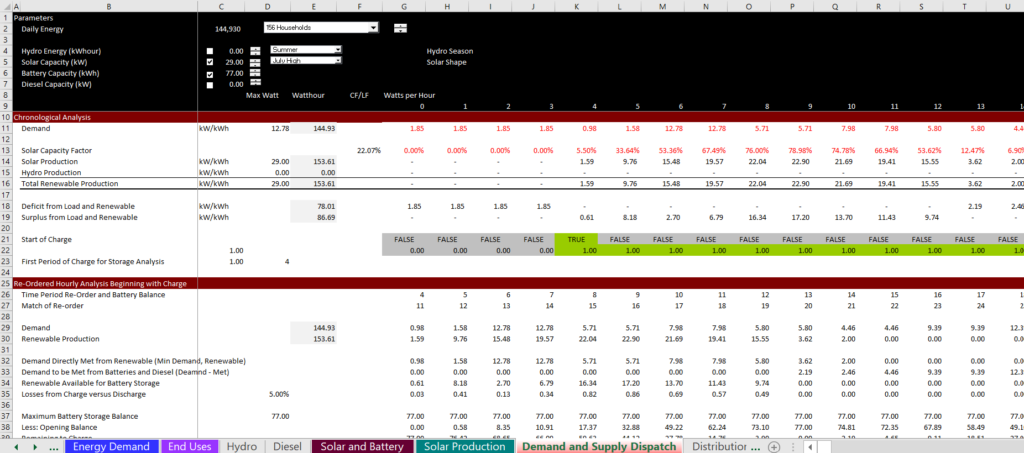
Once you have defined the resource from hydro, solar or other sources including diesel or something else, you are ready to put things together. When putting a dispatch together, you can start with demand and then use the MIN and MAX functions to evaluate whether you can meet demand in a particular hour. As with the dispatch of a large utility company, you would start the dispatch with resources that have low marginal cost. In our case, the hydro and the solar have zero marginal cost and you would put this supply in first. To anticipate the storage, you can move the timeline around and begin with the first hour where you have enough demand to meet the supply.
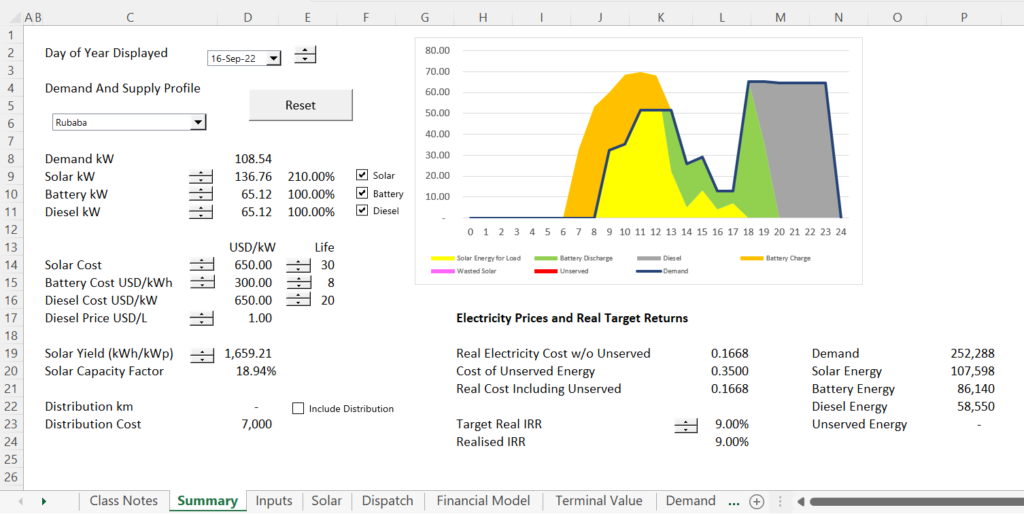
The demand and supply analysis is illustrated in the screenshots below.
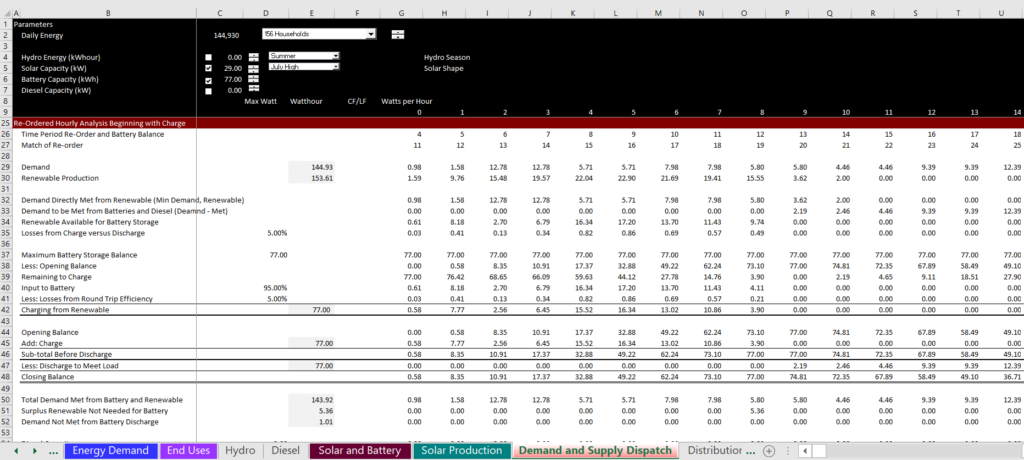
Part 5 – Supply Analysis with Batteries
Once you have developed the dispatch, you can put things together. I find it helpful to illustrate a single day so you can see what happens with demand and supply. You can choose to include different structures and then test which structure gives you the lowest cost. To do this, you can combine the variable cost of operating different units including the thermal units with the fixed and variable costs. The big deal is to have the confidence to do something like this with different kinds of uses.