This page is designed to walk you through various issues in acquisition analysis. The files that you can download walk through issues specific issues related to M&A modelling as well as valuation.
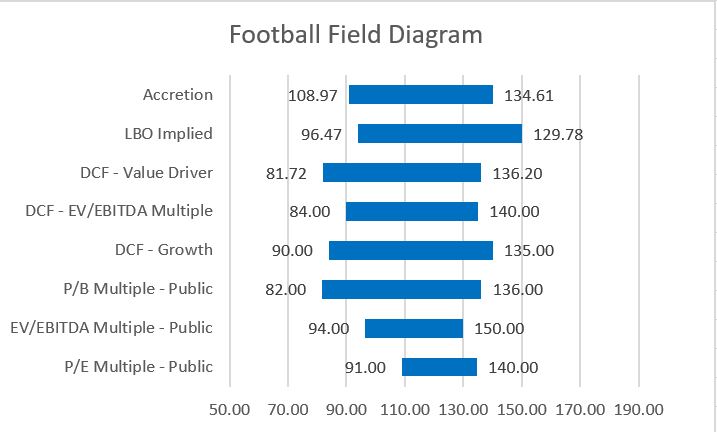
alternative approaches. Valuation methods applied in M&A include transaction and public comparables, discounted cash flow (DCF), simulated LBO value, accretion and dilution assessment, and premiums paid analysis. Understanding the subtleties, inherent problems and mechanics of the different methods that can be presented in a football field diagram (American Football) demonstrates valuation ranges of each approach.
Introduction to Alternative Valuation Methods with Football Field Diagram
M&A analysis can be introduced with a football field diagram (American Football), economics of synergies and accretion and dilution. These diagrams as illustrated below demonstrate that there are many different ways to look at valuation and for each valuation approach there is a range in value. A football field diagram and the link to see how to make a football field diagram is illustrated below:
Link to page that describes how to create football field diagrams.
I have put a set of power point slides for the acquistion modelling discussion. You can download this file below.
Acquisition Modelling Part 1 — Synergies, Premiums, Accretion, Dilution
The part of the acquisition analysis is discussion of M&A theory. This includes economics of a merger with synergies and premiums and computing accretion and dilution for a hypothetical merger between Apple and Google.
I have included this in the powerpoint slides that you can download above or you can work through the excel exercises. The excel exercises are part of the acquisition exercise file that I have included below. I have also included a file with completed examples.
The excel analysis reviews LOOKUP and INTERPOLATE functions and creating flexible graphs when working through synergies and premiums as well as accretion and dilution.
You can download the exercise file without the data filled in (you should fill in the yellow cells). Alternatively, you can downolad the file with completed formulas.
Acquistion Model Exercise File - For You to Complete
There are three videos associated with this lesson set. The first video reviews the” videowidth=600 videoheight=400 keepaspectratio=1 videocss=”position:relative;display:block;background-color:#000;overflow:hidden;max-width:100%;margin:0 auto;” playbutton=”https://edbodmer.com/wp-content/plugins/wonderplugin-video-embed/engine/playvideo-64-64-0.png”]
theory associated with acquisition analysis. The second and third videos explain how to work through the excel.
Basic
The general objective of describing M&A analysis is to work through theoretical and practical valuation analysis that is the basis of M&A analysis. M&A valuation techniques are founded on general financial methods and typically use several
Part 2: Multiple Comparables (P/E and EV/EBITDA): Overview and Differences over Time and Within an Industry
The second section discusses how to use multiples in the context of an M&A transaction. Some suggest that multiples are stable across time and similar for different companies in an industry. Review of actual multiples demonstrates that neither of these ideas are true. Multiples are evaluated for selected companies to demonstrate the things that drive multiples. High multiples at the end of 2017 and the beginning of 2018 are evaluated in the context of reduced corporate taxes. As the databases on multiples are used extensively, the added technical videos explain details of how to implement the data extraction for particular companies.
As with part 1, the points are explained in the acquisition power point slides which you can download using the above button. Also, the exercises are included in the same two files above for the acquisition exercises. In addition, this section refers to the financial database file that acquires files from the internet.
1. Financial Download Beer.xlsb
Part 3: Multiple Comparables Explained: Value Drivers from return, growth and risk to explain variation in multiples
Section three continues the discussion of multiples and demonstrates in quantitative terms the effects of return, growth and cost of capital. As with other sections, I first have a discussion of theory which uses results of technical analysis. The theory demonstrates how it is the interaction between growth and earning returns higher than the cost of capital that can drive multiples to very high levels. If there is no growth the P/E is equal to 1/k. It the return equals the cost of capital, the P/E is also equal to 1/k. You need both growth and returns above the cost of capital to achieve a really high return. Achieving a high growth over the long-term is very difficult. Achieving a return above the cost of capital without monopoly position is also one of the most difficult things a company can achieve. The discussion of value drivers and multiples also addresses the EV/EBITDA ratio and how is affected by asset lives and capital expenditures; tax rates; and working capital as well as returns, growth and cost of capital.
Comprehensive Stock Analysis Monthly.xlsm
Acquisition Modelling Exercise Completed 1.xlsm
Acquisition Analysis and Modeling.pptx
Part 4: Basic Cash Flow Modelling for Financial versus Industrial Companies with Simple Examples
Part 6: Historic Analysis: Acquiring Data; Presentation of Assumptions and Measuring Return on Investment
Part 7: Valuation from Financial Forecasts: DCF and Complex Terminal Value
Part 8: LBO Valuation and Backing into value from required IRR after a sale of the company.
Part 4: Cost of Capital: Difficulties with CAPM and use of the Relationship between ROE and P/B
The second section section introduces M&A analysis with a football field diagram (American Football), economics of synergies and accretion and dilution. There are two videos. The first is an outline of the theory and the second works through the excel analysis. The excel analysis reviews LOOKUP and INTERPOLATE
In evaluating alternative valuation approaches, the general idea of the course is to quickly review basics and move to the nuances and distortions of each valuation technique. For example, in analysing multiples, the effect of changes in prospective earned return and problems with the valuation driver formula: Earnings Multiple = (1-Return/Growth)/(Cost of Capital – Growth) is demonstrated. When discussing the DCF method valuation, issues with computing stable capital expenditures, EBITDA and working capital changes in the terminal period, assessment of projected returns and reconciling the difference between equity value and enterprise value are covered. In the case of LBO simulation, tricky issues with measuring IRR and Return on investment will be addressed. Whilst evaluating all of the analysis, the implications of high recent valuation multiples with respect to target returns will be assessed in included in the analysis. The general idea of the course is to use hands-on financial modelling techniques to prove how the various M&A valuation techniques work in practise. Financial modelling principles of efficient, transparent and structured will be used to demonstrate how the valuation analyses can produce incorrect or useless results. The idea of sophisticated financial analysis is not to use fancy (and generally useless excel techniques), but rather to see how selected functions when used in creative ways can be most effective.
M&A Models and Analysis
I have created a set of videos that work through the theory and modelling practise in the context of M&A. This is divided into ___ parts with different videos for each section. I have attached the video and exercise file for each section whereby you can complete the each exercise and then move to the next. For each section, the video describing the theory is listed first. After that, technical videos that explain the excel formulas and other technical issues are described in separate videos.