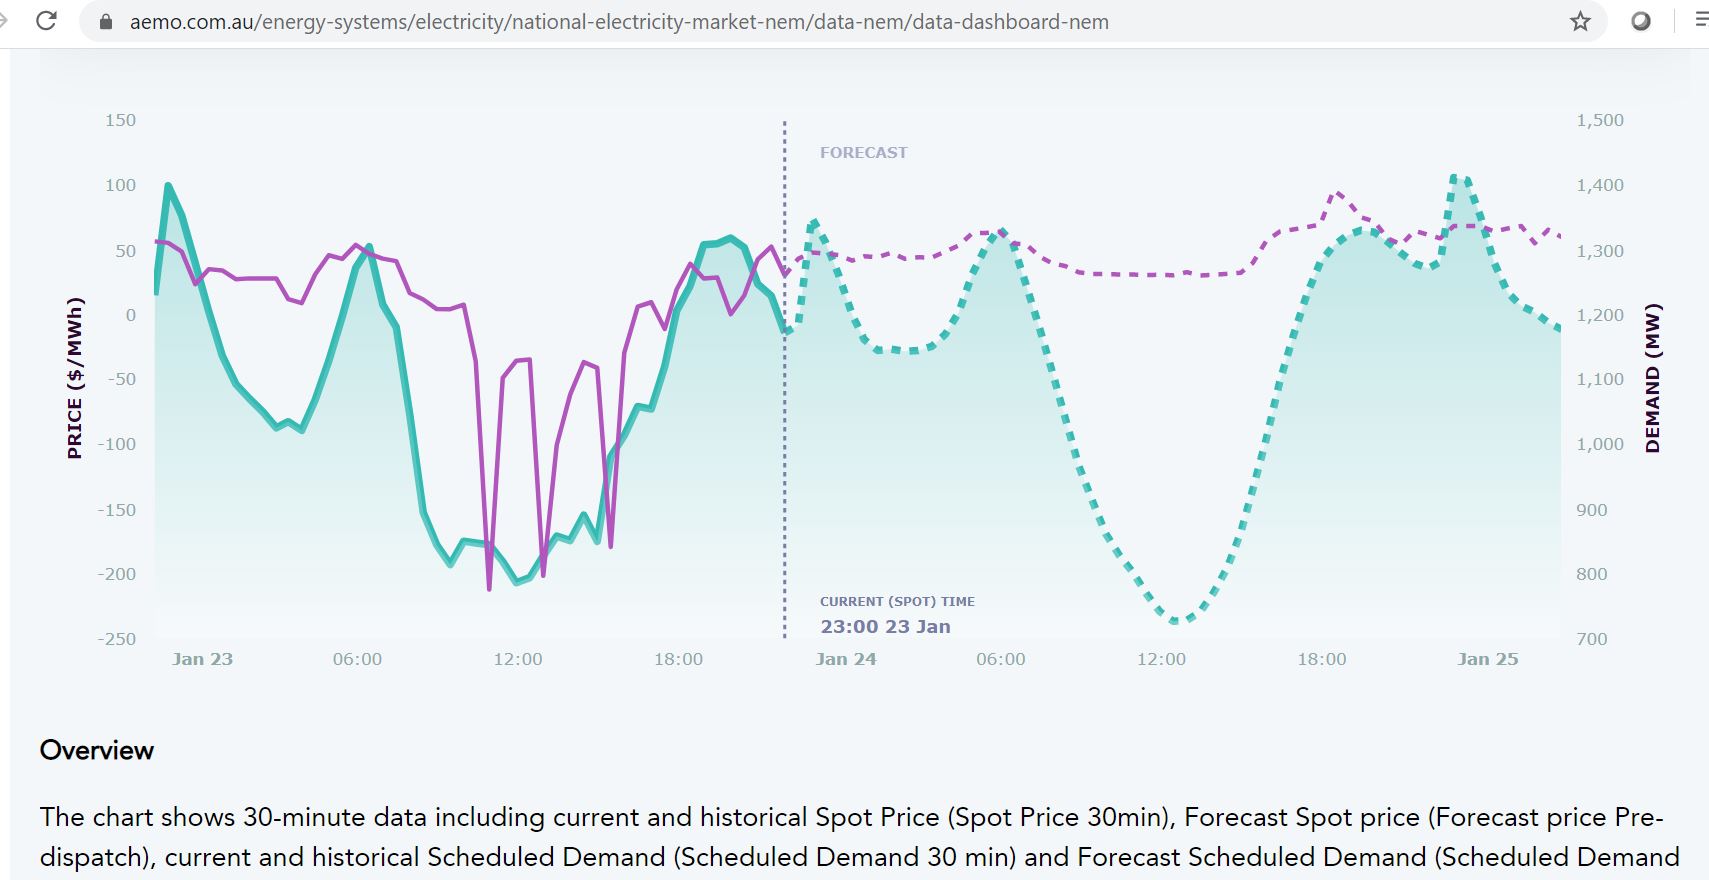
This page contains price databases and analysis for Australia Merchant Markets. The page demonstrates how you can update Australia merchant prices and illustrates various aspects of the markets. There are separate Australia merchant electricity price files for the different regions of Australia. As with other merchant markets, I present some discussion of the prices at the bottom of the page. The files for the Australia come from websites below. The set of Australia merchant power files have techniques to put the data together from separate files listed on the Australia merchant price websites. A link for the Australian market is shown below. I have not created historic databases (in part because of the difficulty in finding Australia gas prices). But if you click on the link below you can find patterns of prices that demonstrate the effect of a lot of solar power. The graphs below the links show the prices for Southern Australia.
https://www.emcsg.com/marketdata/priceinformation
.
.
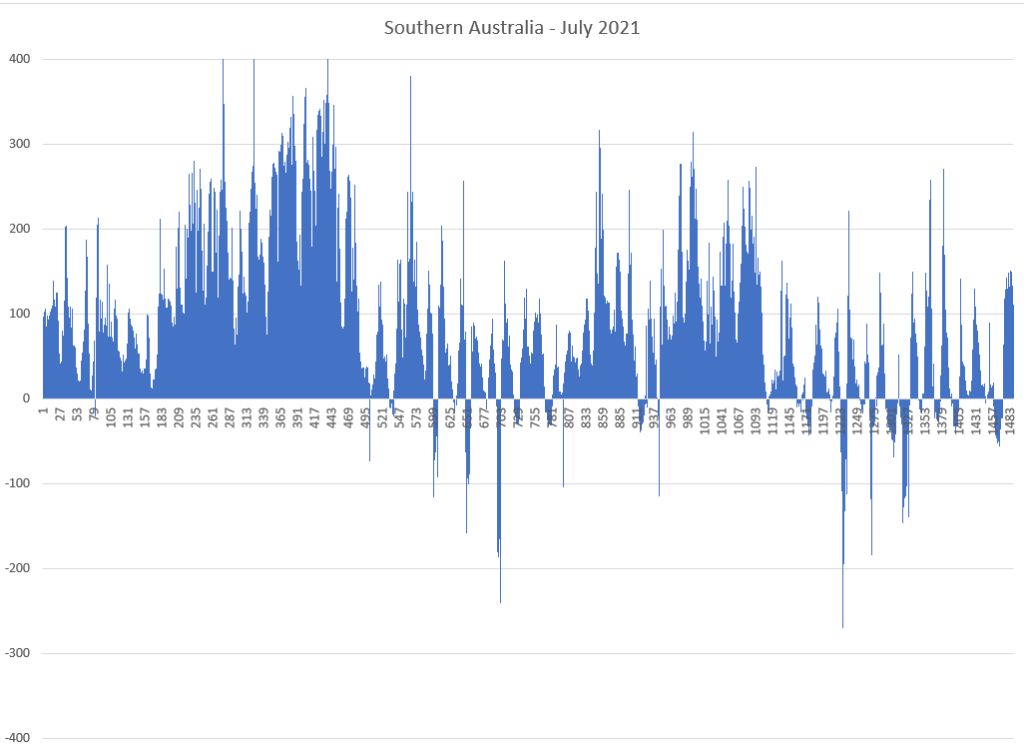
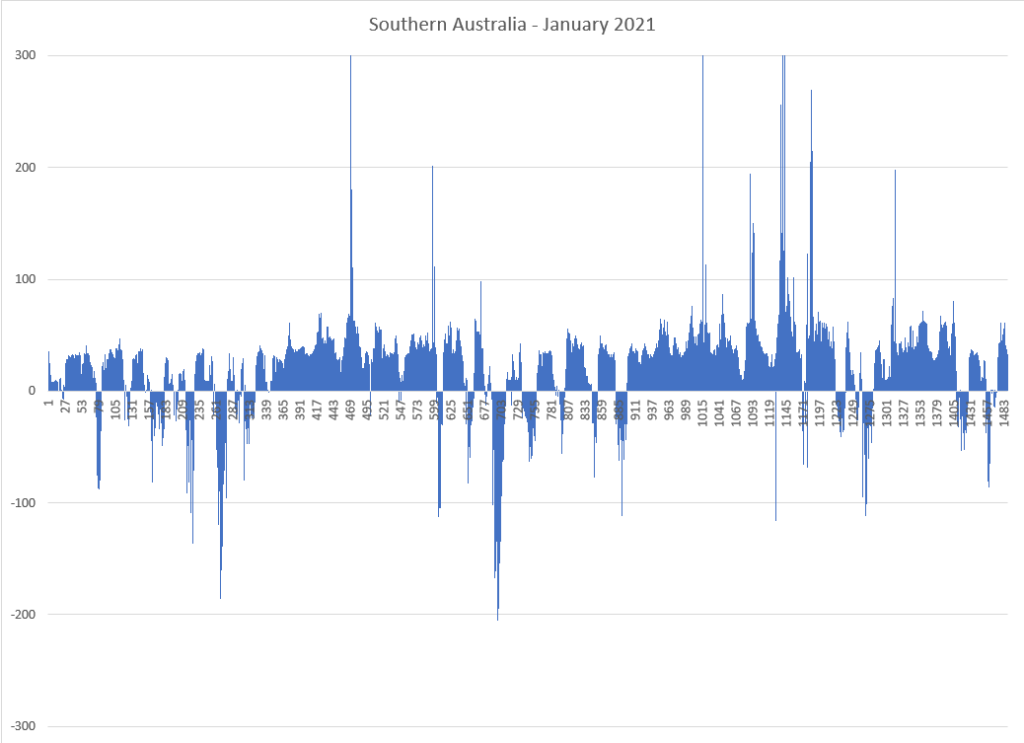
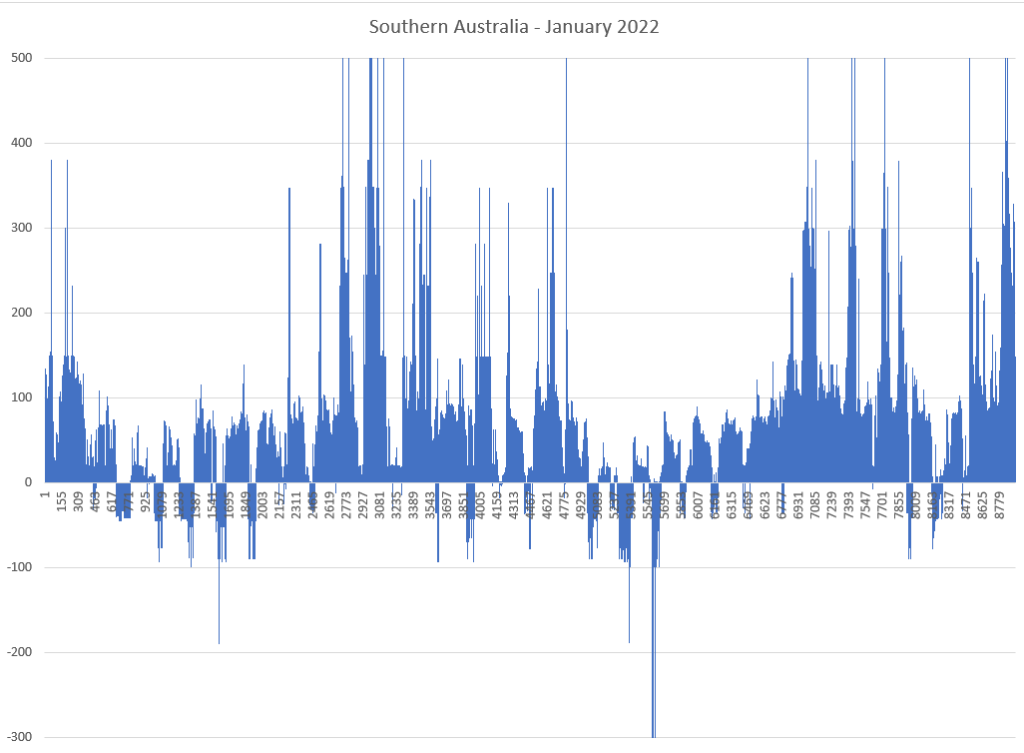
The graph below shows negative prices in Southern Australia that was coincident with high solar usage.
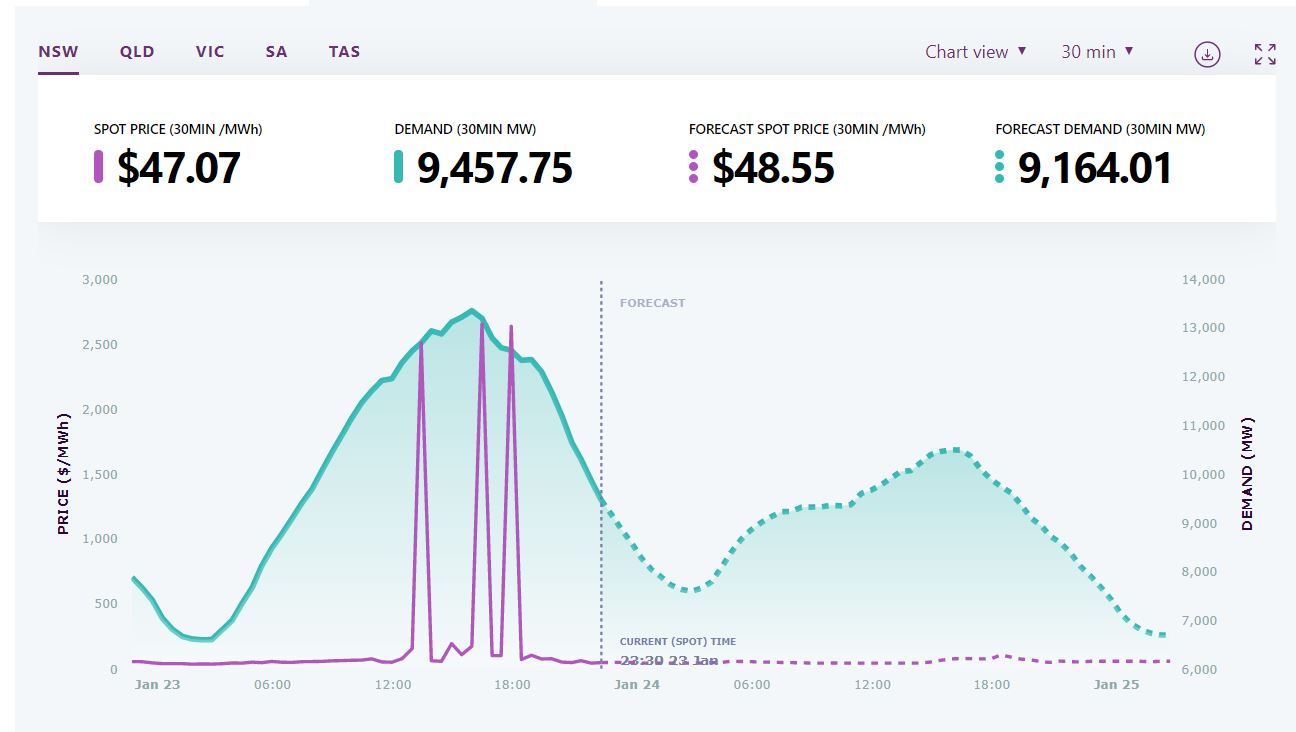
The second price shows the same day for New South Wales. In this case there is are price spikes rather than the negative prices that was the case for South Australia.
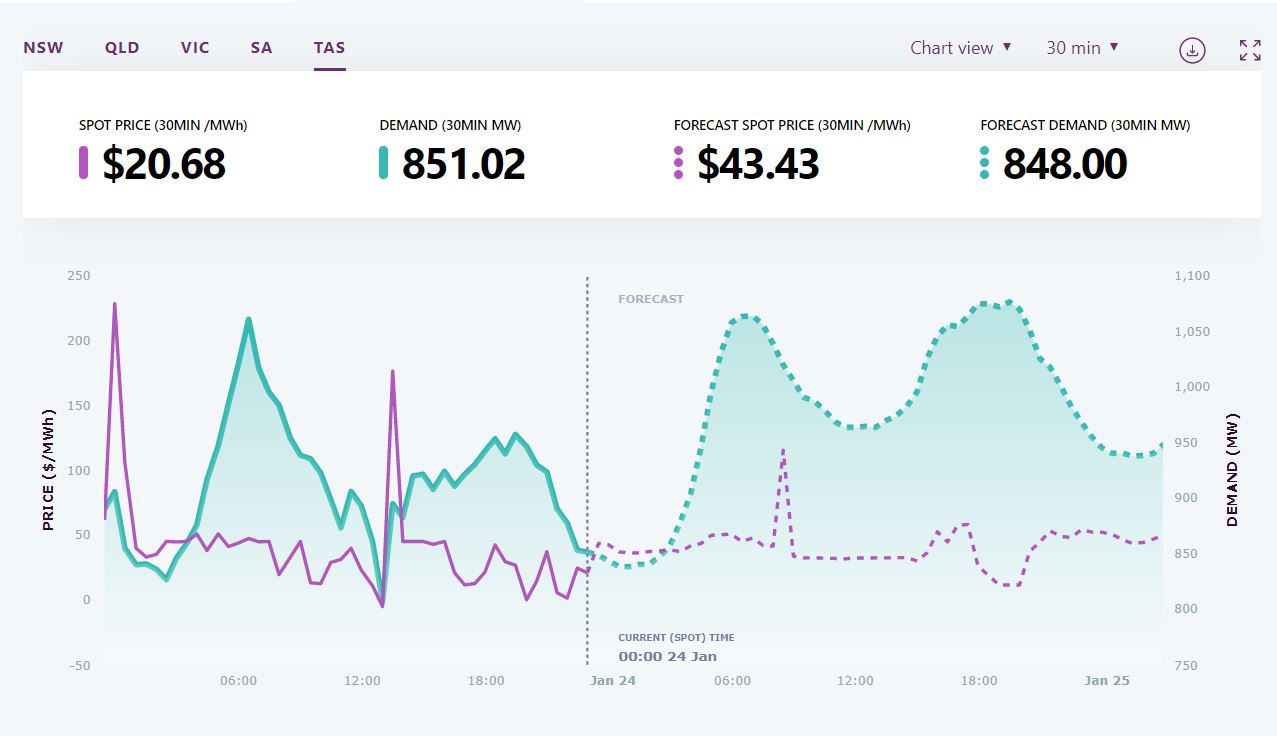
The third graph shows the same day for Tasmania. In this case you can again see prices that are close to zero and then suddenly spike.
Queensland Hourly Database.xlsx Read Source Data.xlsm New South Wales Hourly Database.xlsx Australia Internet Links.xlsx Read All Australia.xlsm
How you can Update the Australia Merchant Price Databases by Yourself
There are two websites for the Australia market that are listed below. Both the websites are transparent and provide a lot of data. You can even get hourly prices along with the demand levels for five regions of Australia — New South Wales, Southern Australia, Queensland and Victoria. It is painful to download the separate monthly files with history, but the good news is that once you have done this, you don’t have to do it again.
I have used a macro that allows you to put all files in a directory together in a single file. Then you can use the INDIRECT function to get all of the prices into a comprehensive database. The different files below demonstrate how to put the data together and evaluate the price spikes.
Lessons from Studying the History of Australia Market Prices
The Australia market can be used to illustrate the effects of solar on negative prices.
The Australia market is interesting as it has no capacity prices and allows price spikes. You can therefore use the markets in Australia to evaluate allowing price caps relative to attempting to make a separate capacity market (that requires some regulations) along with price caps on energy prices.