This web page walks through modeling of a partnership tax equity flip structure when the date for changing (flipping) partnership allocations of income and cash flow to the tax investor and the sponsor/developer are fixed. The page includes a modelling case study that demonstrates how to work through the capital accounts (outside or tax basis capital account) and the inside capital account (fair market basis or just capital account). The tricky part of the calculations is evaluation of the potential that the tax equity tax benefits are limited because of rules associated with inside and outside capital accounts (these are known as absorbtion issues). Hopefully, as I continue to work on this page I can not only explain the excel mechanics and the IRR effects of different tax, financing and operating items, but a bit on why the tax law as seemingly absurdly provisions.
I will try and explain how the IRR and the value to the tax investor is affected by the financing because of the way the allocation of debt to partners drives limits on taxable income; I will discuss how fair market value of the project relative to the pure cost affects the analysis; I will try to explain when the deficit reduction account is important to the IRR and when it is not; I will try and explain why the tax equity investor would prefer back leverage if there was no impact on tax limitations; I will try and have you think about risks of cash flows to the tax investor and the sponsor/developer; and I will try to explain the IRR and tax effects of the option of the tax investor to sell his interest to the sponsor/developer after the tax depreciation has been used.
On this page I work through how to set-up the assumptions for a solar model with tax tax equity; how to model cash flow and income at the partnership level; how to measure hypothetical tax efficient cash flows; how to compute distributions of cash flows to the partners; how to measure distribution of partnership income to the partners; how to incorporate project level debt and back leverage in the analysis; how to measure constraints on tax benefits or stranded taxes from evaluation of the outside capital account (or tax basis); and how to evaluate the cash flows and tax effects from an option for the tax investor to sell his interest to the sponsor/developer.
This sounds like a lot of stuff to cover in a page, but don’t worry because if you carefully structure your model it is not so bad. In order to keep the analysis manageable, I have illustrated the modeling process with a simple annual model. Extension of the model to a case with monthly/quarterly cash flows, bridge loans, ITC timing and other issues is (will be) presented on the other webpage below. Similarly, a yield flip which transfers does not have a fixed date for the flip and is more common in wind is included in yet another page. By working through the annual model in a structured way, you should come to the conclusion that this stuff is not so hard and that all of those over paid consultants ad lawyers are just trying to make things confusing to keep their fees very high.
Time-Based Flip and Yield Based Flip
As with other pages, you can follow along the process by working through the snapshots associated with the excel file that is available for download below. Alternatively you can watch the videos and, if you are still awake, you can then tinker with the file. The fixed flip date is more common for projects with a lot of ITC. Here the tax equity investor earns such a high return especially on small transactions that a yield based flip would work too fast. The flip works until the accelerated depreciation is finished and there is no reason for the tax investor to be in the transaction (the safe harbor tax rules require that the tax investor remains for 6.5 years). This first page introduces modelling of outside capital and inside capital. I have computed both the inside capital account (704(a)) and the outside capital account, called the tax basis. The inside capital is only computed first to evaluate the potential for re-allocation of income (the tax investor does not want to be allocated positive income). After the inside basis is computed, the outside capital account is computed to make the dividend test and the suspended loss test. The file and the videos are just below this paragraph.
.
.
Why Partnerships Have Such Complicated Tax Structures and Bare Transfer of Tax Benefits
Everything starts with the idea that the developer cannot use all of the tax benefits including the ITC. (The tax depreciaiton is harder to get because of absorbtion issues). Absorbtionissues mean that the tax equity partner cannot realize the accelerated depreciation tax benefits.
When I began working on tax equity I wondered why there were such complex tax structures that included income re-allocations; limits on use of taxable income when dividends exceed investment; suspended loss calculations and deficit reduction obligations. To see why these complexities arise think about a big tax deduction you may have. If you are in a low tax bracket (like me) then the value of this tax deduction is not as it is for a really wealthy person or company who has a tax bracket. You could then create a partnership between the person with the low tax bracket and the company with the high tax bracket. In the partnership you could give the rich company all of the tax benefits and let him make an investment that gives him a good return on these tax benefits. You could structure a partnership that makes you both better off. Your wealth would go up, the rich corporation’s wealth would go up and the government who collects tax would be sad.
A tax equity partnership for a really difficult teenager
You could be a little extreme and imagine taking a deduction for a child. Maybe you could create a partnership (maybe a marriage or maybe not) and allocate the tax benefits of the deduction to the partner with the higher tax rate. Maybe your tax rate is 15% and the billionaire has a tax bracket of 40%. If the child deduction is worth 5,000 per year, the value of the child is 15% x 5000 or 750 to you and the value of the child is 5,000 x 40% 2,000 to the billionaire. In your partnership, the billionaire would pay you 1,500 and get the deduction. You could structure this through a partnership where the only thing the rich billionaire does is to use the tax deduction for your child.
I made this example to illustrate why the tax rules are complex. The tax authority would not want a structure like this because the billionaires would start collecting a lot of children. But the tax authorities cannot prevent people from making partnerships (marriages maybe). So the IRS in the U.S. makes a lot of rules to make sure that a tax investor is not just a transfer of tax benefits. The IRS tries to make rules that assure the tax investor has real risk in the project. The IRS also has rules to make sure that the tax investor has real investment in the project. If the tax investor takes more in dividends than the investment that has been made, the dividend is considered to be like an asset sale and be taxable. It the equity balance of the tax investor goes below zero, the tax investor is assumed to not have a real investment in the project and he cannot deduct the income that makes the investment fall below zero.
Transaction Structure that is Safe in Terms of Qualifying for Being an At Risk Partnership
In renewable energy, what is considered to taking risk in the project (the billionaire has to take risks and experience the pain of raising teenagers) is defined by something known as a safe harbour. In the case of tax equity, the safe harbour protects you from being defined as a sham transaction that is only for transferring tax benefits and it is not a true partnership where both parties have money at risk. To assure that your partnership does not bring an IRS storm, the tax investor must do things like only take 99% of the ITC and taxable income; the tax investor must have 5% of the cash of the partnership; the partnership must not have a set in stone provision to sell from one partner to another; the tax investor must stay in the transaction until after the depreciation is finished and other provisions.
.

.
The tax equity investor in a fixed-flip transaction usually receives annual preferred cash distributions—ahead of any other distributions—equal to 2% of its tax equity investment. Almost all the remaining cash is retained by the solar company.
Tax Investor Yield Requirement to Demonstrate At Risk Investment
Investors want at least a 2% pre-tax yield, but treat the tax credits as equivalent to cash for purposes of these calculations.
Videos Describing Tax Equity
The videos below walk through a solar tax equity model. The videos include working through (1) the partnership cash flows; (2) financing of the partnership; (3) allocating income and cash flow of the partnership; (4) evaluating constraints on the tax investor to compute the after tax IRR; and, (5) computing the IRR to the developer/sponsor. The videos on operating cash flow, financing the partnership and distributing the income and cash flow are included on this page. Subsequent pages address constraints on measuring income from the measuring the inside basis and the outside basis.
[wonderplugin_video iframe=”https://youtu.be/9z-oJH2u7JU” videowidth=600 videoheight=400 keepaspectratio=1 videocss=”position:relative;display:block;background-color:#000;overflow:hidden;max-width:100%;margin:0 auto;” playbutton=”https://edbodmer.com/wp-content/plugins/wonderplugin-video-embed/engine/playvideo-64-64-0.png”]
[wonderplugin_video iframe=”https://youtu.be/CMT5FwcWdRo” videowidth=600 videoheight=400 keepaspectratio=1 videocss=”position:relative;display:block;background-color:#000;overflow:hidden;max-width:100%;margin:0 auto;” playbutton=”https://edbodmer.com/wp-content/plugins/wonderplugin-video-embed/engine/playvideo-64-64-0.png”]
.
Overview of Partnership Structure and the Model
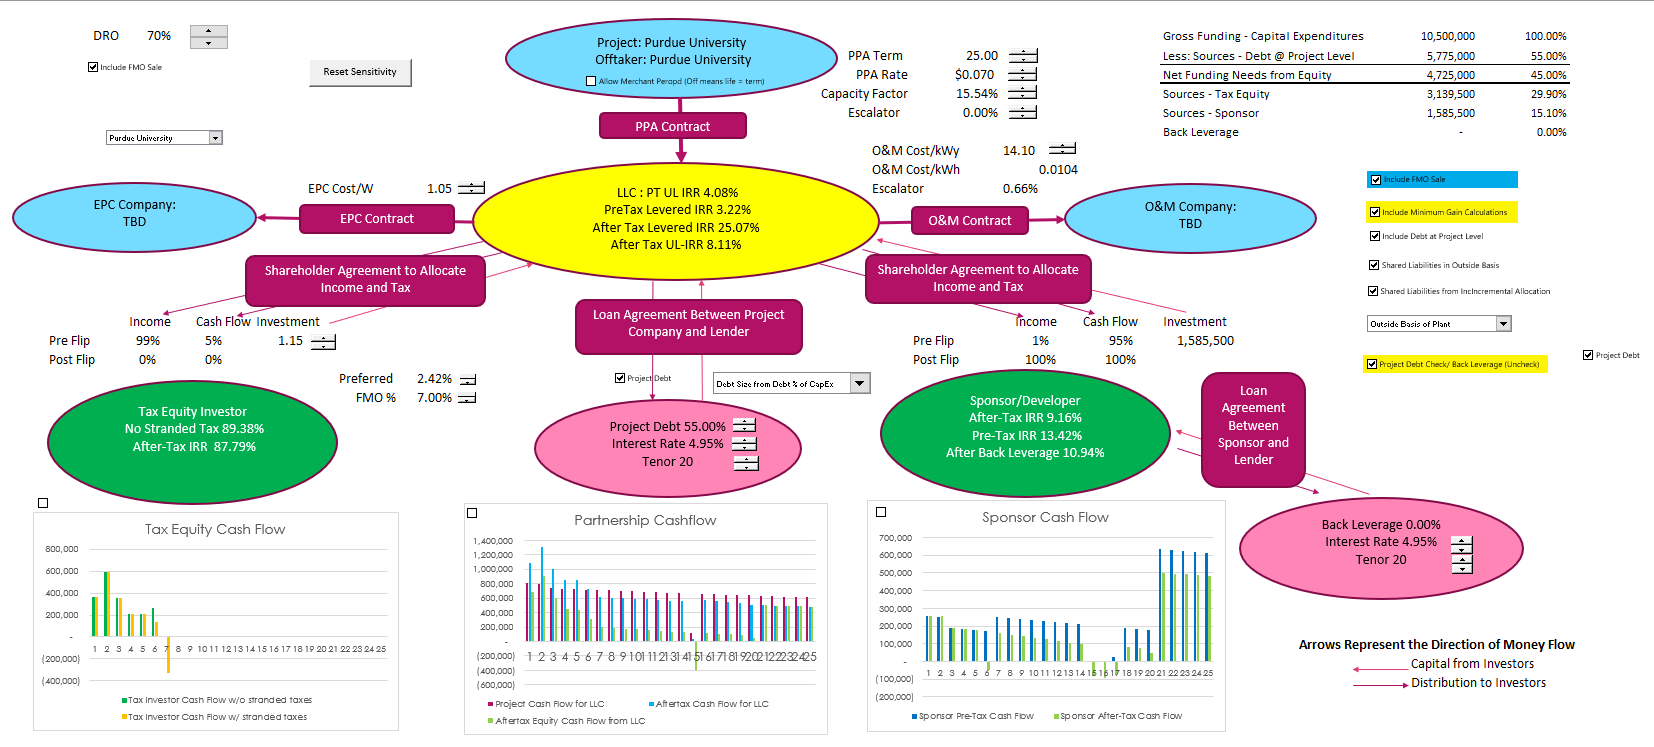
To illustrate how the model works and how tax equity structures work, I have put together a project diagram as part of the model. With spinner boxes, you can put sensitivity factors in the diagram and evaluate what happens when the operating income changes and how this translates to the returns of the the different equity investors (the tax investor and the sponsor/developer). More important, you can try different structures with alternative tax investor contributions and different debt structures. The yellow bubble in the investment shows the overall IRR’s to the partnership and includes the IRR that would be earned if all of the tax benefits could be used by the partnership.
In the diagram shown on the below I have also illustrated how the debt can be at the project level or after the sponsor cash flow. If the debt is paid from the dividends of the developer/sponsor it is called back leverage as the debt is repaid from the sponsor cash flows. It is difficult to see the little spinner boxes next to the capital investment and the Investment as well as a couple of check boxes. You can use these spinner boxes to illustrate what happens to all of the investors when you change both the operating assumptions and the structuring assumptions. The key numbers to look at are the IRR’s presented in the green boxes. Cash flow diagrams are illustrated below the diagram. To see some of the details in creating this kind of diagram, go to the scenario page of this website.
.
.
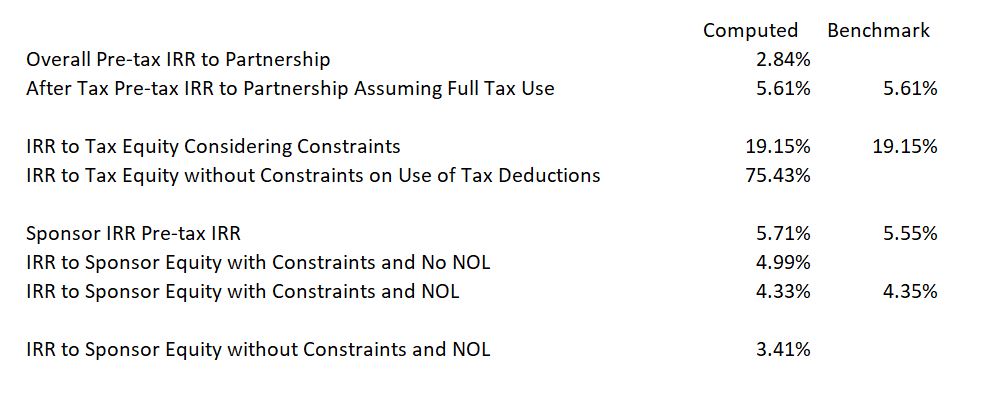
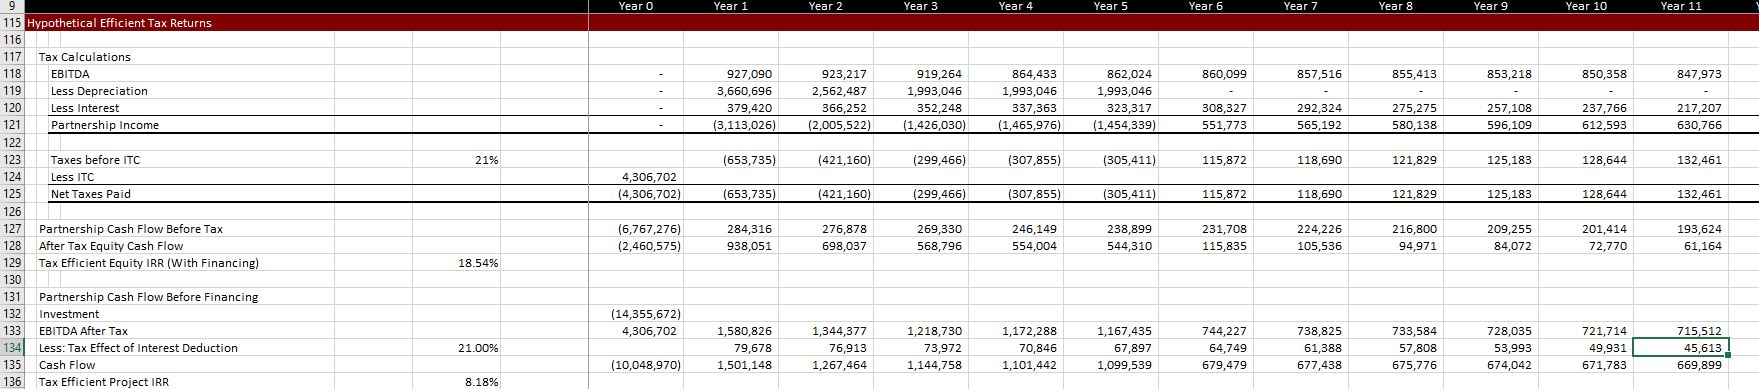
The various IRR’s which are the key statistics for investors are shown on the table below. There are many different IRR’s which are computed using cash flows that have alternative tax constraints. Please note that this is for a small transaction example. Larger transactions have tax investor returns (after-tax) that are in the neighborhood of 7%.
.
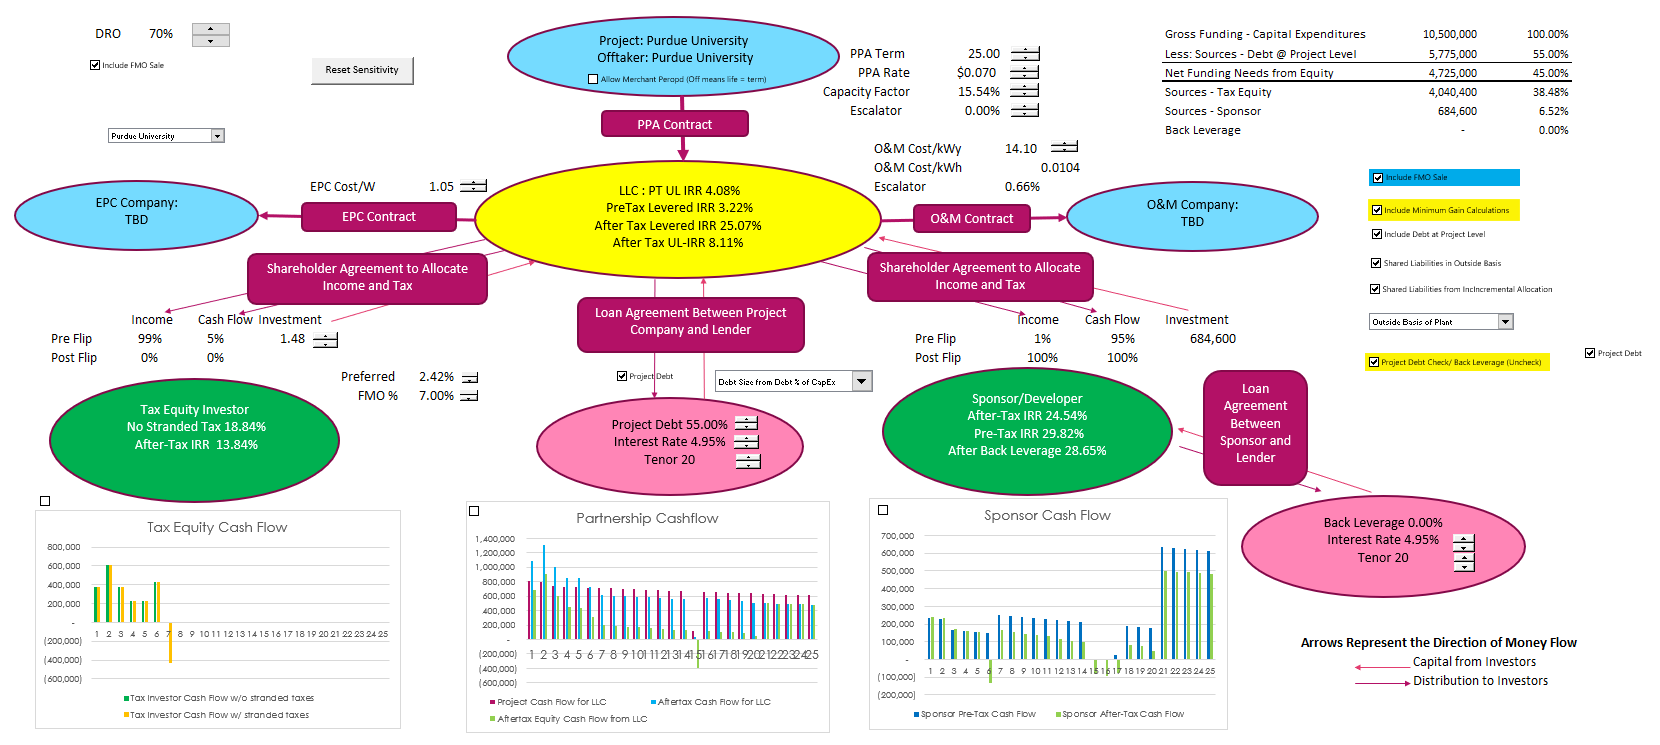
The second screenshot illustrates that same diagram with a different assumption for the investment put into the company by the tax investor. This investment is often expressed as a contribution ratio which is the investment divided by the amount of the ITC. Notice that the distributions of cash flow and income are shown on the diagram. Note also that the diagram shows the various contracts in the blue boxes. I suggest to use this kind of diagram in any project financing transaction. If you can connect it to the project finance model, all the better. In the project finance model, the yellow partnership is modeled first. Then the model evaluates project debt which is the middle pink egg. The model evaluates the partnership distributions after the yellow middle partnership is evaluated. Note that the output of each of the ovals is the IRR which presented in each. This is because I am emphasizing these days, that the IRR is all that matters.
.
.
Preliminary Discussion of Tax Investor IRR and ROI with Model Presentation from Seminar
I am going crazy these days in my old age thinking about IRR and resenting that fact that my investments (including this website, which is difficult to monetize) have such a poor IRR. Before working through all of the details, I am showing you an example that one of my friends who paid a lot of money to go to conferences where they do not give out models and where they do not give you the complete important details. Computing and ROI in an incorrect manner, just ends up showing and understated return to hide just how much money the tax equity investors are making. So, I am going through a little output from a conference that did not show the equity IRR. In the sentences below, I will complain about this a lot.
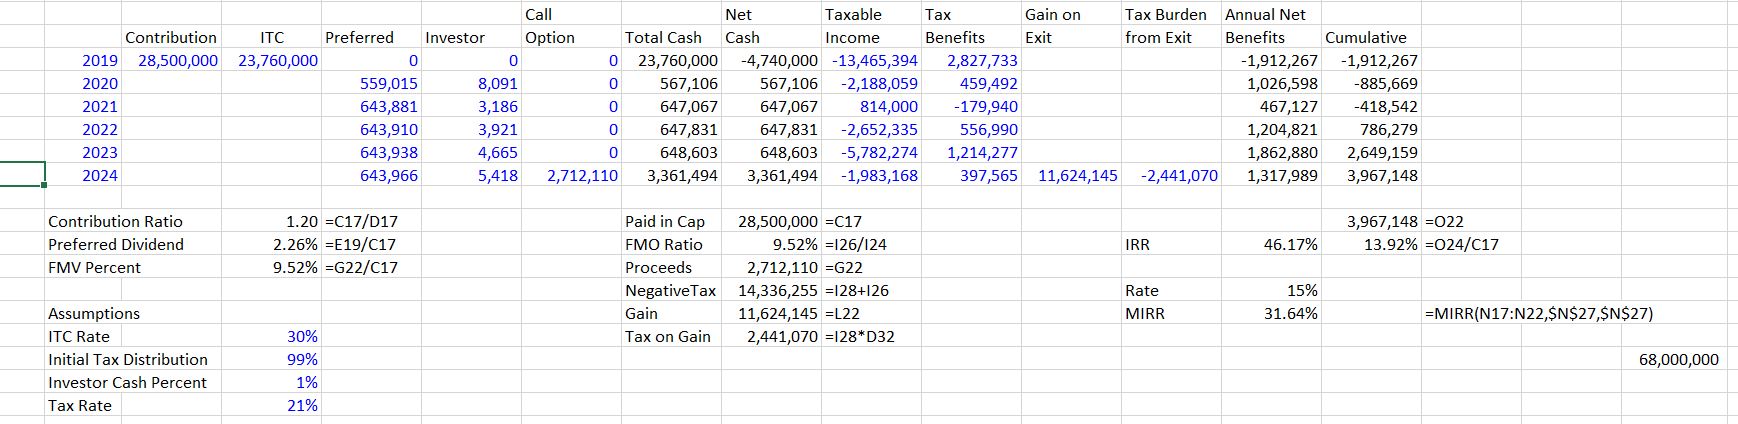
Tax Investor Cash Flows
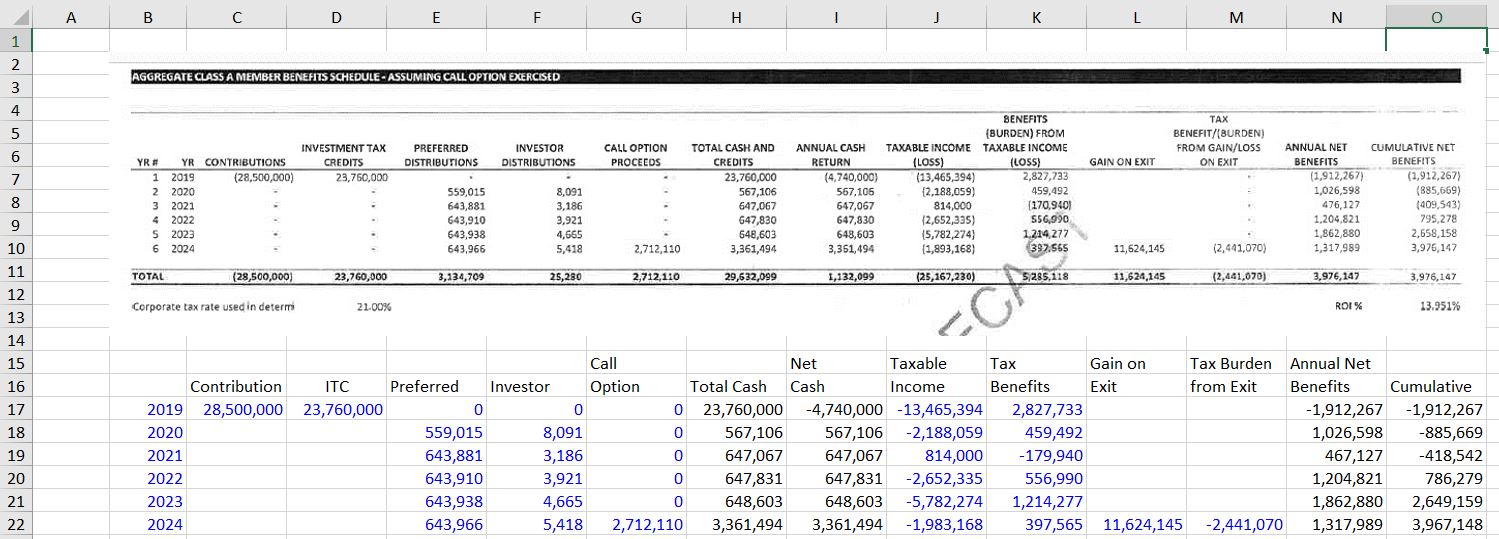
The excerpt below demonstrates the analysis of the tax investor presented in the conference. The key column in the excerpt below is the final cash flow and the annual tax benefits shown in column N. Note that there is a very big gain on the exit and that you can compute the contribution ratio from the ITC and the equity investment. The contribution ratio in the example is 1.2 which is the contribution of 28.5 million divided by the ITC of 23.76. This means that the tax investor only really invested 20% more than the ITC. The ROI shown at the bottom of the page has absolutely no financial meaning whatsoever and is discussed with the second screenshot. Note that in the screenshot below I have re-typed the data into excel.
.
.
In the second screenshot, I work through some of the key statistics and compute the all important IRR that is may be a flawed statistic, but is the probably the best measure of tax investor wealth created by the transaction. I show the computation for the tax investor in the screenshot below this paragraph. Note that the IRR for the tax equity investor is a whopping 46%. This is more than the amount that you would have earned if you would have been lucky enough to invest in Amazon shares (Jeff Bezos is the richest man in the world from being able to achieve a 37% IRR). The ROI on the other hand is a stupid statistic that assumes after you earn massive amounts of money from you tax equity investment, you would let the money sit there and you would not try to find other similar investments. It is obviously an attempt to hide just how much investors are really earning. If you can get an investment with a 46% IRR as shown in this example from the conference, you would certainly look for more investments like this.
.
.
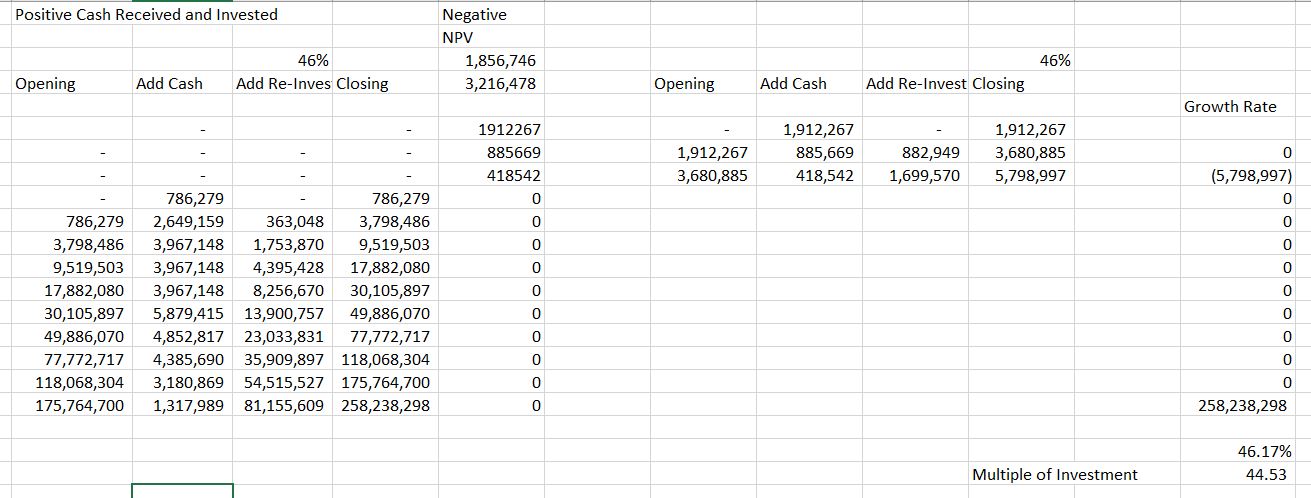
Meaning of 46% IRR to Tax Investor in the Above Example and Equity IRR versus ROI
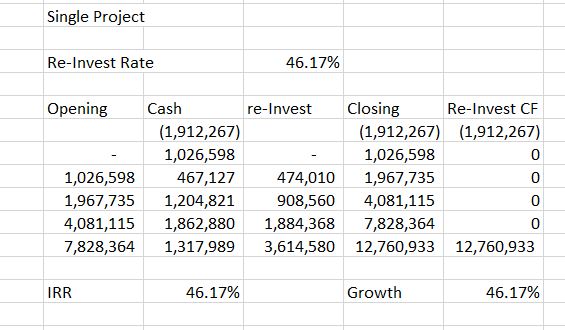
To understand what a 46% IRR really means, lets assume that you can live in a crappy little apartment like I do and you can wait for the 6 year flip date. Let’s also assume that if you get some money you will re-invest the money in similar tax investments and then take your money out in year 6 when you are finished with working and want to relax in Greece or Ostrava. Then, you can take your 1.91 million investment and come up with 12.7 million. This is shown in the screenshot below. Please don’t blabber on about not being able to find other investments like the one that earns 46%. This is precisely what investors in tax equity do. They look for other solar projects and use the same structure. The way the table works below is just like any debt issue where you capitalize interest to the closing balance. When you re-invest the money, you end up with the 12.7 million from your 1.9 million investment. This is the only number that matters.
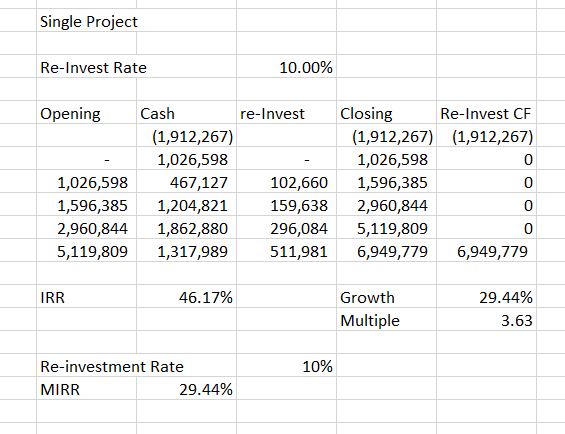
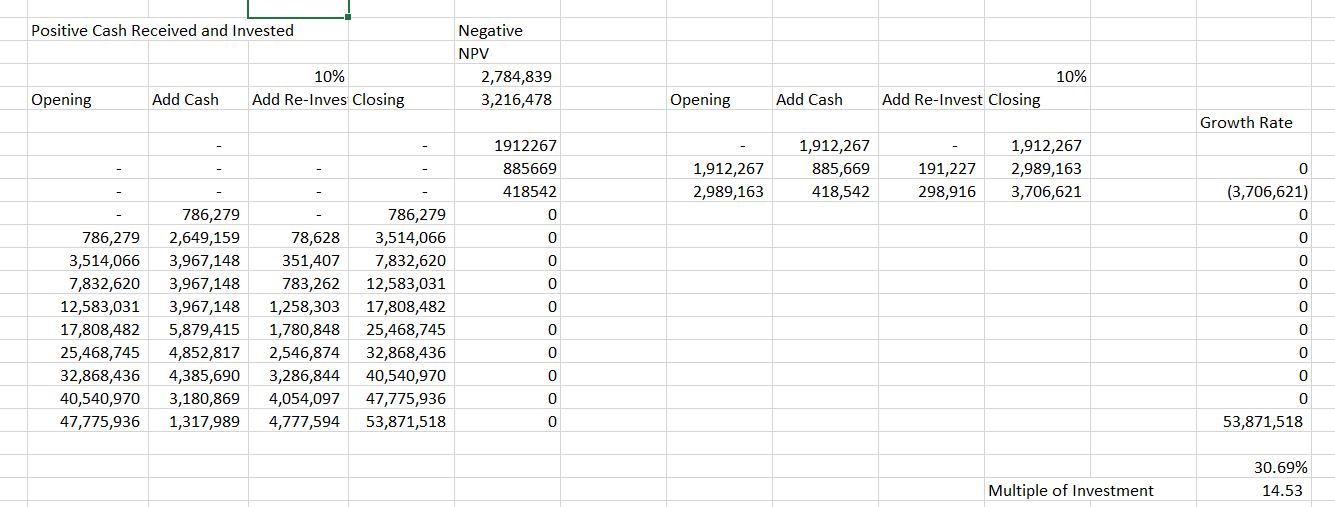
The next screenshot illustrates what happens if you use the MIRR where the IRR’s just converge to the re-investment rate assumption, like the stupid ROI computation converges to zero. Indeed if you make a long-term analysis with the MIRR and a zero re-investment assumption, the IRR will be close to zero. In the screenshot, I assume a poor tax investor will only be able to earn 10%. Here, the sad tax equity investor who cannot find the 46% returns, will have to accept 6.95 million in return for his investment of 1.9 million. Not bad at all I think.
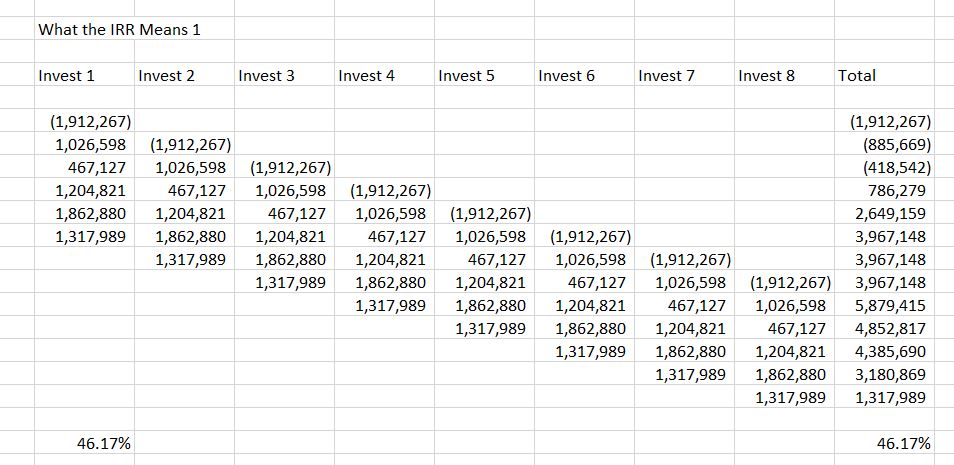
In the next example, I assume that you do invest your tax equity investment in similar projects. Note that the IRR for the portfolio is the same as the IRR for an individual investment. It is supposed to illustrate the simple idea that you can take your money and re-invest it. In the early years if you wanted this to balance exactly, you could borrow money from another tax investor and pay him 46%. Then if you have extra money, you could loan it to another tax investor who wants to get into the business and charge him an interest rate of 46% because this is your opportunity cost.
.
.
The screenshot below creates the same kind of investment balance with multiple investments. You can say this is a little like corporate finance. Note that after you pay off your loan at 46% you will have to lay out 5.7 million. But then when you earn your money back you will earn an incredible 258 million of 44.53 times your investment. I hope you are starting to see what a return of 46% really means.
.
.
The last screenshot that illustrates why your objective in a model is to compute the IRR, repeats the re-investment assumption of 10%. In this case you only have to lay out 3.7 million and in return for this, after waiting, you get $53.8 million.
.
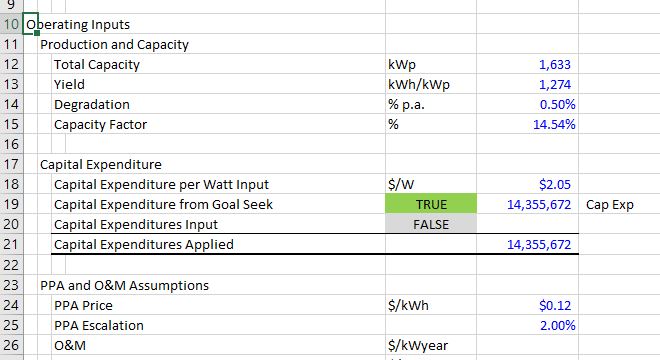
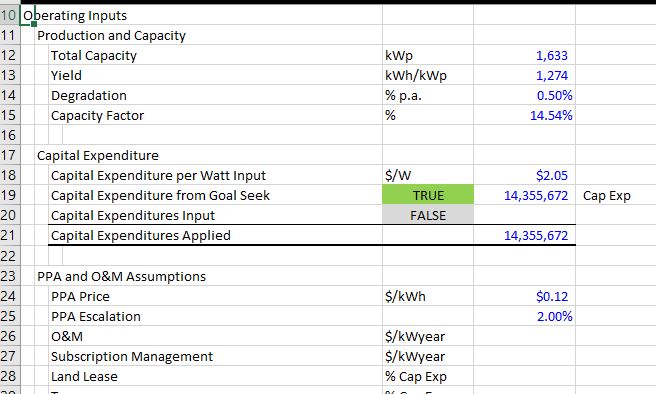
Setting Up the Inputs to Your Model
When discussing tax equity modelling I initially tried to reverse engineer a financial model. I tried to understand all of the equations without understanding any of the ideas behind these equations. But it is helpful to look at the structure of the models to make sure and understand the rules. This section works through typical inputs that should be in your model that will ultimately evaluate the returns. The first part is just the operating inputs to establish the pre-tax unlevered IRR.
.
.
.
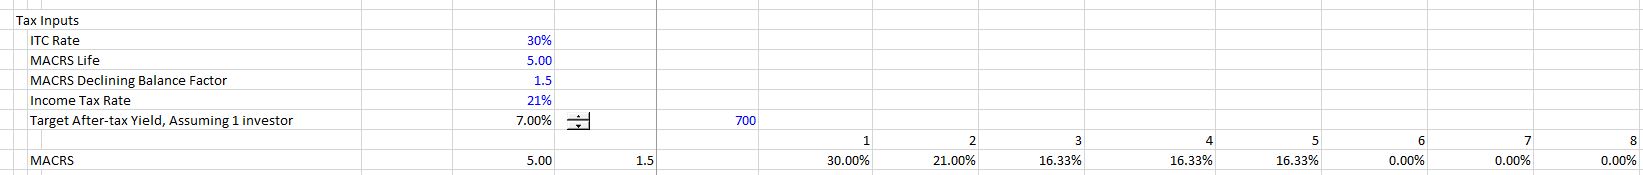
Once the operating inputs are established, you can enter the tax inputs. I now suggest that these inputs should be entered in a separate sheet. These inputs include the MACRS (modified accelerated cost recovery system) percentages ad well as the basis reductions and the fair market value of the asset. Tax inputs are illustrated in the screenshot below.
.
.
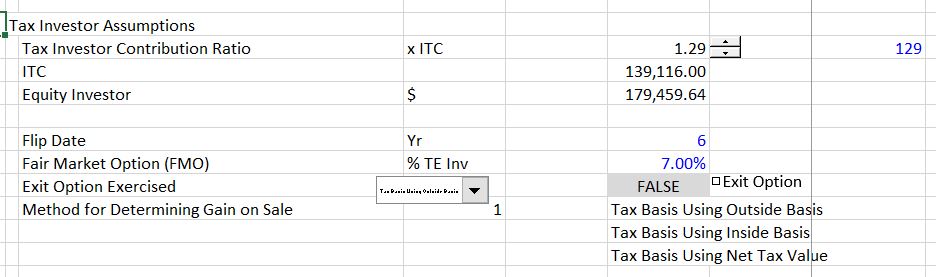
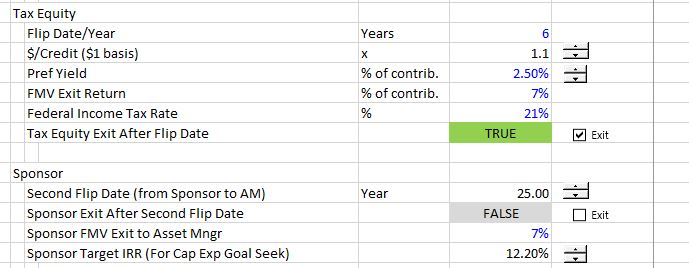
The next set of inputs that should be structured separately and not mixed up with the tax inputs are the partnership inputs. An example of these inputs are shown below.
.
Distribution Assumptions
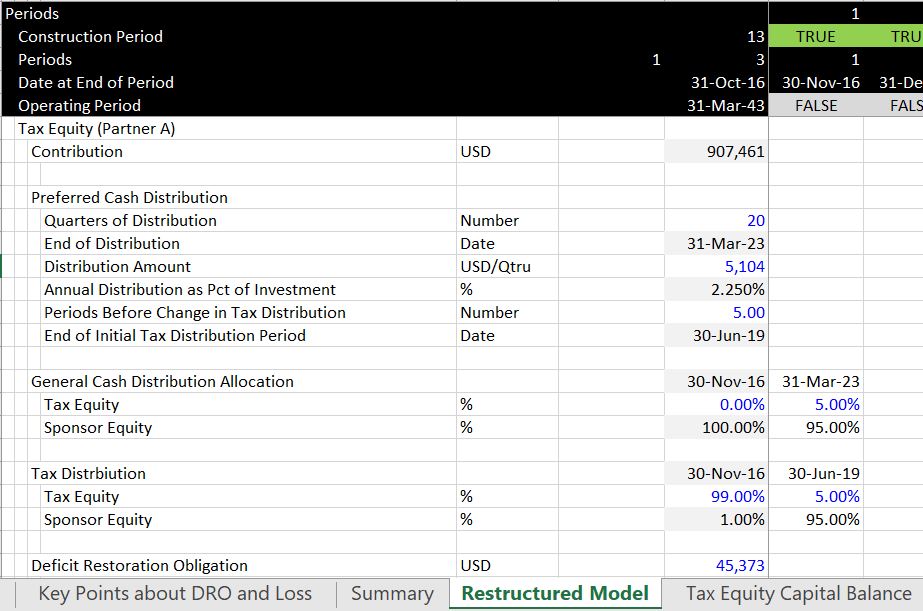
I have put some alternative examples of distribution assumptions in the case of a solar analysis below. Note that the first example only has preferred distributions. There has to be some kind of non-tax distribution for the partnership to be considered to have a construction economic interest.
.
.
.
.
.
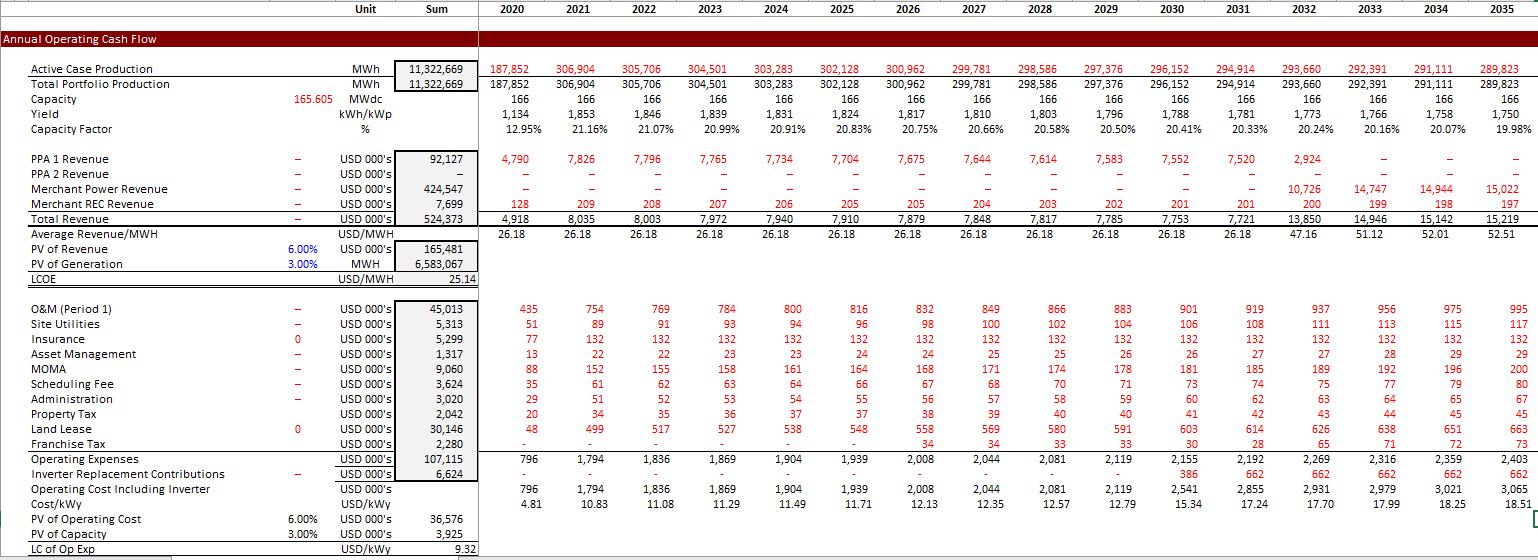
Step 1: Partnership Cash Flow and Pre-tax Project IRR and Equity IRR
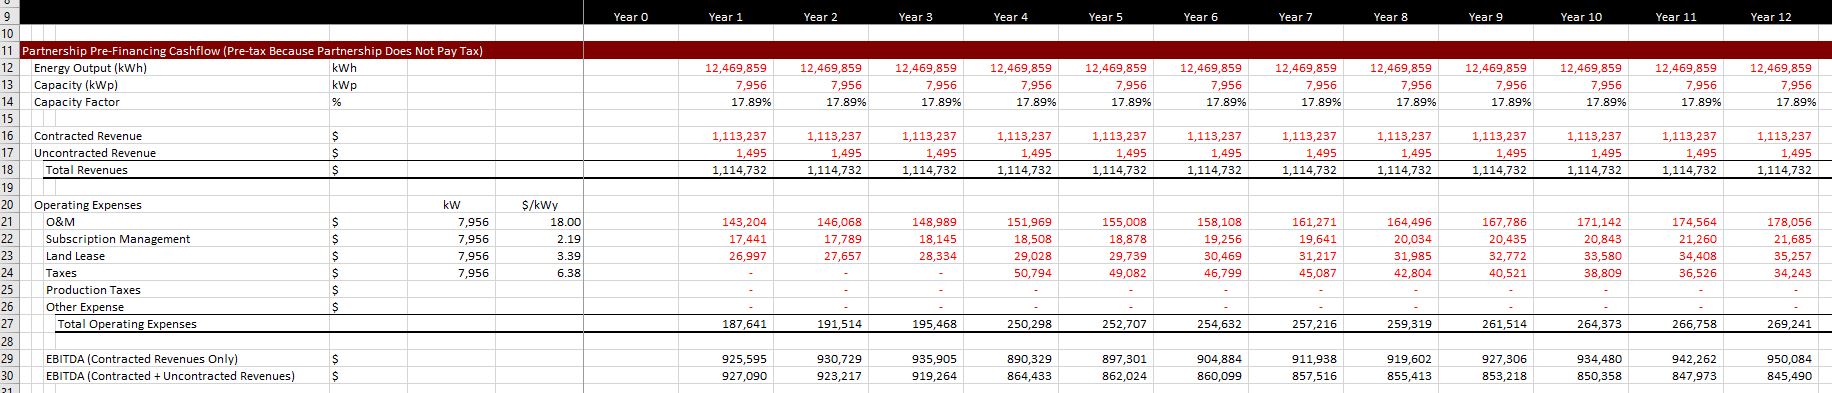
You should start the model with a definition of the partnership cash flow. As the partnership does not pay taxes, this is something like EBITDA. It can of course be complicated with different hedge and merchant income, but for purposes of this page, I use some simple examples. It should include the debt service at the partnership level. The screenshot below illustrates the starting point modelling.
.
.
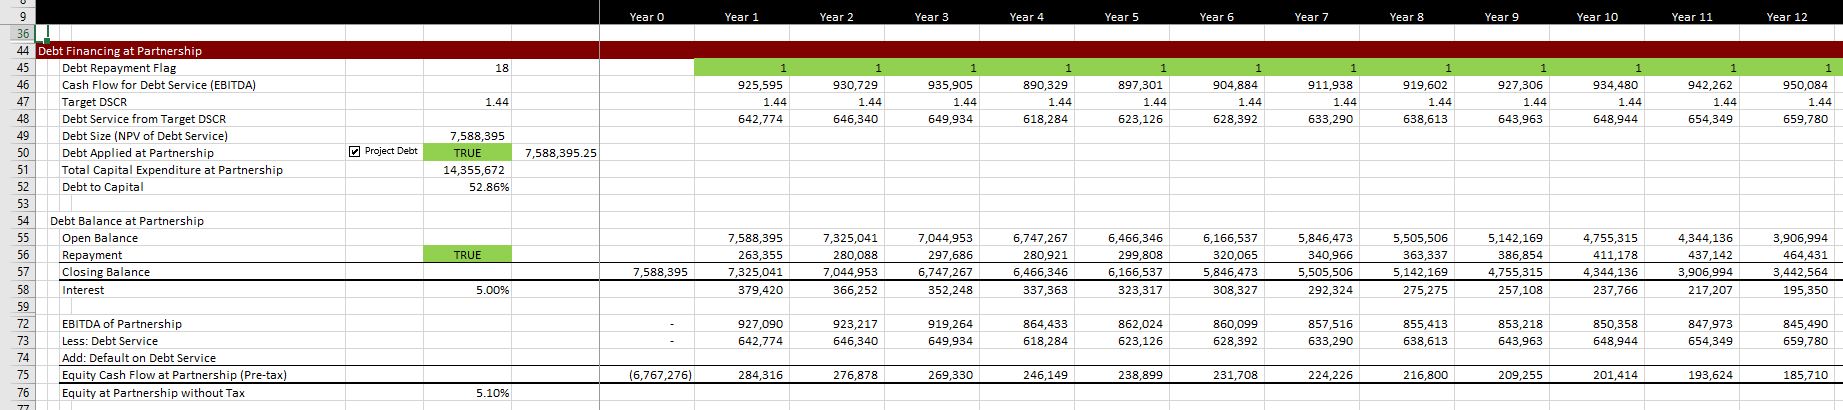
The next screenshot shows the set-up of project debt.
.
.
.
.
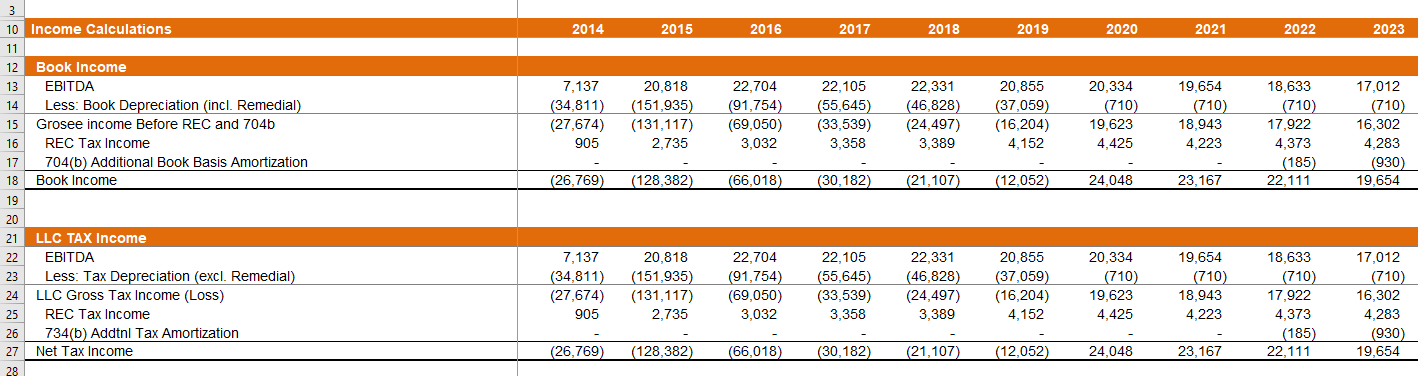
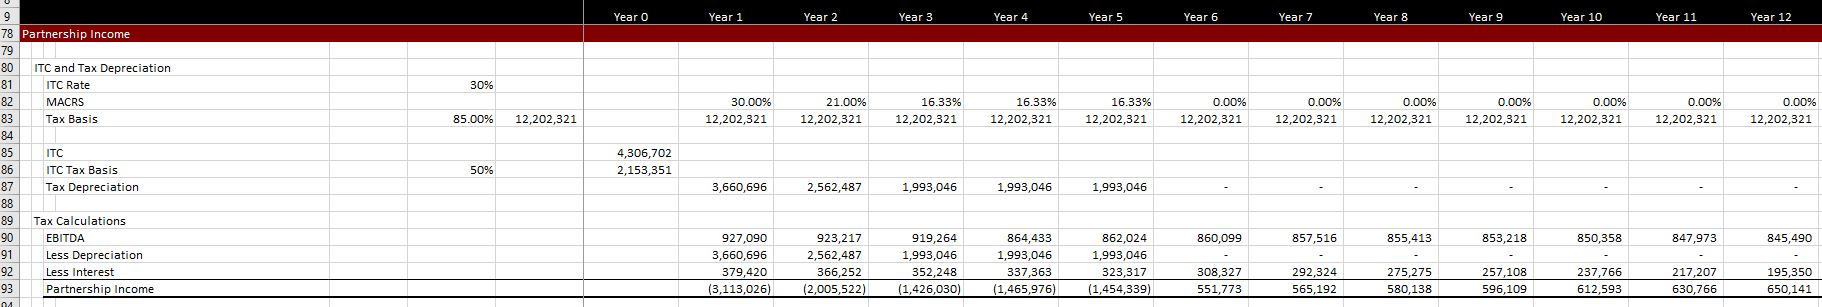
Step 2: Partnership Income with Accelerated Depreciation
.
.
.
.
.
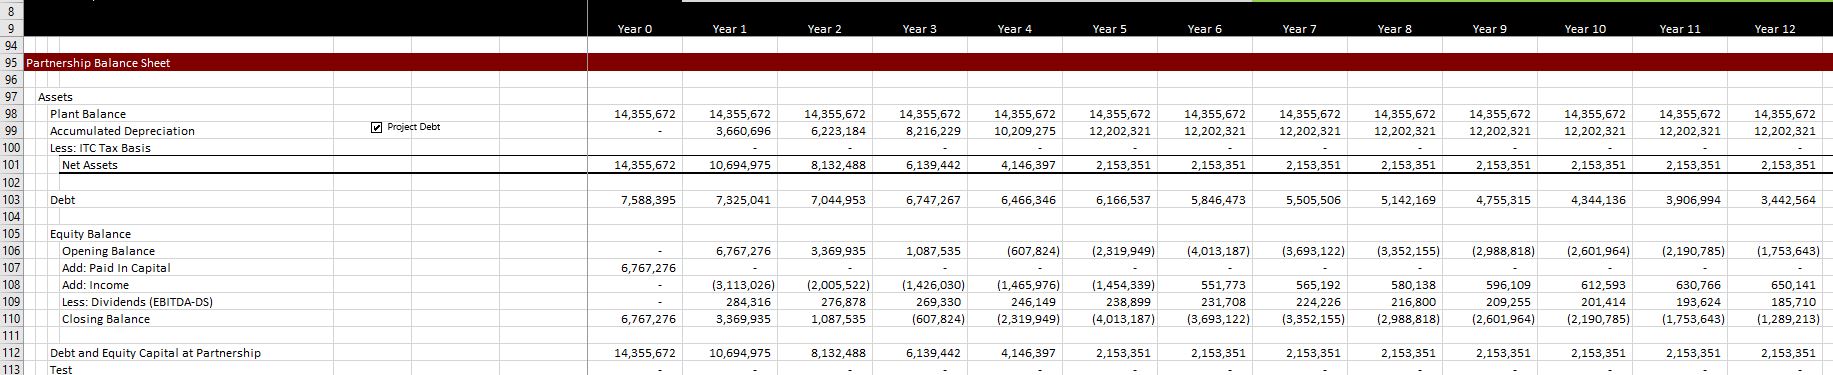
Now you can compute a balance sheet.

.
.
.
Step 3: After-tax Cash Hypothetical Cash Flow and Tax Efficient IRR
.
.
.
.
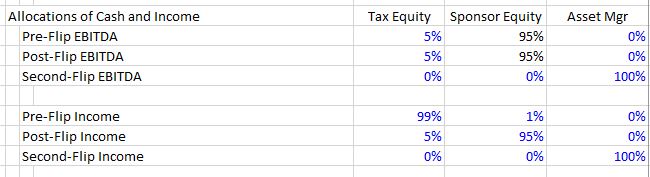
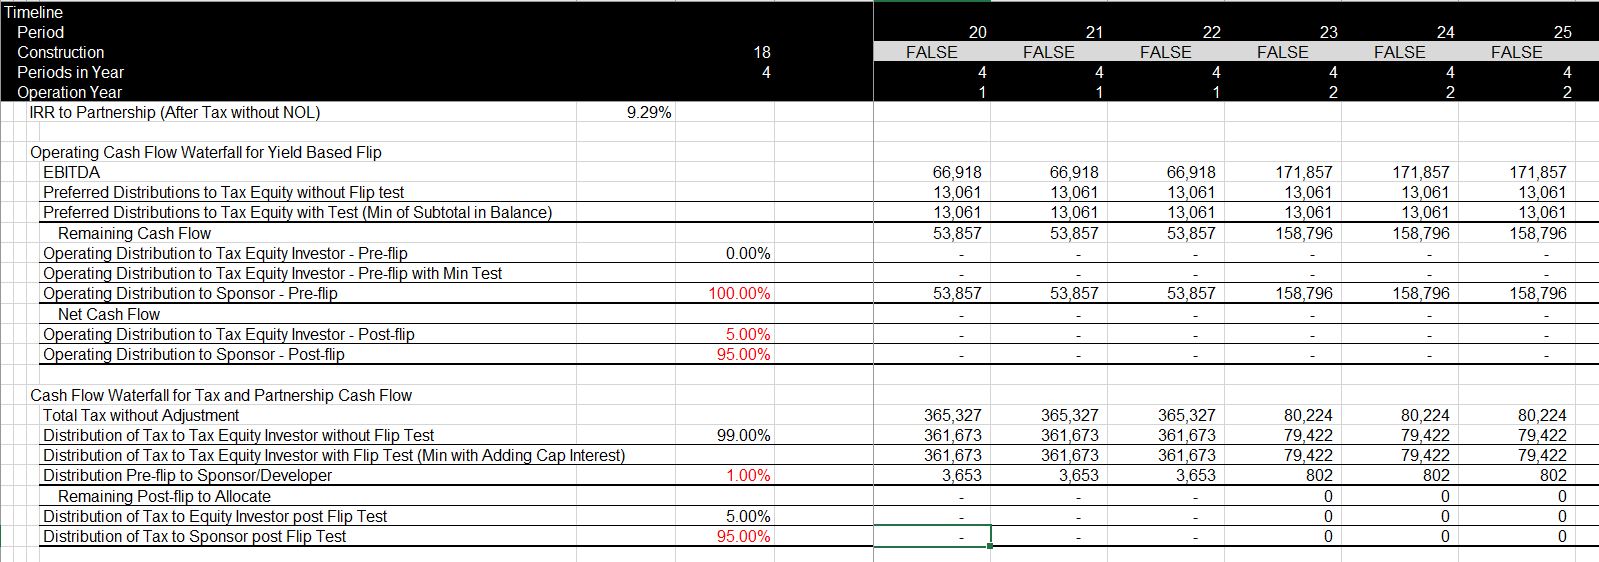
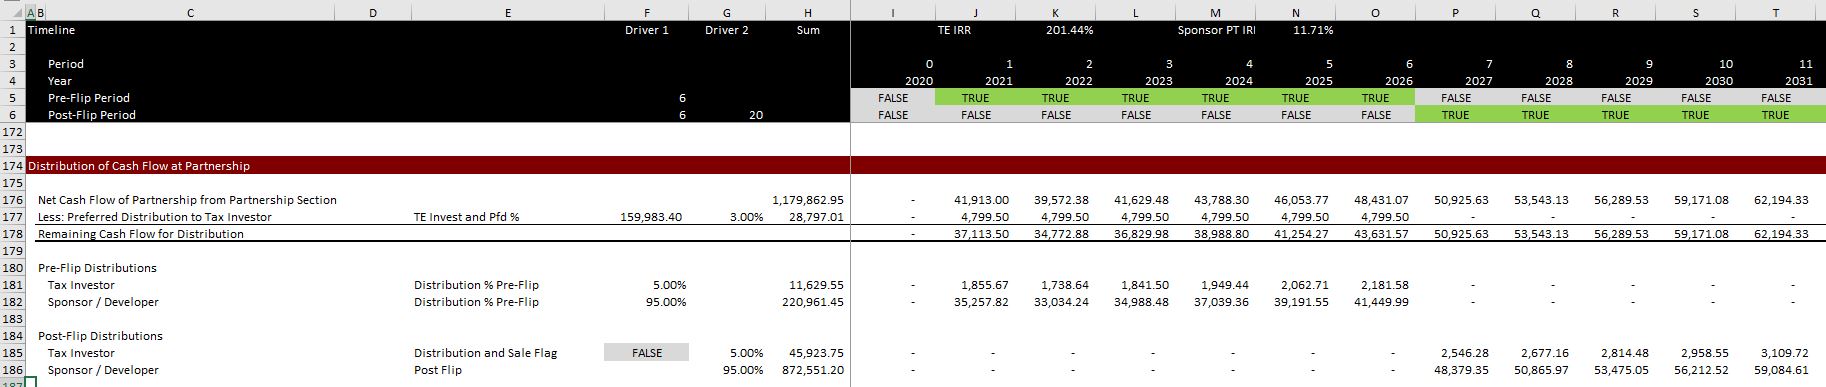
Step 4: Distribution of Partnership Cash Flow Pre-Flip and Post-Flip Periods
Notice the flip from the flags at the top. The total cash flow comes from the partnership analysis where the last line is the cash flow.
.

.
Here is another example that I made a few years ago. But the principle is always the same. You must first compute the cash flow of the partnership and then allocate that cash flow from your assumptions.
This shows the partnership income before financing. I am sorry about the size of the screenshot.
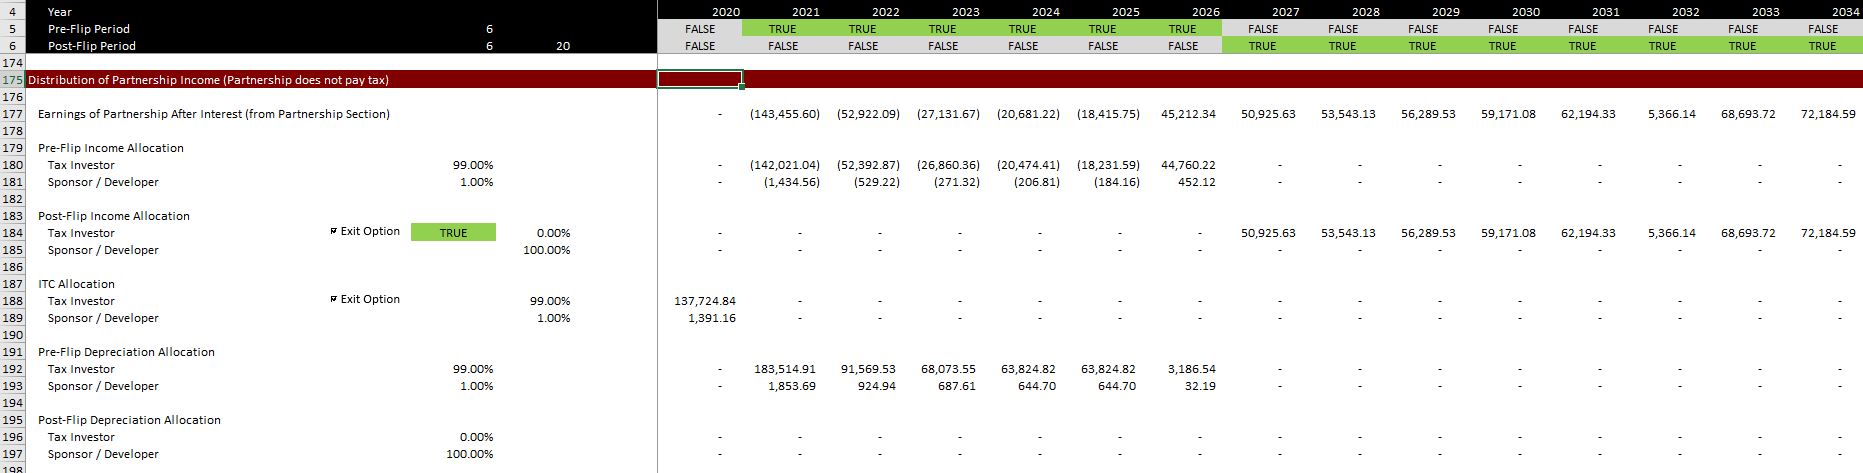
Distribution of Partnership Net Income Pre-Flip and Post-Flip Periods
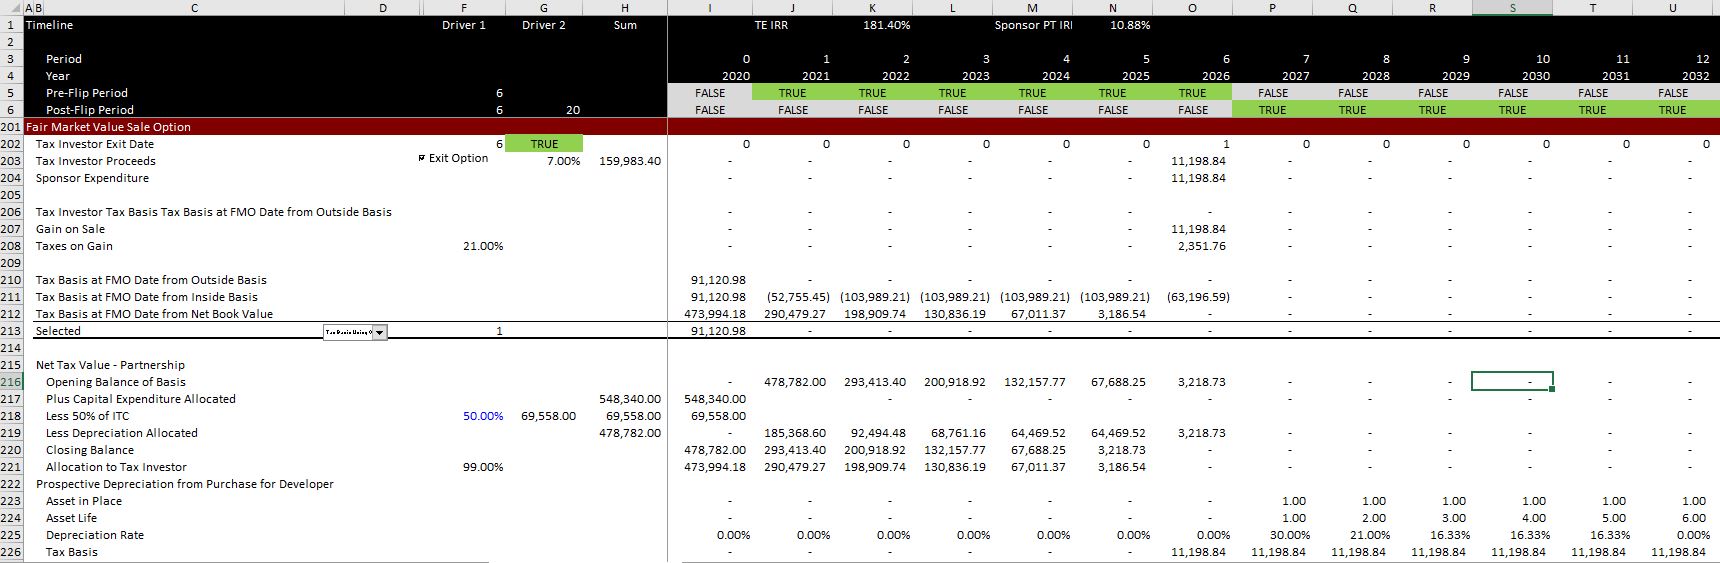
Modelling the Option for the Tax Investor to Sell His Interest in the Partnership and the Associated Tax Effects
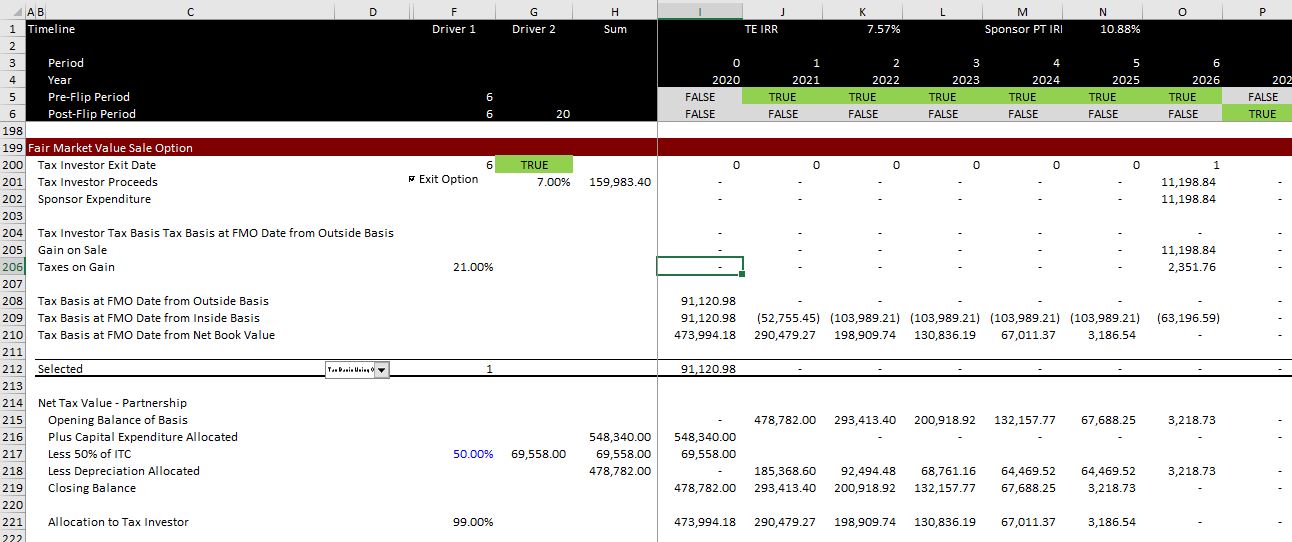
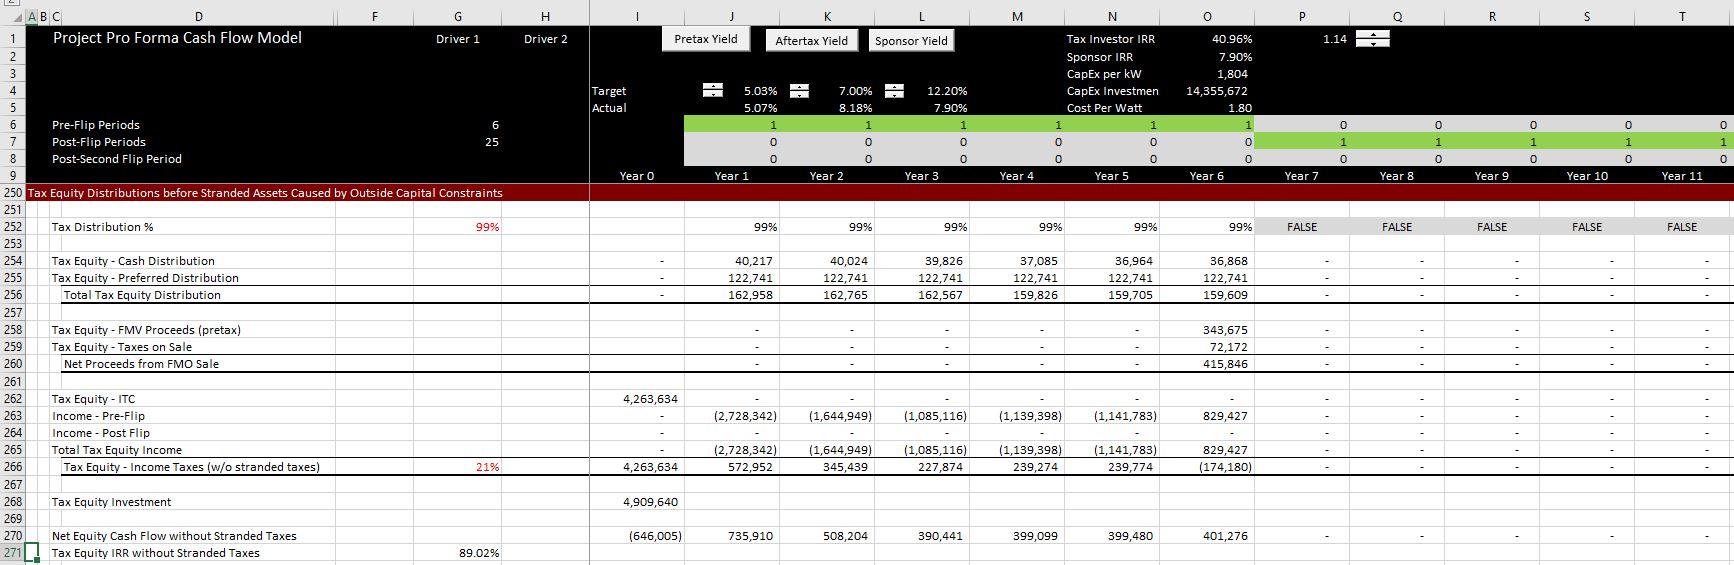
Modelling Cash Flow and After-IRR to Tax Investor Before Stranded Tax Arising From the Outside Capital Account
.
.
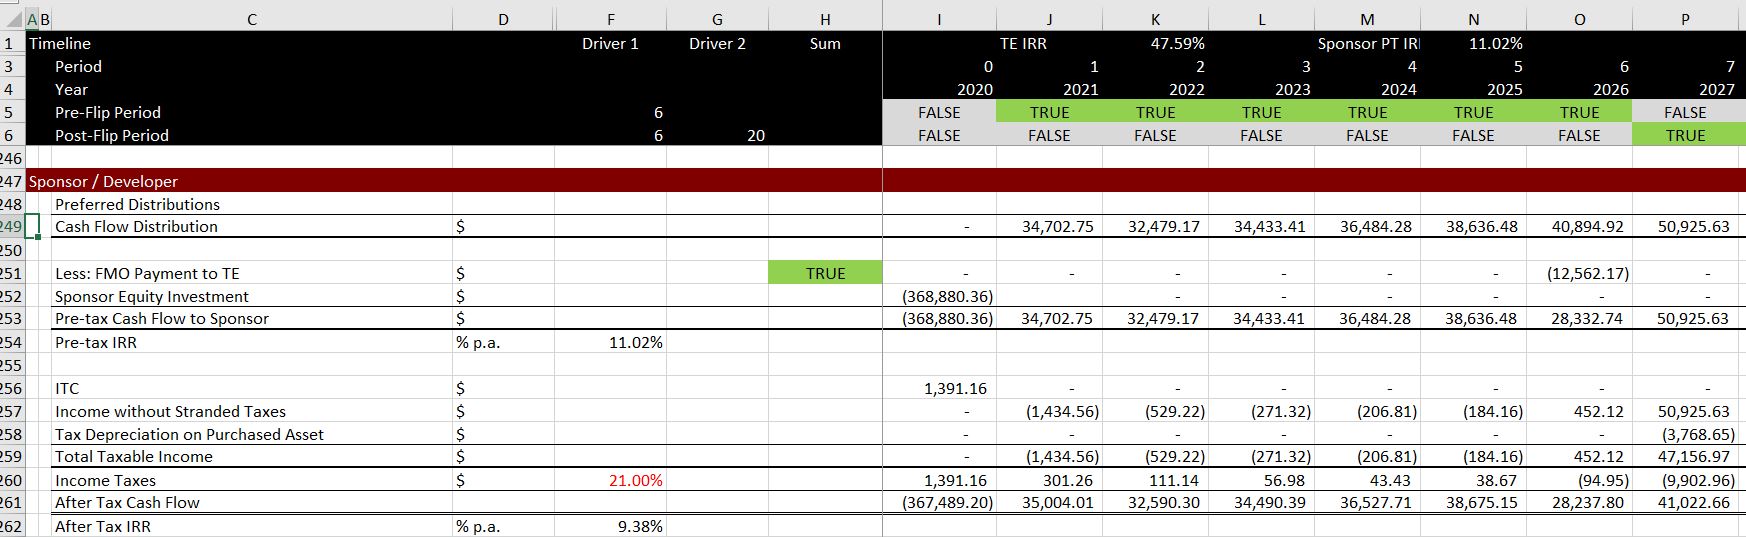
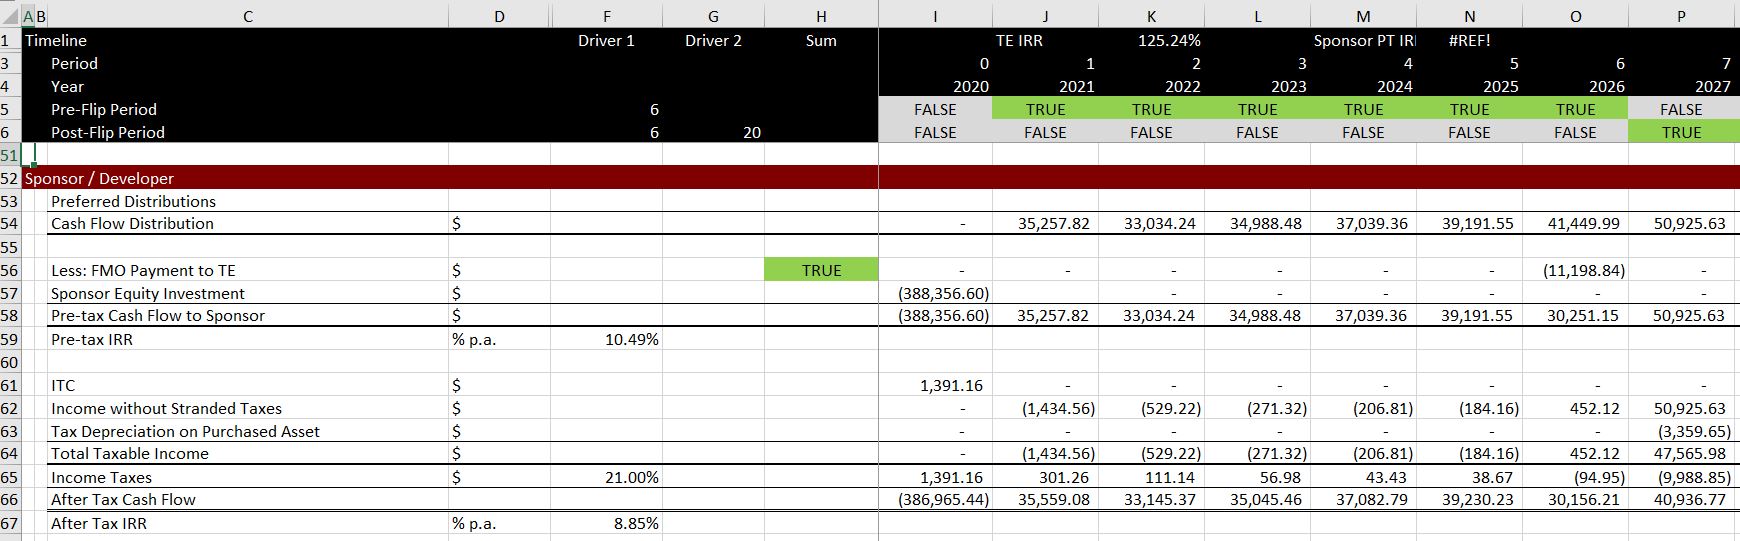
Modelling Cash Flow and IRR to Sponsor/Developer Investor
.
.
.
.
.
.
There are a lot of solar pages related to the files and the methods described below.
- The featured solar model page that is linked to this sentence includes completed finance models.
- There is also a file that allows you to automatically download panel prices and the price of silicon used in manufacturing the panels which is linked to this sentence.
- There is a webpage that works through resource issues including the performance ratio and how to find the best data on solar energy that hits a panel.
- There is a webpage that describes computation of the P50 versus P90, P99 etc. with some examples.
- There is a webpage that describes the arcane tax equity aspects of financing tax equity in the U.S.
- There is a page that works through how to consolidate multiple roof-top installations into a aggregate file.
Tax Equity Questions and Answers:
- What are the current range of interest rates on the construction and back-levered loans you are seeing for wind and solar?
- For solar deals, my understanding is that the flips occur as follows (comments welcome):
- For yield based flip (Wind Projects):
- yr 1 = 99%, yr 2+ = 67%, stepping back up to 99% when income is positive.
- Post flip has an additional allocation of 99% of income to tax equity until DRO is restored.
- DRO typically really high (70%+).
- Cash allocation varies, but often around 30-35%.
- Flip commonly occurring in year 7-8.
- TE typically providing 30-35% of the capital stack.
- For fixed flip based (Solar Projects).
- No DRO, so allocation stays at 99% given TE will reallocating losses to sponsor anyway.
- Needs one year of positive income, so flip typically happens in year 6.
- Cash allocation varies, but often around 30-35%.
- For yield based flip (Wind Projects):
- For wind deals with PTC:
- 99% allocation with ~20% cash for 10 years, until hurdle met (but never before 10 years)
- Paygo more common now,
- DRO typically around 40%
- What do you see as the typical hurdle rates for yield based solar and wind deals?
- What do you see as the typical syndication rate (% of ITC to TE) of fixed flip solar deals?
- What schedule do you see being used for s734(b) depreciation?
- What discount rate do you typically see for sponsor call option on each type of deal?
- On the s754 step up, how you see this most commonly being allocated? Based on allocation %s or whose gain it was?
- Call option tax – can you confirm this is your understanding:
- If TE s704(b) capital account is negative at call exercise there is a tax book value gain to TE to right their capital account. This is a tax cost to tax equity, but suspended losses are deducted from a gain.
- TO the sponsor this is a cost, so they can expense this gain through depreciation (on what schedule?)
- If TE s704(b) capital account is positive, there is a tax book value loss to TE. This loss to TE is a tax saving to and is therefore considered a positive cashflow to them
- The sponsor has to add this benefit they now receive to their EBT. Assuming they are inefficient it flows through their NOLs.
- Do you have any good guides on HLBV that we could provide to students as additional material?
Would love your view on sizing mechanisms and what typically governs in each case too.