This webpage describes modelling and analysis of financial companies including banks and insurance companies. The issue of modelling beginning with assets and evaluating returns on investments is covered. In addition the subject of equity valuation is addressed as well as holding a constant capital structure. The valuation using a market to book analysis along with ROE is also covered. I start by discussing banks and then move to insurance companies.
Valuation and Modelling Analysis of Banks
Unique aspects of the process of valuation and modelling of a bank is demonstrated with a simple model. You can download the model by pressing the button below. The financial model of a bank should begin with financial statements including a balance sheet and an income statement like any corporate finance model. Except, in the case of a bank, the format is somewhat different with the presentation of loans, deposits and different types of equity capital. The screenshot below the button with the file illustrates the starting point of the financial modelling process for a bank.
Once the financial statements are established, you can work on developing assumptions for a bank. In the screenshot for the exercise file, I have highlighted the driver of growth and the requirement to keep equity to capital at a given level.
Simple Corporate Model for a Bank Including Exercise for Resolving Circularity and Valuation
PT Bank Central Asia Corporate Model Demonstrating Valuation Issues for Financial Institution
Valuation and Modelling Analysis of Insurance Companies
The power point slides work through modelling and valuation issues for insurance companies. I begin by discussing some stock price and cost of capital issues and then move to modelling and valuation.
Stock Prices and WACC
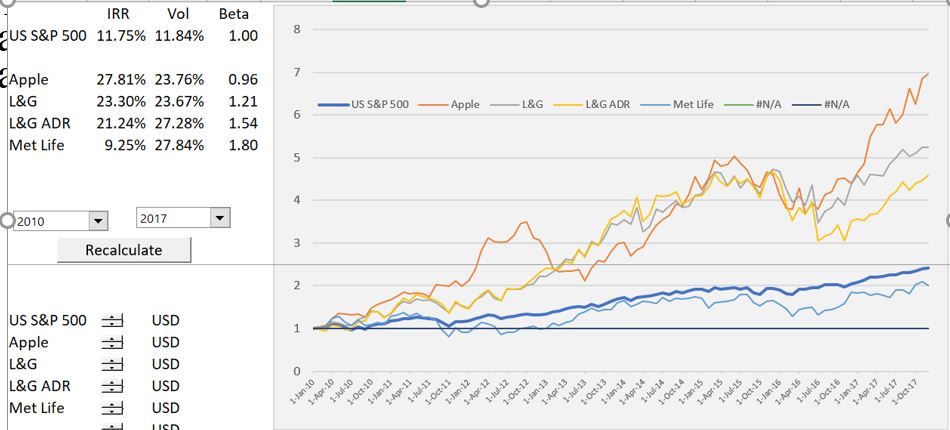
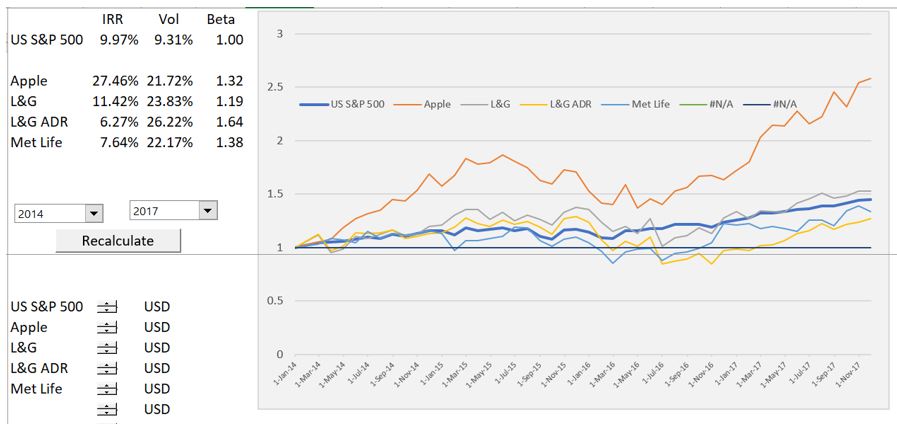
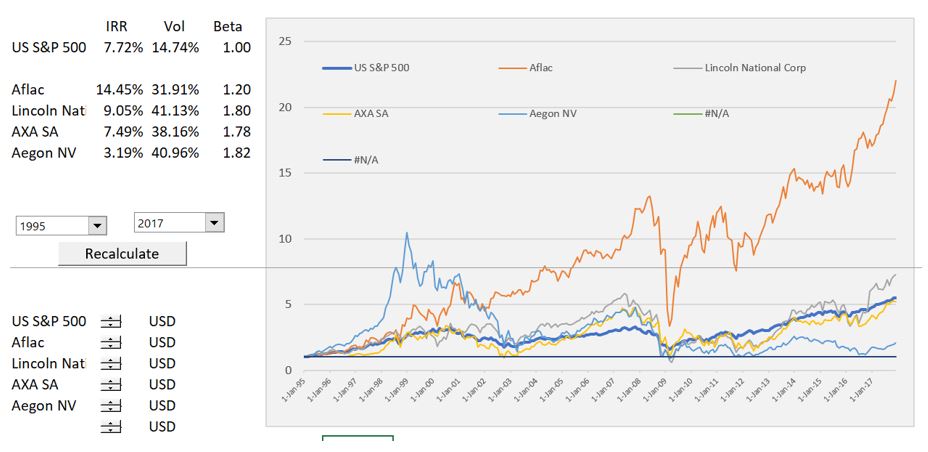
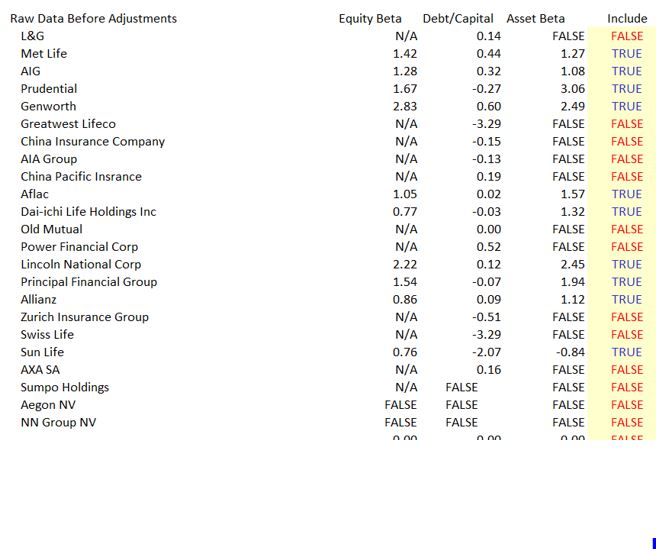
The graphs below introduce the valuation and modelling of insurance companies by presenting selected stock prices and valuation ratios. The stock prices come from the stock price file that you can download below. You can note the betas and the returns that have been earned by different companies. The graphs use different starting periods. Note that the volatility of the insurance companies is greater than the S&P 500 and the beta is generally greater than 1.0.
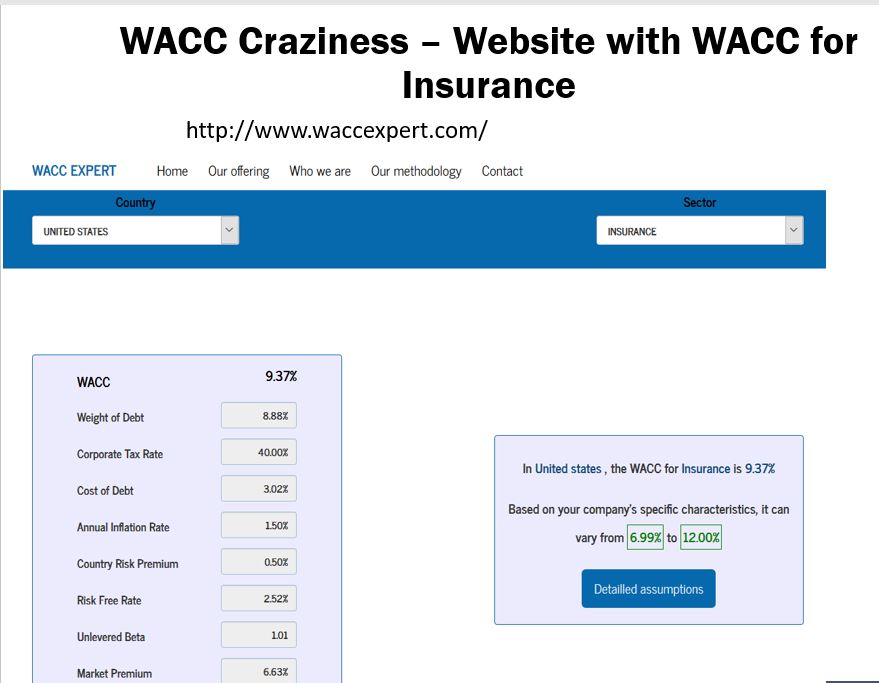
To see how much B.S. there is in measurement of WACC, I present the results of an absurd website that is supposed to give you the WACC for different industries. The second screenshot shows betas extracted from finance.yahoo.com. Note the big variation in the betas.
Retrieving Financial Data, Multiples and Comparative Data
The file below extracts financial data on insurance companies that allows you to compare multiples for different insurance companies and to get data that can be the basis for a financial model. I present a couple examples of extracting data from this file below. The file is different from other files that extract data for companies like Amazon and EDF because of the accounting for insurance companies. It was a real pain to make the file for insurance companies from market watch and it works like the other files that download financial data. The first two screenshots demonstrate how you can create an analysis. But the most important thing in the file that you can download below for insurance companies is the ability to retrieve financial data to begin creating a financial model. The data you can retrieve is illustrated on the fourth screenshot below.
Financial Database for Insurance Companies with Different Format
Creating Value for an Insurance Company
Before describing the financial modelling process for insurance companies you should know how the process for reserve accounting, claims and premiums work. To do this I start with a very simple example that includes the following:
- A single policy with an assumed claim after a certain period.
- The present value of claims establishes the amount of reserves on the balance sheet
- A discount rate that reflects the return on investments made between the receipt of premiums and payment of claims.
- Value comes from a positive present value of premiums; this occurs when the present value of writing new policies is positive.
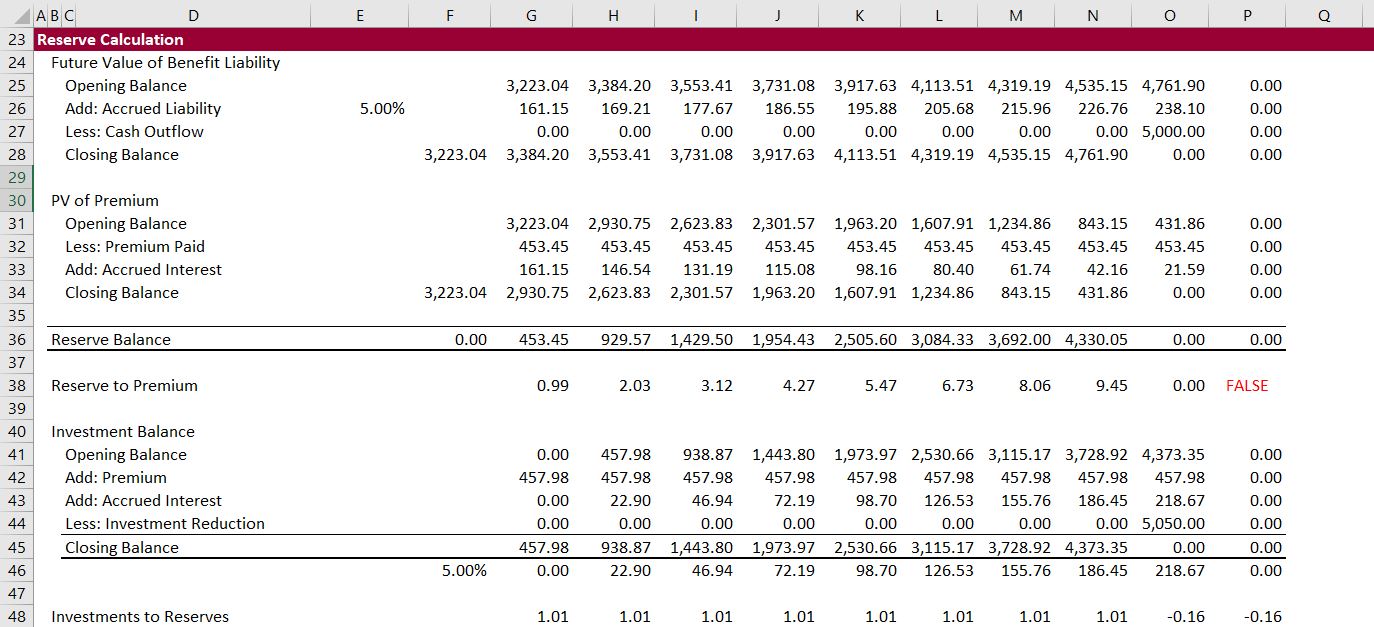
To understand financial statements of insurance companies I have created for myself a simple example of reserves, investment and accounting for a single policy. In the example, at a 5% discount rate, the NPV of the claims establish the value of reserves on the balance sheet. The little file I made with an analysis of reserves is available for download by pressing button below. In this case it is assumed that the premium has a 1% premium relative to the present value of the claims. The starting point is illustrated below where the nominal outflow for the claim is assumed to be 5,000.
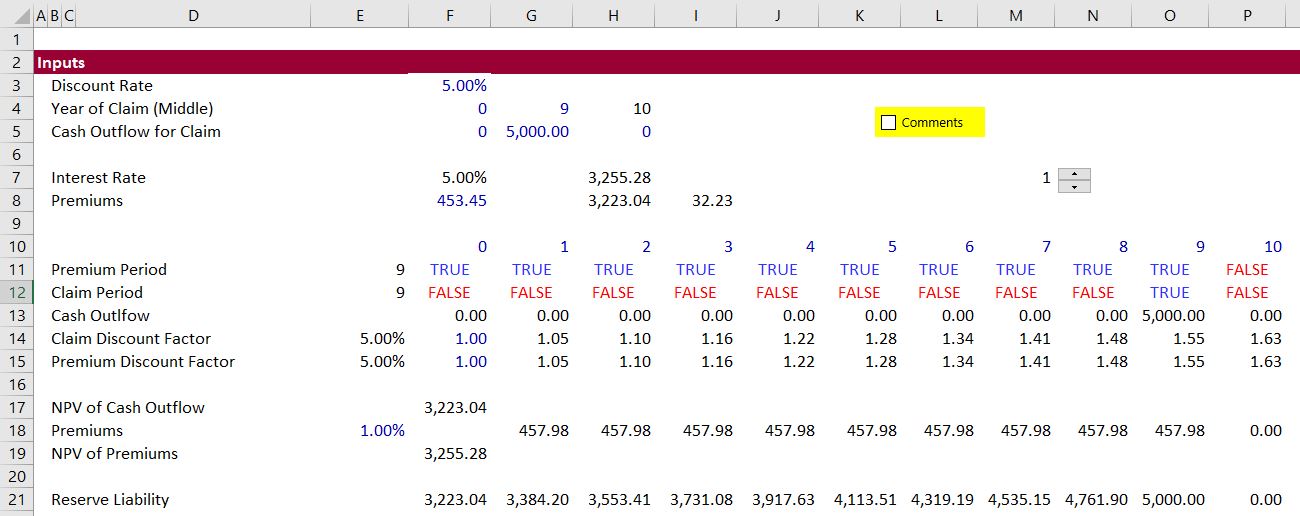
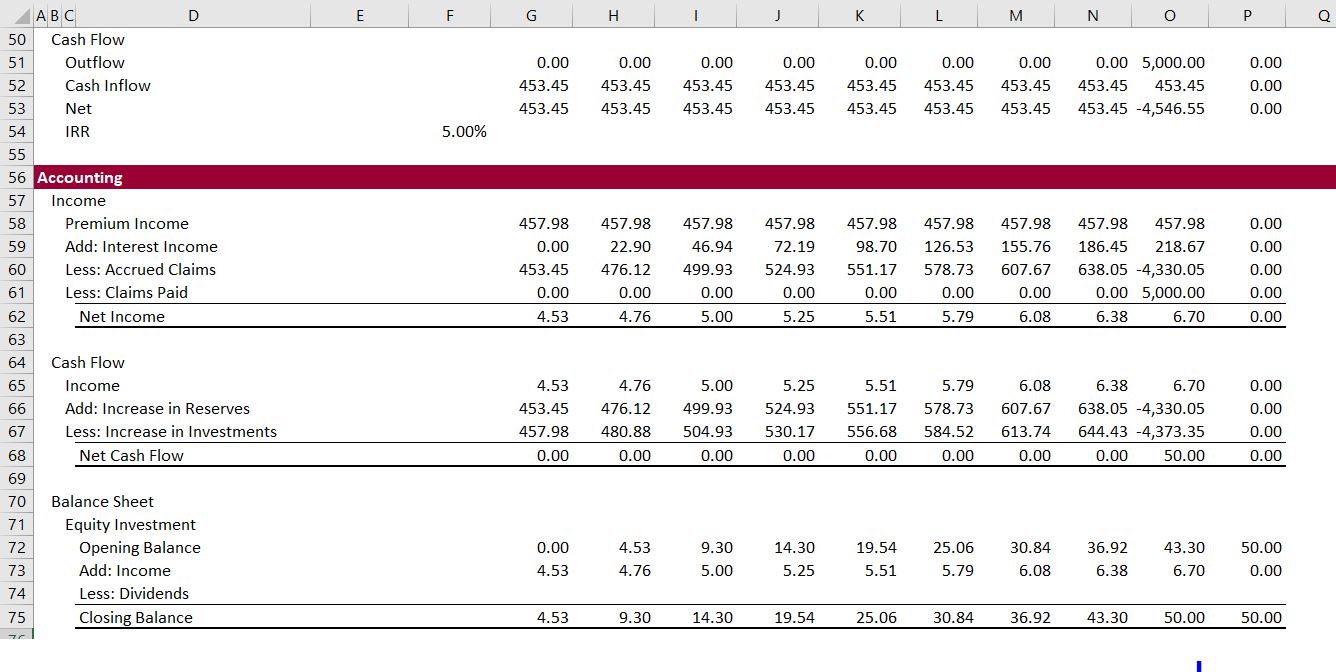
The next two screenshots demonstrate how the reserves are included on the balance sheet and how they build up to the ultimate claim liability. Using the example where the premium NPV is more than the outflow for claims (on a NPV basis), the balance sheet and cash flow are demonstrated on the second screenshot. Of course for real companies the outflow for the claim is unknown and there are many premiums that continue.
The income statement and the cash flow statement for our simple single reserve example is shown below. Note that the premium and the claims result in the target return. Not also that the income comes primarily from the premium less the accrued claims.
Financial Modelling Process for an Insurance Company Using a Simple Case
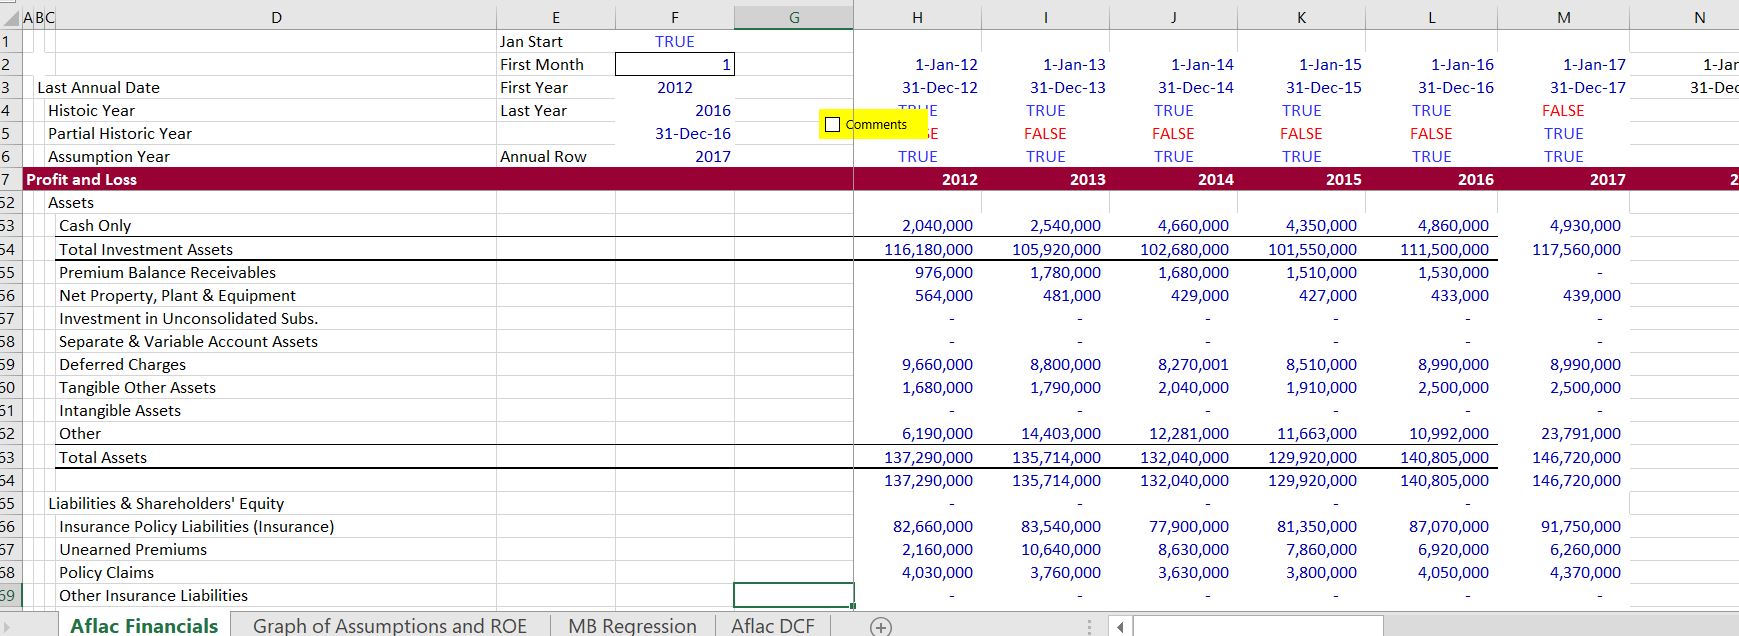
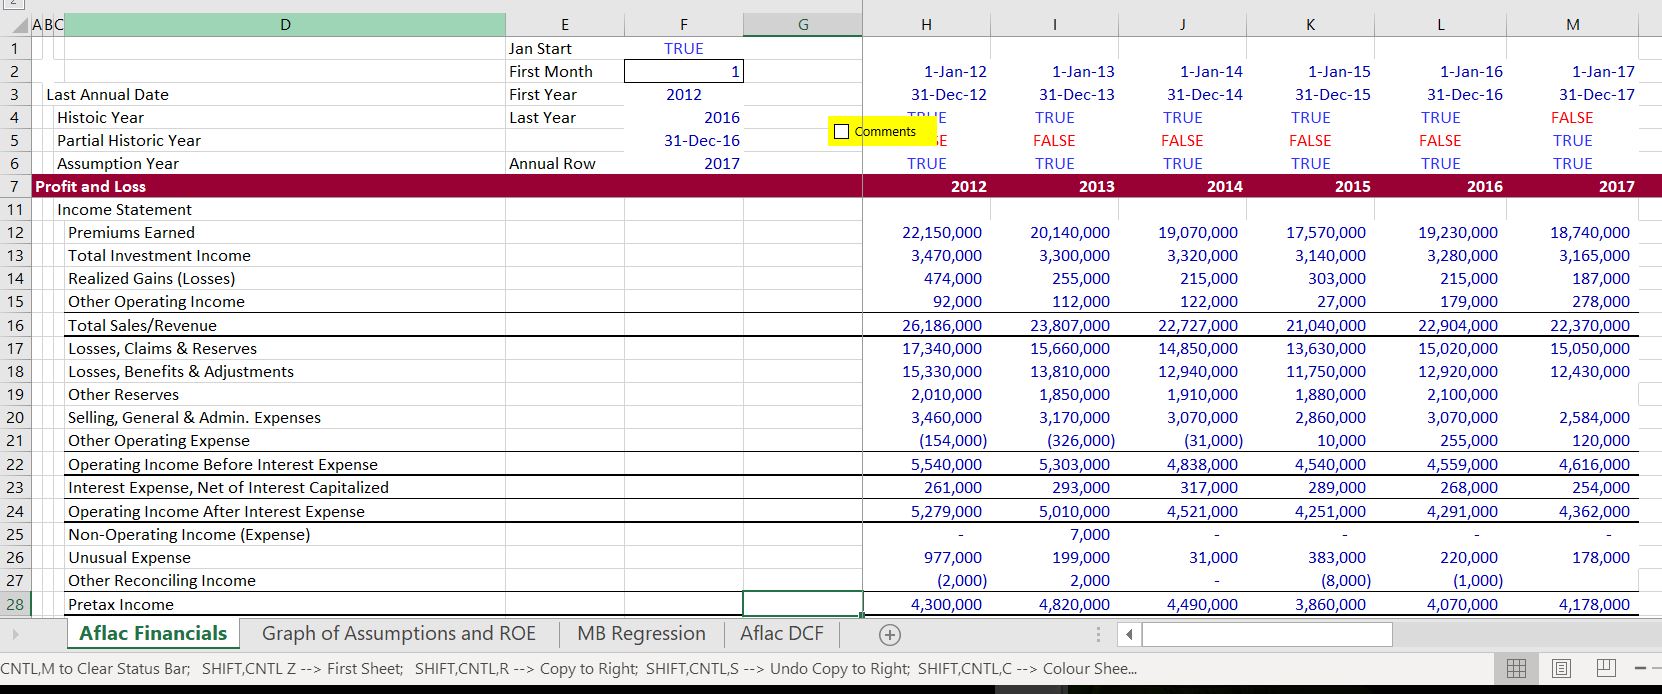
As for the financial modelling process of a bank, the valuation and modelling of an insurance company is first demonstrated with a very simple model. You can download the simple insurance company model by pressing the button below. The financial model of an insurance company should begin with financial statements including a balance sheet and an income statement like any corporate finance model. Except, in the case of an insurance company, the format is somewhat different with the presentation of premiums, reserves and different types of equity capital. The screenshot below the button with the file illustrates the starting point of the financial modelling process for an insurance company. The screenshot also demonstrates that a historic switch is very helpful as usual for corporate models.
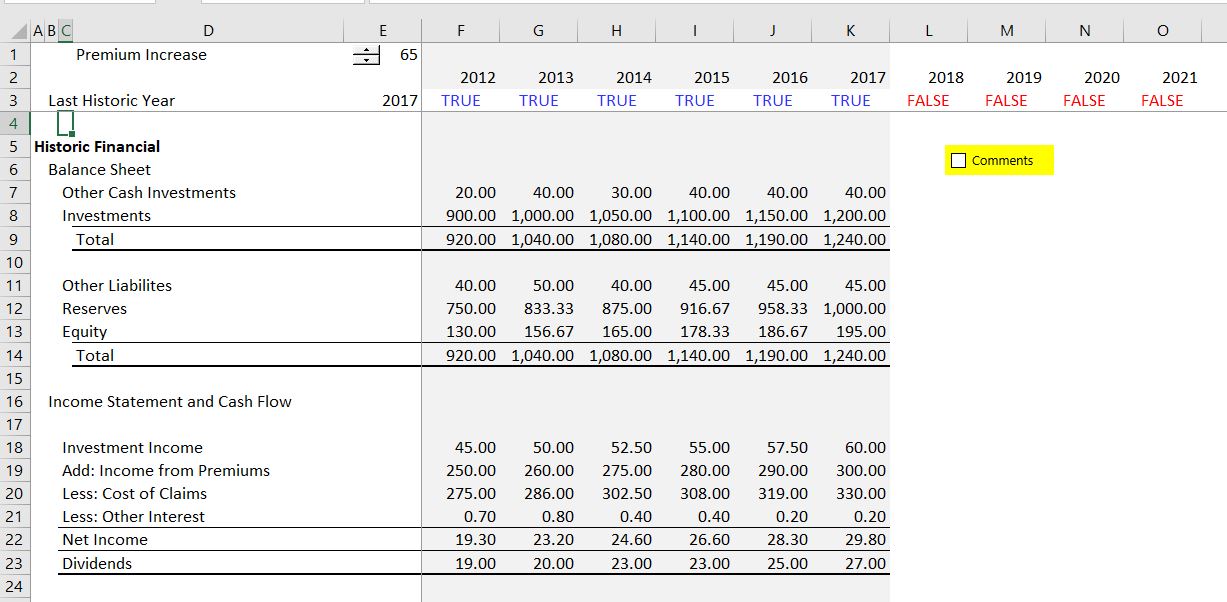
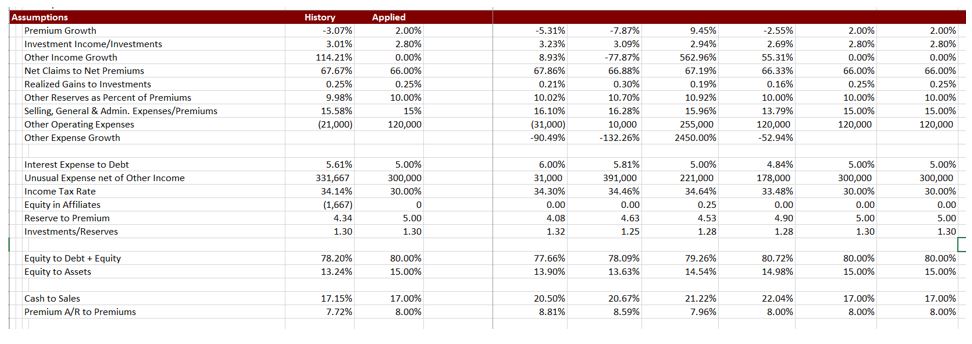
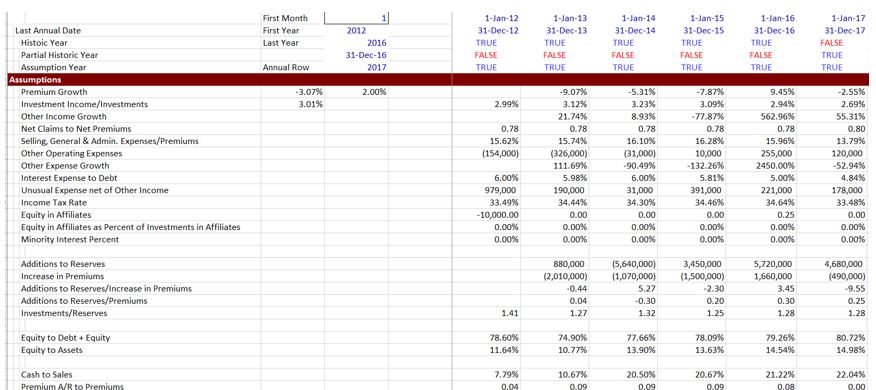
Once the historic financial statements are established, you can work on assumptions. In the screenshot from the simple exercise file, I have highlighted the driver of growth — the premiums, and the requirement to keep equity to capital at a given level. The screenshot with the assumptions demonstrate that you can develop a series of assumptions from historic financial statements.
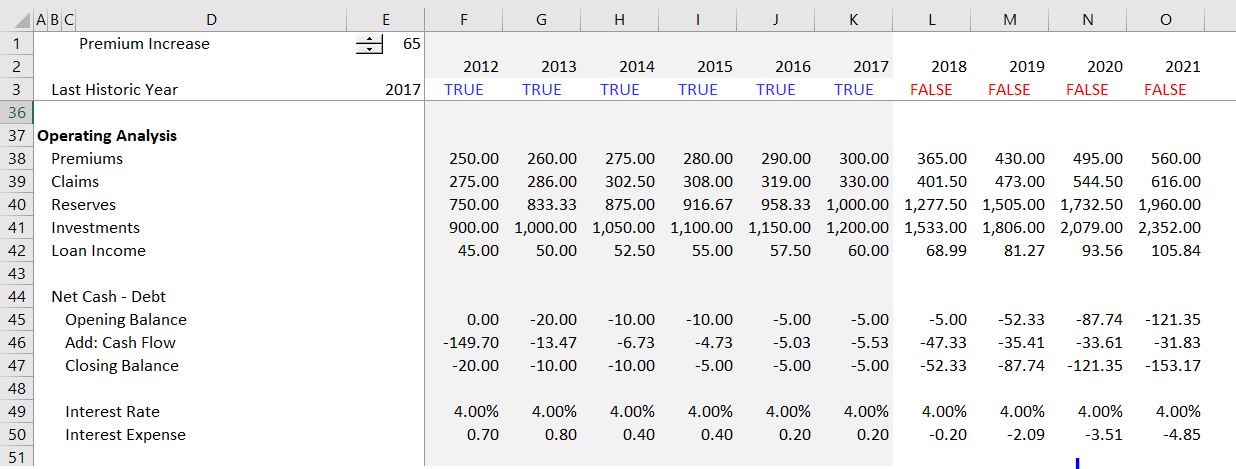
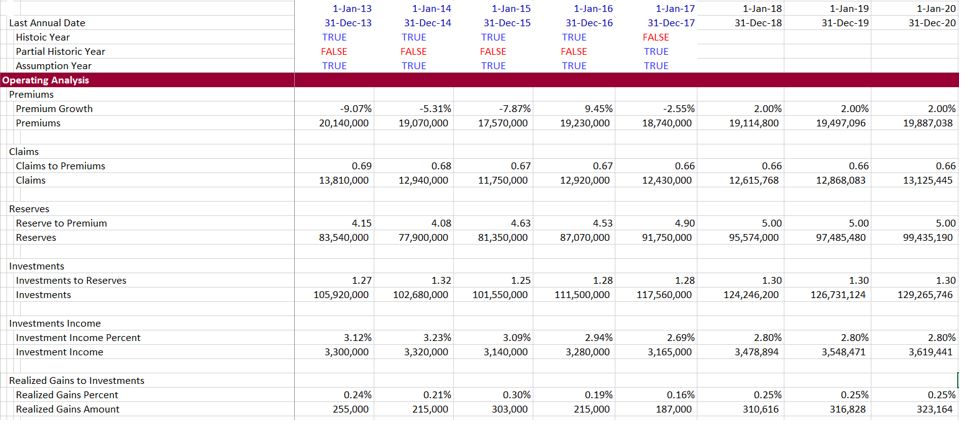
The third screenshot from the simple model illustrates how to create an operating analysis where you estimate the year by year value of premiums, investment income, reserves and other items. This is like the working section in any model. Most of the values can come straight from extrapolating the balance sheet.
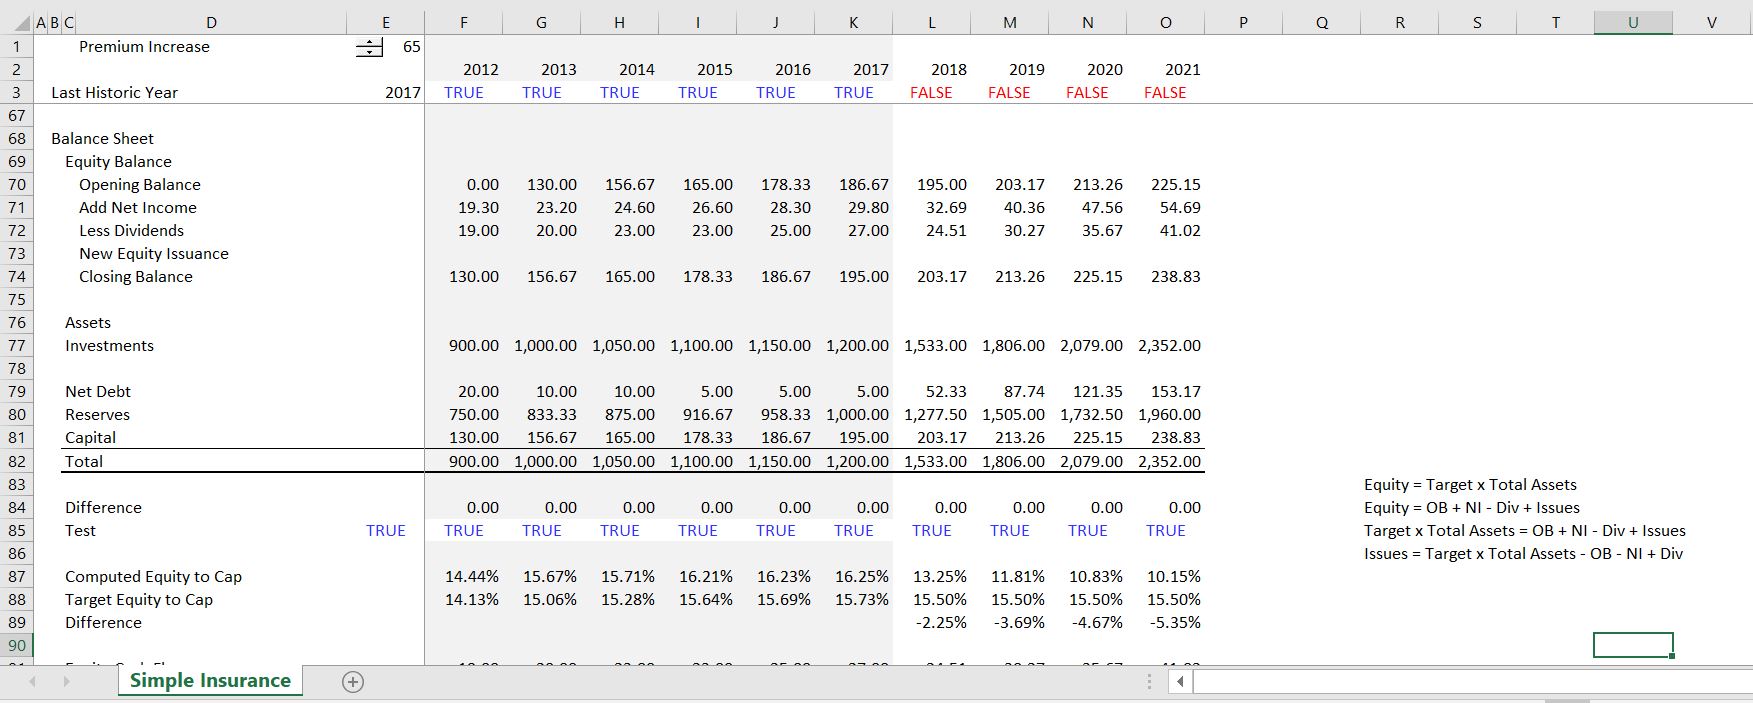
The final screenshots from the simple model show the financial statements and a valuation framework. As with other models there must be a connection between the cash flow analysis and the cash or investments account. You can create a separate other loans and investments balance to do this, where other investments is like surplus cash and other loans are like other debt. Finally, in developing the financing, you should keep the equity capital at a target level relative to the capital. You can do this using the solver (which is very clumsy), or in this case you can use some algebra that is not very complex. The algebra to derive a constant capital structure is included in the simple model file. Alternative mechanics of evaluating value using equity cash flow for banks or insurance companies are discussed in a separate section below.
Insurance Company Modelling Case Study: Aflac
I have included a case study of an insurance company to illustrate how some of the principles in the simple case above can be applied. The case study also demonstrates how to use the financial database file to create base financial statements and how to automate assumptions. I have selected Aflac, but you can use the drop-down box and select another company in the historic financials tab of the financial database. This tab in the financial database provides both the financial data and bases for assumptions like the ratio of premiums to reserves and the ratio of investment income to investments. The starting point of the analysis that you can take from the financial database is illustrated in the screenshots below. The excel file that contains the case study is available for download by clicking on the blue button.
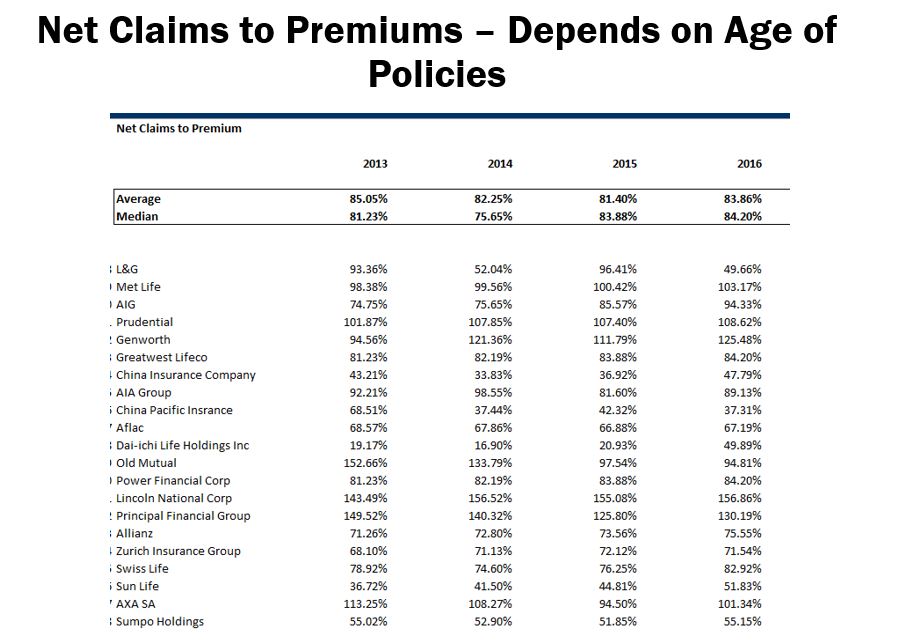
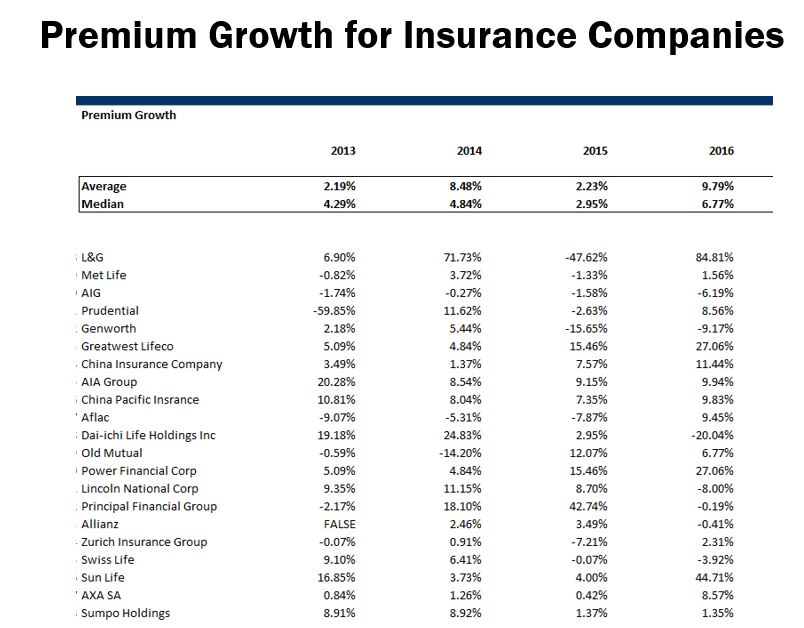
In developing the assumptions, I have tried to automate a number of ratios that can be used as the basis of projections. Some of these projections are shown in the screenshots below. The first screenshot demonstrates the historic ratios that are computed from the financial database so that you do not have to waste a lot of time computing some of the obvious ratios. The next two screenshots illustrate how you can use the financial database file to make comparisons among different insurance companies for the various ratios.
As with the simple model discussed above, once you have made the assumptions you should develop the operating analysis. The operating analysis uses the various ratios from the historic financials to create forecasts of different items. Once the operating analysis is complete, the financial statements can be prepared and the different ratios can be computed. Again, as with any model, there must be a connection between the balance sheet and the income statement. The amount of equity capital can be computed using algebra and the reasonableness of the financial ratios like the return on equity can be verified. As with any model if the return on equity is far above the level of other companies and if the return on equity is higher than for other companies, your model is most probably a lot of B.S.
Valuation of Financial Institutions including Insurance Companies
Unlike the other corporate models where free cash flow and WACC are the centerpiece of valuation, equity cash flow drives the valuation of insurance companies. As with any valuation in corporate finance, there is an explicit period and a terminal value. For computing the terminal value of a bank or an insurance company there could be a variety of different possibilities.
- First, you could simply compute the equity cash flow in the terminal year and assume a growth rate. But the equity cash flow is driven by the dividend policy and the assumed equity to capital ratio. It may be the case that the terminal cash flow is not stable as with any company.
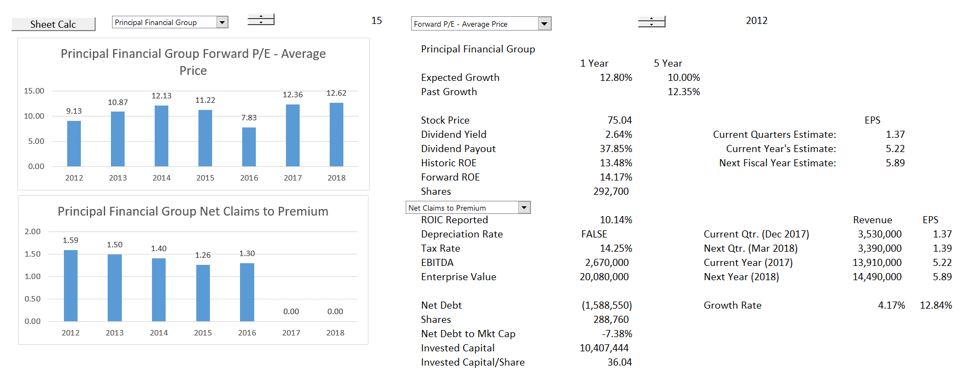
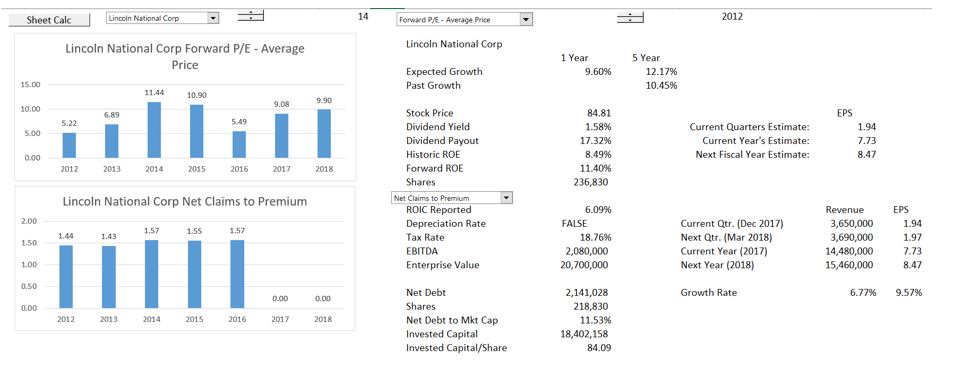
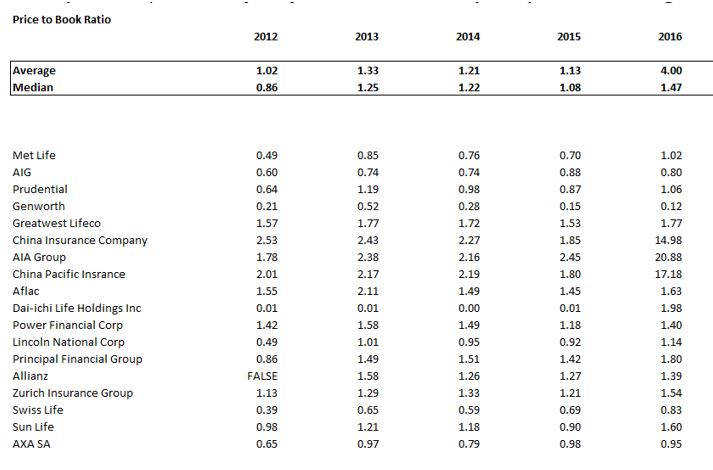
- Second, you could assume a P/E ratio consistent with other companies in the industry. But as usual, the P/E ratio is not stable across time or across companies. This is illustrated in the screenshot below.
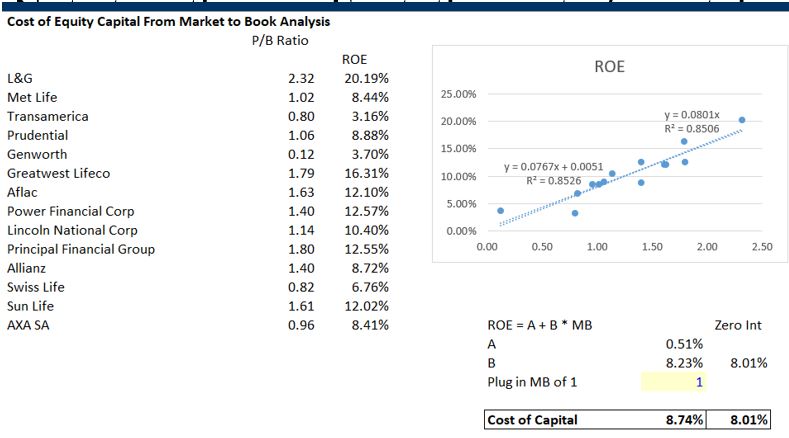
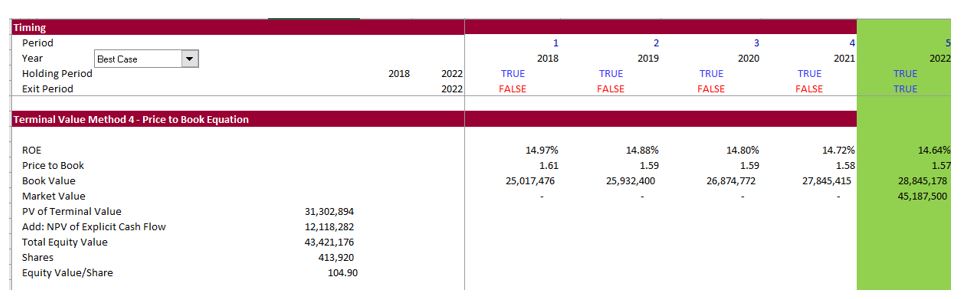
- Third, you could use the relationship between the market to book ratio and the return on equity to use the built-up equity value and develop a valuation. To demonstrate how this works, consider a case where the equity cash flow is low because the equity to capital ratio is increased. If you used the equity cash flow method, you would get a low value because of the reduction inequity cash flow used to increase the ratio of equity to capital. This would give you a low valuation and that low valuation would come from the assumed capital structure and not from the fundamental value drivers like premiums relative to reserves. So instead you could begin with the equity balance on the balance sheet in the terminal year. You could multiply this by a price to book ratio. But the price to book ratio is dependent on the return on equity. Therefore you can create an equation using a regression analysis where, MB = A + b * ROE.
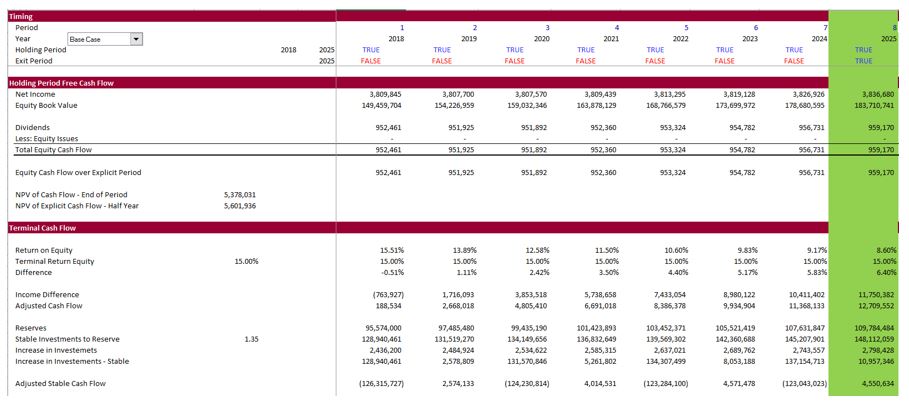
The screenshots below hopefully illustrate some of the valuation ideas for an insurance company or a bank on the basis of equity cash flow. The first screenshot demonstrates the price to book ratio for different companies across time. The second screenshot shows the relationship between the market to book ratio and the return on equity which should have a strong correlation and a strong positive relationship. The third screenshot illustrates the equity cash flow and the terminal period from the Aflac case study discussed above. Finally, the last screenshot demonstrates how you could apply the price to book method with the regression to establish the equity value.
Return on Risk Adjusted Capital and Bank Modelling and Analysis
The videos and files below demonstrate issues associated with computing the return on risk adjusted capital for banks and financial institutions. To make this calculation you much input the probability of default for loans. There are a lot of lookup and interpolate functions in this file. To compute probability of default, this file uses various different financial ratios and other qualitative judgements. The interpolate lookup function is used both for computing credit scores from financial ratios and also to compute probability of default and loss given default from the credit scores.
RAROC Model.xlsm
Financial Ratio Analysis Large Banks.xlsm