This page explains how you can create a financial database with many years of financial data without paying high fees for Bloomberg or something similar. The database includes financial statements, stock prices and corresponding valuation ratios and multiples. I have been working on an approach to retrieve financial data and then use the data as a basis for financial models or in valuation analysis for many years. Even if you have Bloomberg I hope you will take a look at the file if for no other reason to see just how much you can do with some macros and some structured excel formulas. The file goes to Yahoo Finance and retrieves both market data (stock prices) and accounting data. I have tried to make effective presentations of financial ratios, multiples, cost of capital and other issues central to financial analysis in this file after the data is retrieved from the internet. I have made many changes to this process over the years and the tool described below is something you can adjust for yourself. I have used it in legal proceedings where I testify on the cost of capital. I have adjusted the tool so it can be used to retrieve data for international companies and adjust for exchange rates. An illustration of two of the pages that you can use is shown below.
.

.
Fetching data with Limited History
If you want to get data for a few years and compare this data to the stock price to get a presenation, you can use the library in python called yfinance. If you install python on your computer and then get some libraries (yfinance, pandas, openpyxl) you can download the excel file below. This file can get financial data, stock price data and general data for a long list of companies. The data is put into separate sheets and then I use excel to do make analysis of graphs and other data. By using the INDIRECT function in excel along with XLOOKUP we can scrape a whole bunch of financial data from the internet and create a historic database of Financial Statements, P/E ratios, EV/EBITDA, operating ratios and other multiples for financial statement analysis, valuation, modelling and cost of capital analysis.
To get the analysis, you can click on the blue button below the screens shot and you will get a zipped file with the files that I zipped. This zipped file has the pyton code and the base excel file necessary for the downloading process (the python file named integrated_finance.py and the excel file named Integrated Financial Analaysis are the only files that you really need. You should put the files difectly on your computer (e.g. on the C: Drive) and not on your one drive. You also need to install python as I explain in the stock price download section (I include the video below).
.
.
.
The way the python program works to create the financial analsysis is discussed in the video below.
.
.
.
Restrictions to Finance.yahoo and Marketwatch Data that was Previously Available
Life has began to really suck when you try to get data. In the past you could get financial data from market watch wihout much effort — just using a macro with workbooks.open. This is no longer possible. Similarly, you could get stock price data from finance.yahoo which was wonderful because you could evaluate something called adjusted stock prices that adjusts for dividends. This is also no longer possible. Further, you could hack the FRED database to compare the data with just about any economic data series. This has changed also. After losing access to the data I was seriously depressed. But then I suppose you can use challenges as opportunities. I paid a couple of hundred dollars to access the finance.yahoo data and then revised the database. Now there is more historic data. Now the tickers are consistent (no switching between marketwatch and yahoo). Now the process is more structured and organized as when you re-do something it should improve.
.
.
If you have paid for finance.yahoo (as you can see below that I have by the GOLD tab), then you can google finance.yahoo.com and get the company. On the left you need just two things. Frist is the historic data to get the stock prices. The second is the financials which puts multiple years of financial statement data in a reasonably consistent format. For now, you can download the three annual financial statements. These will be consolidated in subsequent steps.
When I have used the database in the past for case studies on valuation or to demonstrate the history of an industry
The second file below inculdes the analyis. You can create this file by moving the sheets from the file above to after the break sheet. This is explained in the step by step process below. This file includes the presentation and analysis of the data.

.
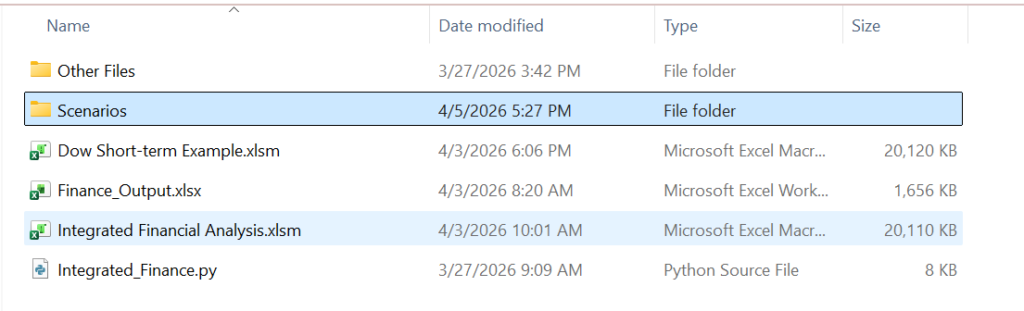
The screenshot below illustrates putting data in a folder that will be uploaded.

.
The screenshot below shows two folders that contain all of the files.
Update the stock price indicies

.
.
.

.
.
.

.
.
I used to put the read ticker and the analysis into the same sheet. But the analysis sheet uses a lot of INDIRECT functions and it is faster to separate the read data from the analysis. This causes a couple of extra steps, but I think the time saving is work the extra manual steps. You can see below that the read file may take 1/2 an hour. It would take even longer if the process was combined.
.
- Step 1: Find prior versions of read data and financial analysis (attached to buttons)
- Step 2: Enter Tickers in the read data file
- Step 3: Clear data from the read data file
- Step 4: Run the Read Finanials, Read Stock Prices and Economic Variables (May take 1/2 hour)
- Step 5: Remove Range Names from the Read Data file
- Step 6: Copy Menu Page to the Financial Analysis File (Do not copy last ticker sheet name in column M)
- Step 7: Re-save the Read Data File with only Data — i.e. remove the menu sheet
- Step 8: Go to the financial analysis sheet and clear the data
- Step 9: Select all sheets from the Read Data sheet and then copy them to the end of the Financial Analysis Sheet
- Step 10: Go to the summary graph in the financial analysis sheet.
..
GBP problem (Shell Example)
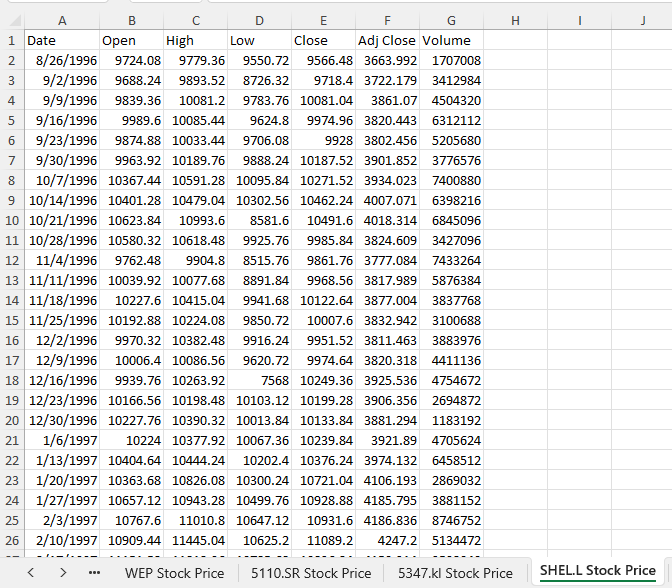
Unfortunately, the yahoo database for stock prices uses pence instead of pounds when compiling the data. This means that when you compare stock prices to the book value per share or the earnings per share, you will get ratios that are off by 100. To resolve this you can use the copy and paste special with multiply and multiply the stock price data by .01 — this would be the case for example with Shell and BP. Note that for Shell and for BP, even though the stock price is in USD for the ADR (American Deposit Recipts), the financial statements are in GBP as illustrated below. Further note that you can find the currency in the balance sheet and not the income statement of the markewatch website.
.The screenshot below illustrates the yahoo stock price for SHELL.L from yahoo.
.
.
Acquiring Tickers for U.S. Companies trading on U.S. Exchanges
For the simple example to start with, I have entered three ticker symbols for U.S. companies as shown in the screenshot below. To get the other tickers, I suggest that you use go to a search engine and then throw the markewatch ticker and the yahoo ticker into the spreadsheet. As with other pages that describe how to work with the Financial Analysis Database, the objective is to make sure you are completely comfortable with how the database works and how you can modify things by yourself.
Step 2: Enter the Tickers in the Read Data Sheet
If you want to use and existing set of tickers such as for the Dow 30 stocks, you can also go to the bottom of the sheet where I have put in some examples of companies to use. To use the selected companies, just copy the ticker symbols in to column D and column F of the menu sheet and then copy the company names into column B. You can also copy the currency adjustment factors into column C which will normally be 1.0 except for UK companies and the pence/pounds problem as well as companies that do not have stocks in local currency on yahoo.
For the selected companies I have included the ticker symbols and potential adjustments for currencies (one of the horrible examples is that Yahoo Finance uses Pence for UK companies while Market Watch uses Pounds. This means when comparing earnings to stock price and other statistics, an adjustment is required.) Another problem occurs for Japanese companies where Yahoo does not report stock prices in Yen. Note that you should put the extra end of the URL into the main sheet.
.
.
Step 5: Delete the Ticker and the Break Sheet from the Retrieve Data Book and Select All Sheets
After copying the data, you can delete the sheets and then you can select all of the sheets. One the sheets are selected you can move them to the Analysis Book. I suggest not to save the file at this step.
When copying the data, it works much better if you use the create copy option.
.
..
Explanation of How to Collect Tickers and Download Data
The thing that takes me the most time in structuring the database on historic financial data is simply to find the appropriate ticker symbols. For companies like those in the Dow 30, you can just google the Dow 30 and get the list of companies. The ticker symbols for these companies are the same in Yahoo and Market Watch. So, you can google the name of the company along with yahoo finance. For companies that are not in the US and primarily trade on other exchanges, the process is a little more complex. Take for example the case of EDF in France. You can google EDF Market Watch and find the ADR. When you look at the financials in Market Watch you will see that financial statements are in Euro and not in USD. This means when you get the stock price from Yahoo, you must also get the data in Euro. So you must get the ticker symbol from Yahoo that uses Euro for stock prices (rather than the ADR).
The case is illustrated below for a UK company called Interserve. When you make a google search for the company with Market Watch, a couple of options appear. Note in the screenshot below there are different ticker symbols for Interserve. You cannot simply take the first option without checking the Market Watch site to see which of the tickers includes the financial statements.
The screenshot below shows the Market Watch site using the IRV ticker symbol. Note that you do not see any financial statements. The URL in the screenshot shows that the URL is IRV. But when you look at the page, you can see a menu that includes items for “OVERVIEW” and for “CHARTS.” But in the menu, there is no “FINANCIALS” option. When you see no financial statements, there will be nothing to download and if you use this IRV ticker in the financial database, there will be no financial statements for the company.
.
In the screenshot below, the ISVJF ticker is used as shown in the URL at the top. Now the menu on the page includes FINANCIALS after the “OVERVIEW”. Because the FINANCIALS are included, this ticker ISVJF should work in the file while the ticker in the above file will not work. Note that because the company is in London, the financials are in Sterling and not in USD.
The financials in GBP are shown in the screenshot below. I have circled the currency of the financials. As the financials are in GBP, the stock price must be in the same currency as stated above..
One of the main aspects of the financial database is combining stock prices with the financials to compute things like P/E, EV/EBITDA and Price to Book. Market Watch does not (to my knowledge) have stock prices that can be easily downloaded. This is why I use the Yahoo website. When you look for the Interserve stock price you find something like the following. Notice that I have circled the ticker with the .L at the end.
Videos that Demonstrate how to Collect Ticker Symbols in Different Countries and Put Together a Database
The video below demonstrates how to use the file once the tickers have been entered and the types of information you can get from the file including: (1) comparative reports of P/E, EV/EBITDA, P/B, ROE etc.; (2) a historic layout of data that you can use as the basis of financial models; (3) an interactive report for single companies; and (4) cost of capital analysis.
[wonderplugin_video iframe=”https://www.youtube.com/watch?v=MUAZj-1Cv3U” videowidth=600 videoheight=400 keepaspectratio=1 videocss=”position:relative;display:block;background-color:#000;overflow:hidden;max-width:100%;margin:0 auto;” playbutton=”http://edbodmer.com/wp-content/plugins/wonderplugin-video-embed/engine/playvideo-64-64-0.png”]