This page includes analysis of up stream oil project finance with production sharing agreements and reserve based loans (RBL) for upstream oil and gas transactions.
- The first part of the page works through some fundamental allocation issues for oil fields with production curves.
- The second part production sharing agreements including cost recovery, alternative profit sharing arrangements, revenue to cost ratio and sliding scale schemes.
- The third part of the the page works through reserve based lending agreements including computation of the borrowing base, covenants for remaining life and other elements of a term sheet. For the reserve based agreements you should understand how the borrowing base works from cash flow analysis and reserve reports.
The first files that you can review are a couple of power point slides that I prepared when I tried to teach a course on this subject. The first power point slide works through how cost recovery, royalties, income taxes and other features in production sharing agreements.
Power Point Slides Where I Try to Explain Some Points About Production Sharing Agreement Features
The second power point slide works through aspects of reserve based loans. This set of slides works through a term sheet with calculation of the borrowing base and changes in the borrowing base that causes repayment. The slides also demonstrate how the loans are sized with the Field Life Coverage Ratio and the Loan Life Coverage Ratio. The field life coverage ratio is like a project life coverage ratio. You need a forecast of cash flows. You take the present value of these cash flows and then compare the present value of the future cash flows to the amount of the debt. The big thing is that the present value of cash flows comes from reserve reports. Hence the name reserve based loans.
The Field Life Coverage ratio can be through of as the inverse of a loan to value ratio. If the Field Life Ratio is 1.5 then 1/1.5 = 66%. Then you compute the size of the loan from the reserve report which measures the present value of the reserves. The prepayment of the loan from the borrowing base is like a cash flow sweep with specific criteria.
I have made a couple of videos on reserve based loans. The first video works through allocations from production sharing agreements. If you want to get more information please send me and email at edwardbodmer@gmail.com.
[wonderplugin_video iframe=”https://youtu.be/z0V34YYD_lA” videowidth=600 videoheight=400 keepaspectratio=1 videocss=”position:relative;display:block;background-color:#000;overflow:hidden;max-width:100%;margin:0 auto;” playbutton=”https://edbodmer.com/wp-content/plugins/wonderplugin-video-embed/engine/playvideo-64-64-0.png”]
This is a video about reserve based lending (RBL). It uses the upstream oil model discussed in the above video and then adds financing to the model. It works through a model with computation of borrowing base from the present value of cash flows that come from reserve reports and how to construct a cash flow waterfall with cash flow sweeps.
[wonderplugin_video iframe=”https://www.youtube.com/watch?v=x1zGYhBc25E” videowidth=600 videoheight=400 keepaspectratio=1 videocss=”position:relative;display:block;background-color:#000;overflow:hidden;max-width:100%;margin:0 auto;” playbutton=”https://edbodmer.com/wp-content/plugins/wonderplugin-video-embed/engine/playvideo-64-64-0.png”]
Reserve Based Loans
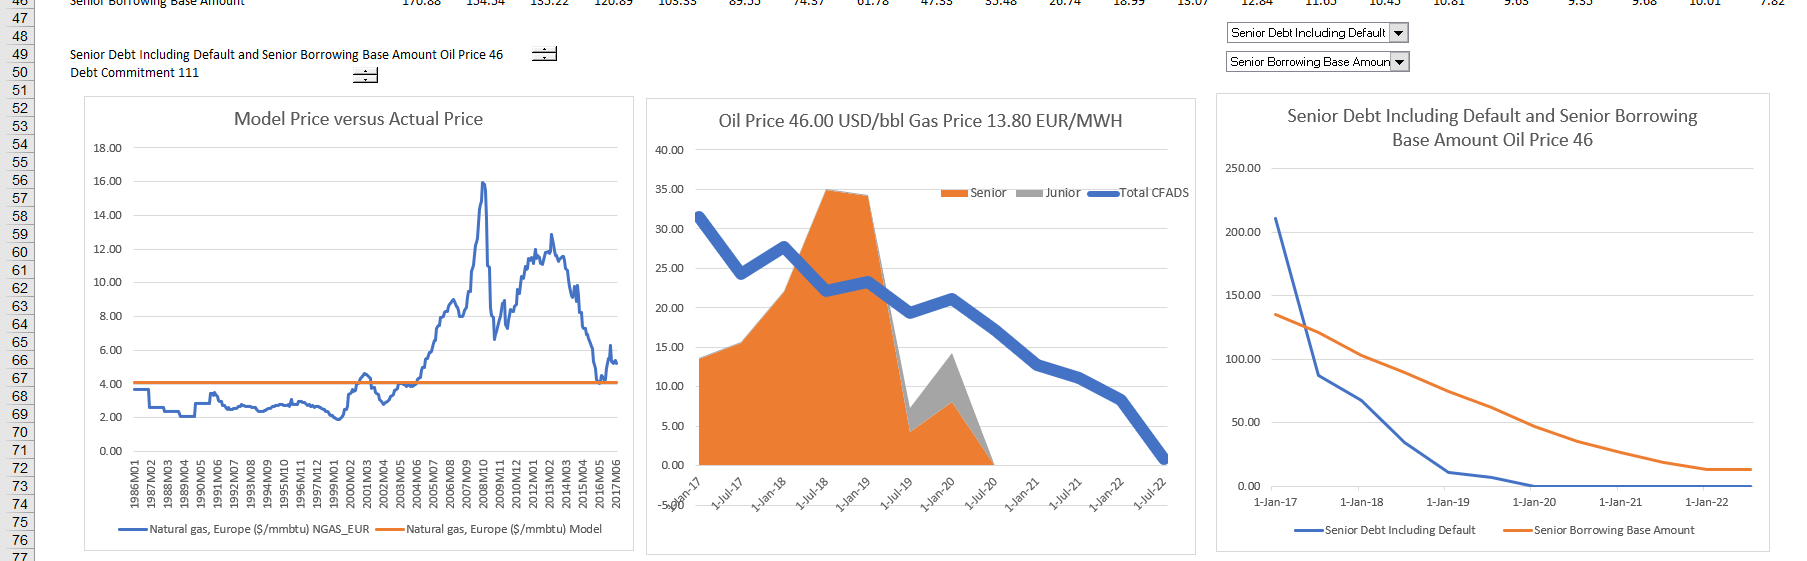
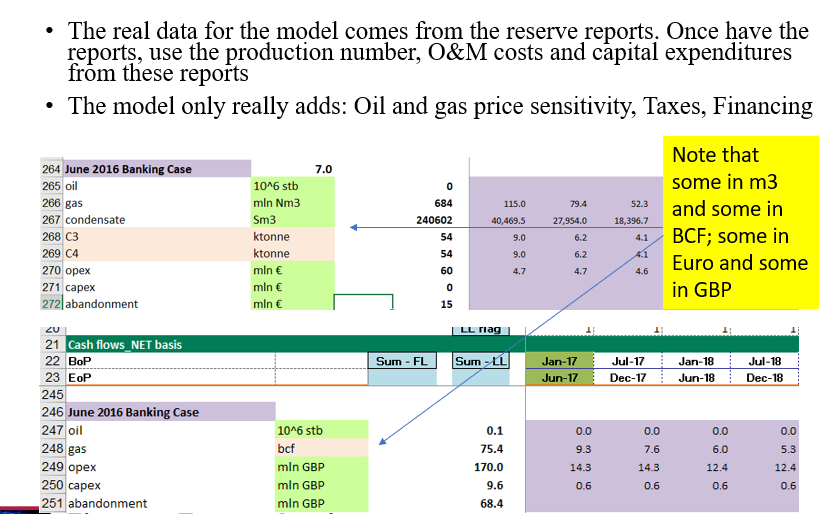
The first slide illustrates how you can illustrate the effects of different oil prices in the context of different oil prices.
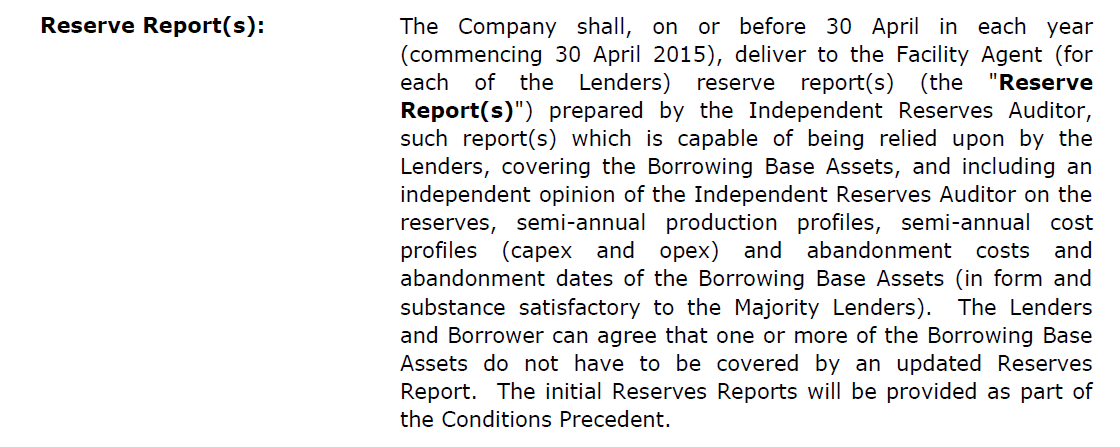
The first excerpt illustrates the requirements for reserve reports with drive the size of the borrowing base.
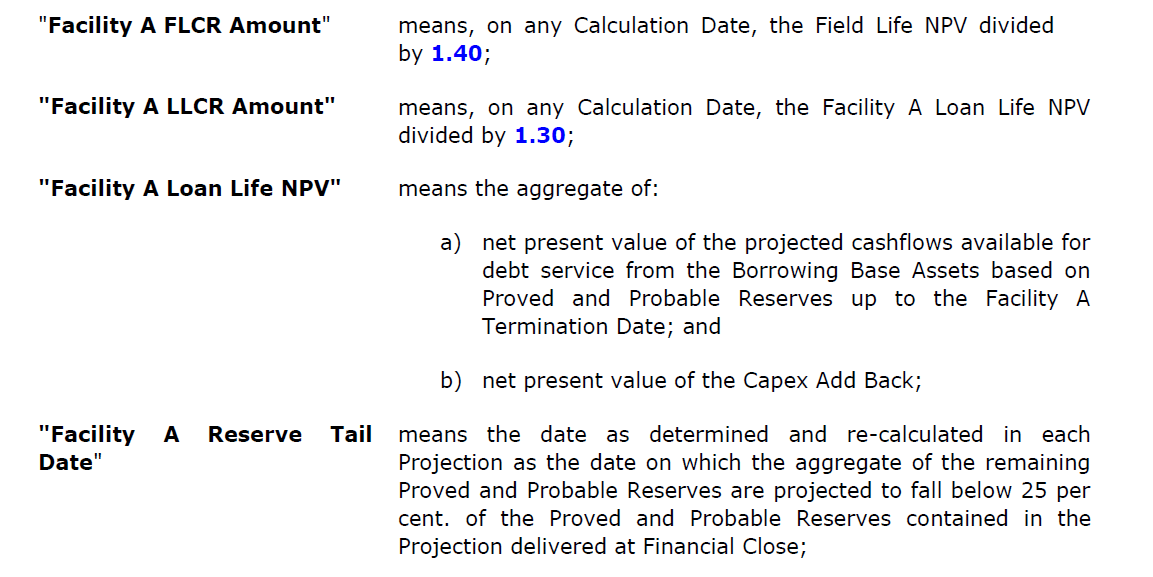
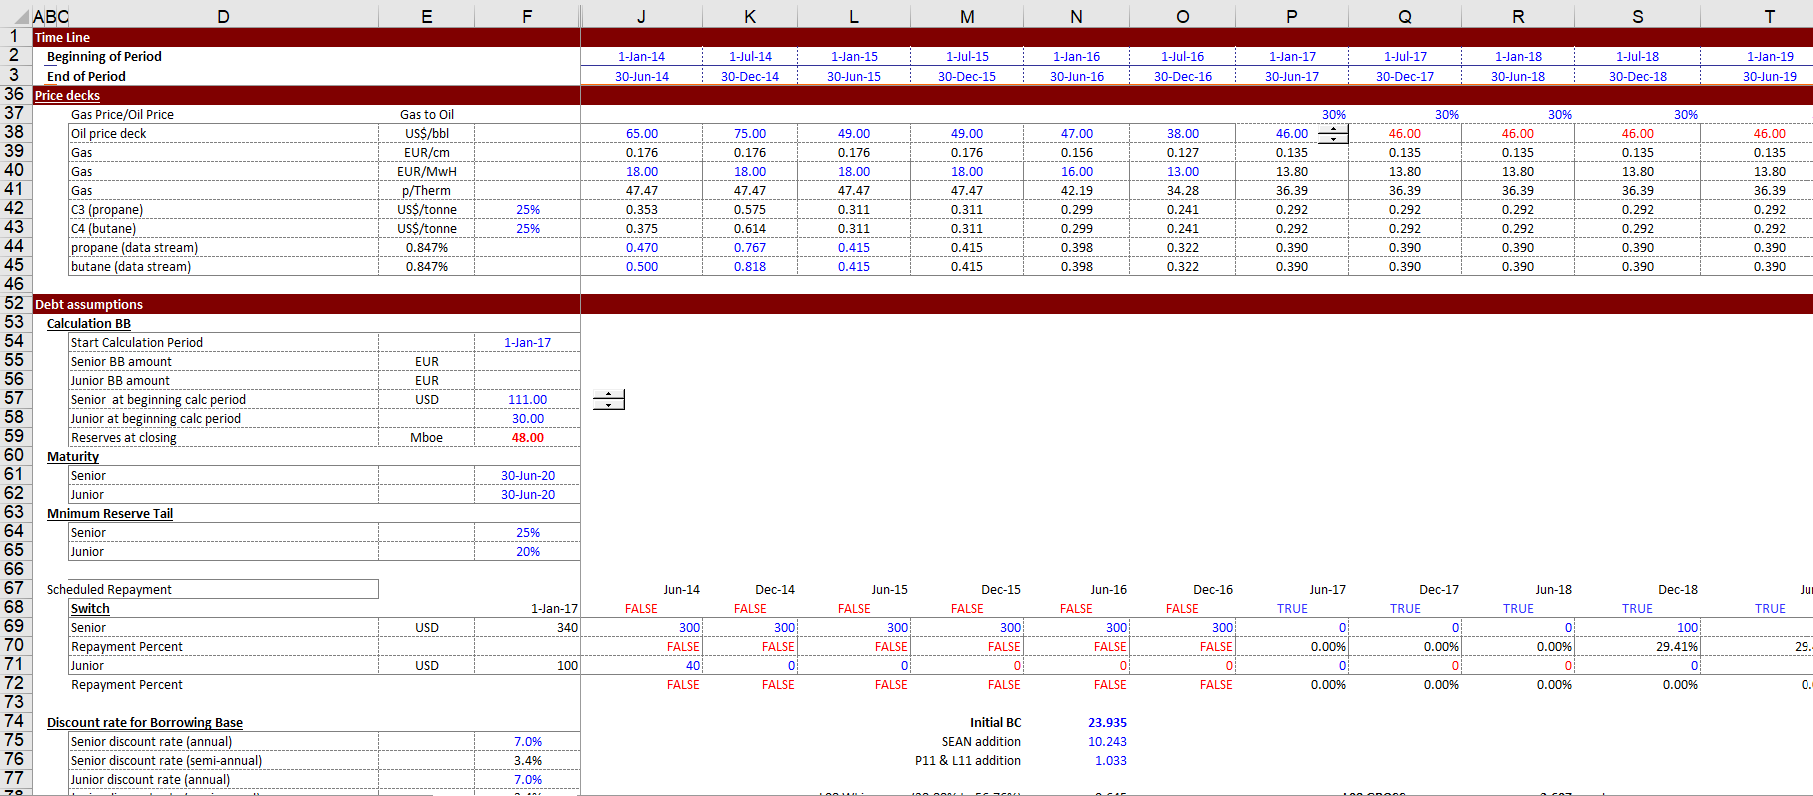
Here are some examples of essential drivers of a reserved based loan. First here are the debt sizing drivers. To measure this, you need to have a discount rate which is the discount rate used in the reserve report. It is generally around 10% which undervalues the value of the reserves and it means that the FLCR is not like a typical PLCR.
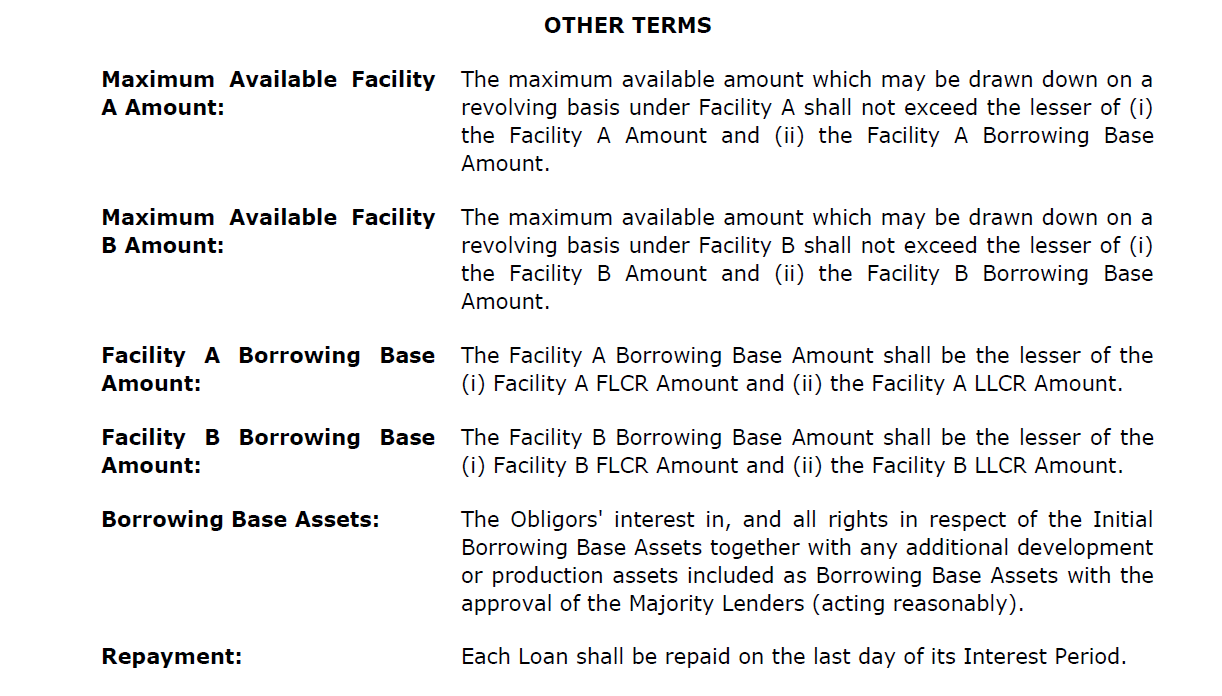
The next screenshot illustrates the definition and the use of the borrowing base. This shows the borrowing base is used for the availability and also the repayment.
The next screenshot below illustrates the financing assumptions for the reserve based loans.
The slide below illustrates use of the borrowing base. It illustrates how to compute the basis for the cash flow sweep and then put the cash flow sweep in the loan balance.
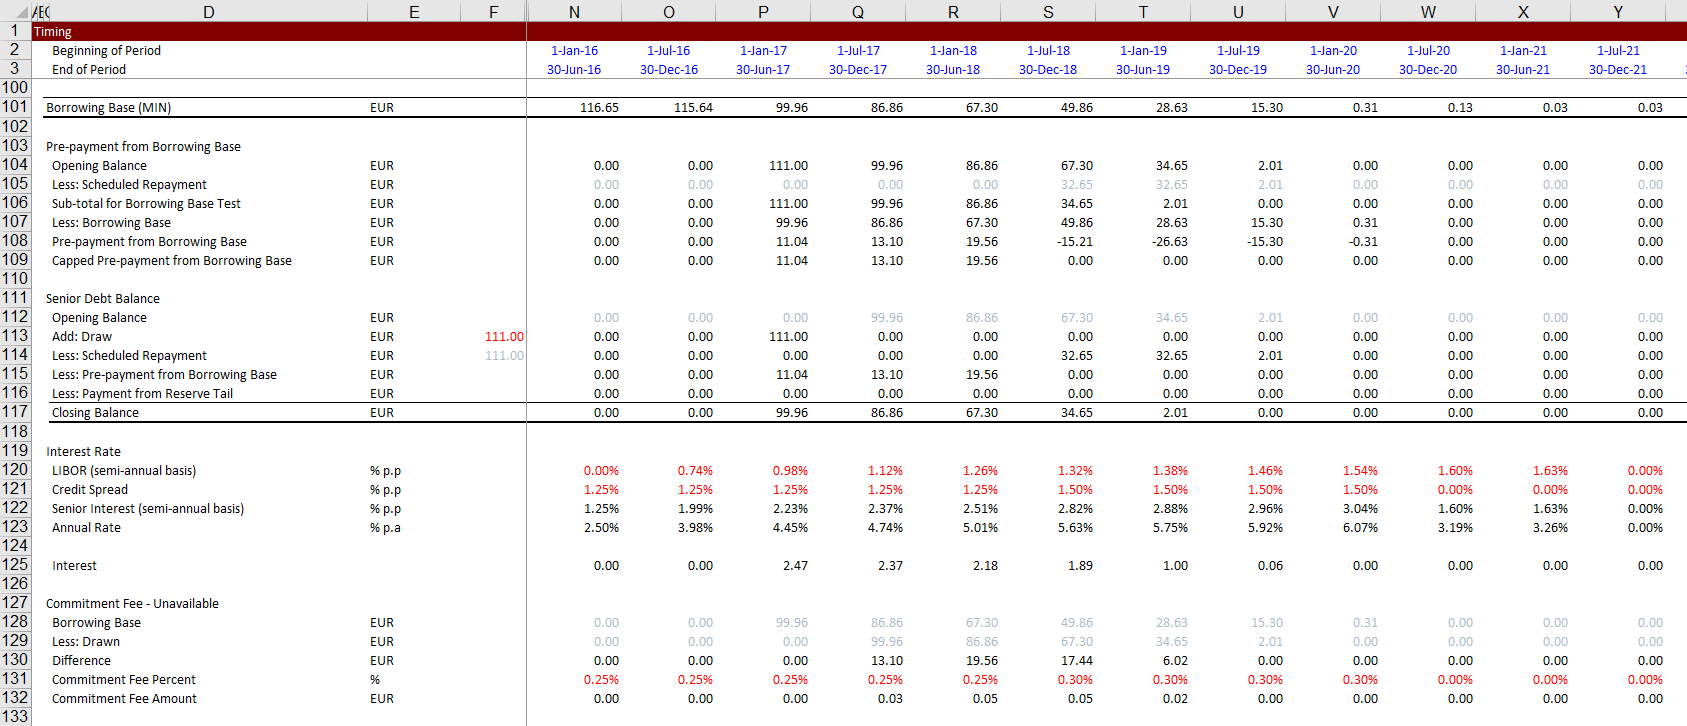
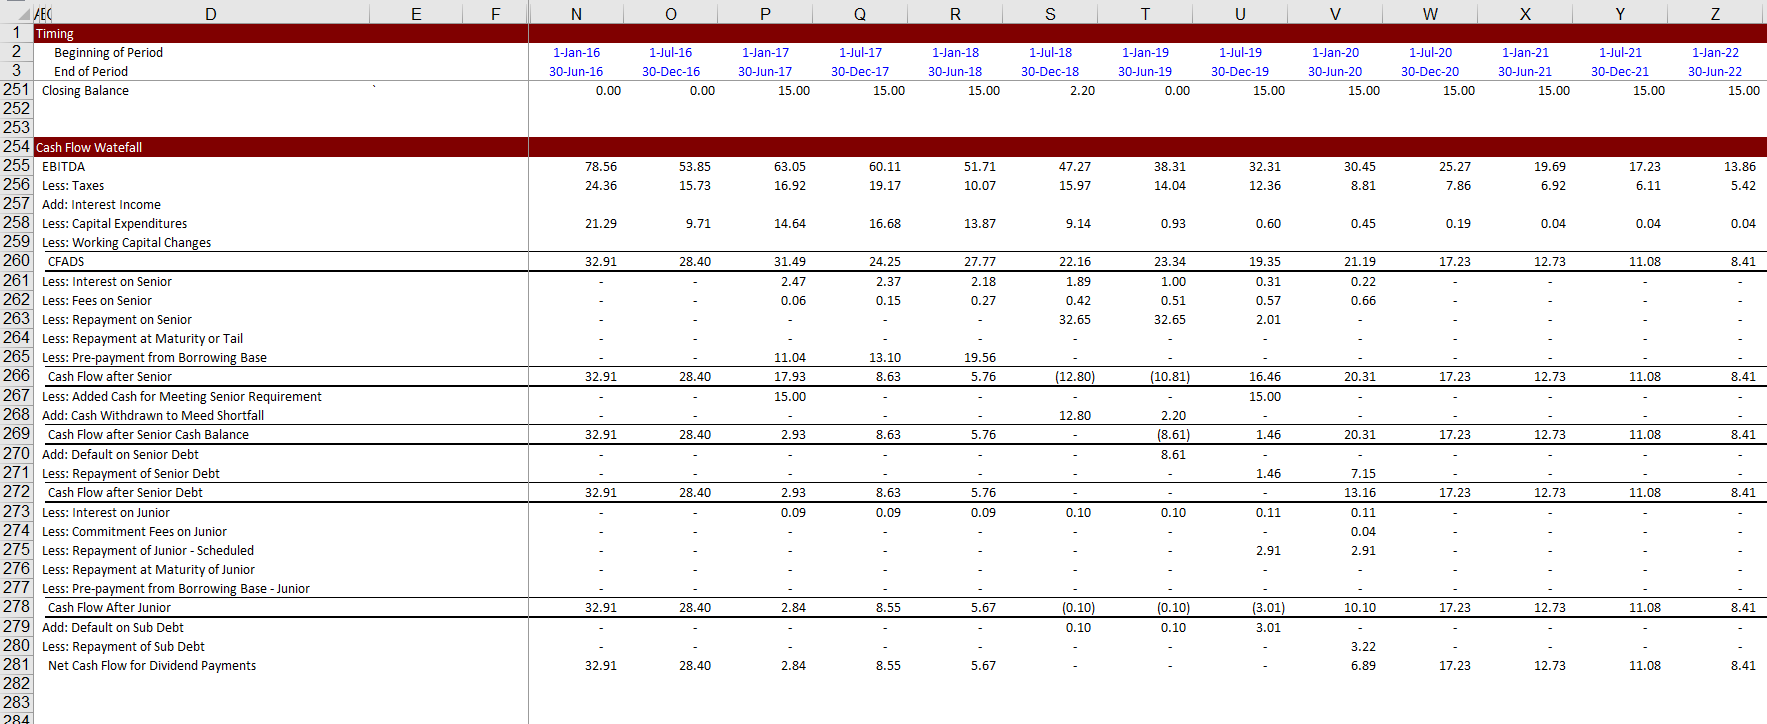
The next screenshot illustrates a cash flow waterfall where the prepayment from decline in the borrowing base is shown. With the cash flow waterfall you can demonstrate the effects of changes in the oil price.
•These reserve categories are totaled up by the measures 1P, 2P, and 3P, which are inclusive of all reserves types:
•1P reserves = proven reserves (both proved developed reserves + proved undeveloped reserves).
•2P reserves = 1P (proven reserves) + probable reserves, hence “proved AND probable.”
•3P reserves = the sum of 2P (proven reserves + probable reserves) + possible reserves, all 3Ps “proven AND probable AND possible.“
•A reserve is considered a proven reserve if it is probable that 90% or more of the resource is recoverable while being economically profitable.
•Objectives in Using Model:
•Measure the sensitivity to oil and gas prices
•Measure the sensitivity to errors in production and resources as measured in reserve reports
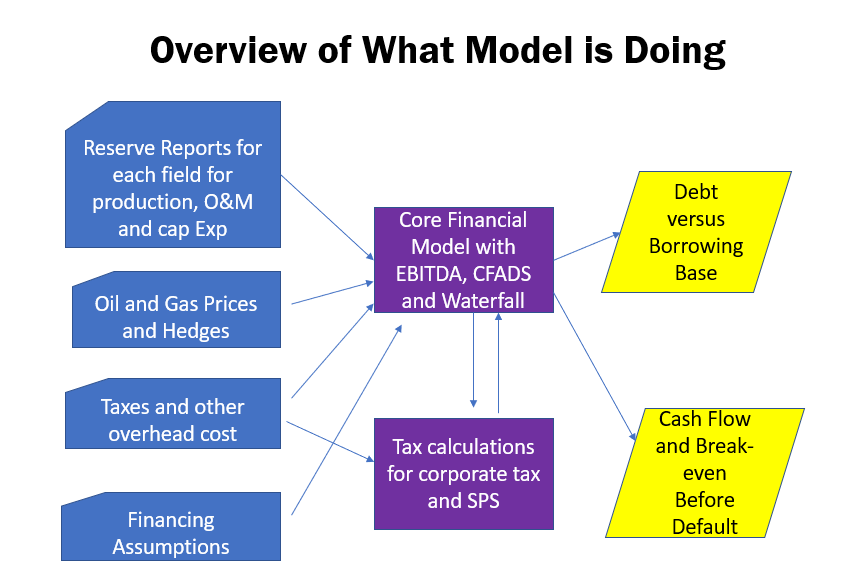
•Evaluate the cost of production with and without the cost of debt service to understand competitive position
•Demonstrate mechanics and risk reduction from borrowing base pre-payments as well as LLCR and FLCR tests
•Illustrate wash flow waterfall and relative risk and break-even points from senior and subordinated debt