In this page I explain how the Weighted Average ROI is computed and its advantages relative to the MIRR or the unadjusted IRR as a measure value. This WROI is an important concept in asset management because it allows you to measure performance on a period by period basis. The Weighted Average ROI (WROI) gives a single statistic that allows management to quickly gauge the return on a project, but it does not have the re-investment assumption problems of the IRR or the distortions that make the MIRR irrelevant. To compute the WROI, compute the ROI (ROE or ROIC) on a period by period basis. Second, compute the present value of each investment in the denominator of the ROI calculation and use this number as a weighting factor (the PV of investment divided by the total of all of the PV of investments). Third, compute the weighted average with the SUMPRODUCT function where you multiply the ROI by the weighting factor. Using the WROI, income can be calculated as the weighted ROI multiplied by the nominal investment value over the investment period. The income from this calculation is added to depreciation resulting resulting in cash flow that would result from a constant ROI. If the cash flow from this constant ROI is discounted at the same rate as used in the weighted average ROI calculation, the valuation result is the same as the standard NPV calculation. This means if you would rank different investments using the weighted ROIC, the ranking would be the same as the ranking from the NPV technique. This file includes the examples used in this webpage to illustrate various valuation issues.
Mechanics of Computing Weighted Average ROI
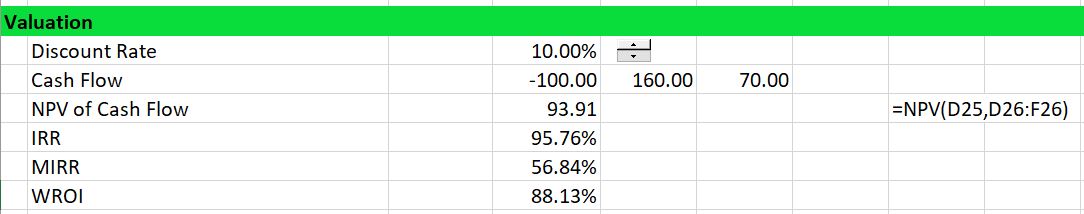
The process of computing income from the weighted average ROI is illustrated in the two screenshots below. In the first screenshot below, the present value of the cash flow is demonstrated along with the results of the IRR and the WROI. Because the IRR of 95.8% is above the discount rate, the WROI is below the IRR. When the discount rate, the reverse is true and the WROI is higher than the discount rate. Using a 10% discount rate, the net present value is 93.91.
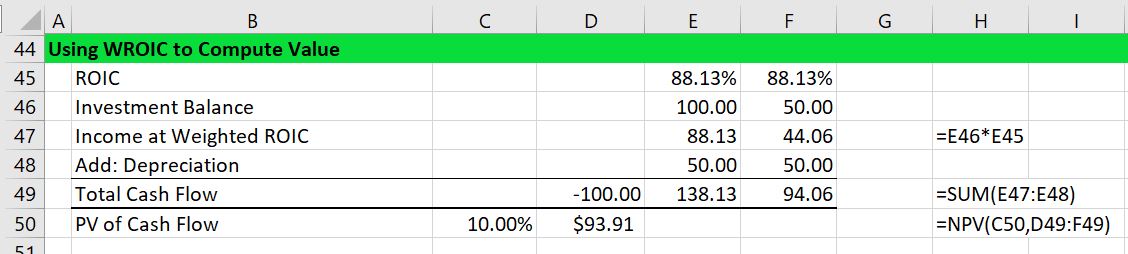
The second screenshot below demonstrates how the weighted average ROI produces results consistent with the net present value ranking. It also demonstrates that the weighted average ROI is consistent with a normal ROI that is the basis for a lot of corporate finance. In this case, the income at the weighted average ROIC is computed from the investment balance as shown in row 47. The weighted average ROI of 88.13% is multiplied by the investment balance to compute hypothetical income. The income is 88.13 in the first year (88.13% x 1000) and 44.07 in the second year (88.13% x 500). This income is added to depreciation of 50 to arrive at hypothetical cash flow. The cash flow is different from the original cash flow, but when discounted it produces the same value of 93.91 as discounting the original cash flow.
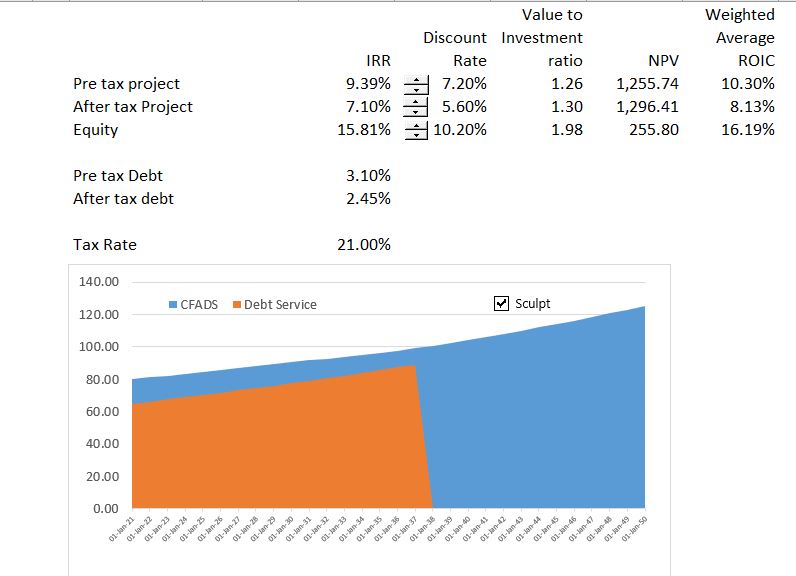
The screenshot below demonstrates the IRR and alternative methods. Note that in this case, the weighted average ROIC is higher than the IRR as the IRR is higher than the discount rate. You can try with different discount rates and see that the weighted average ROIC is the same as the IRR when the discount rate is the same as the IRR.
Ranking of Investments with WROI
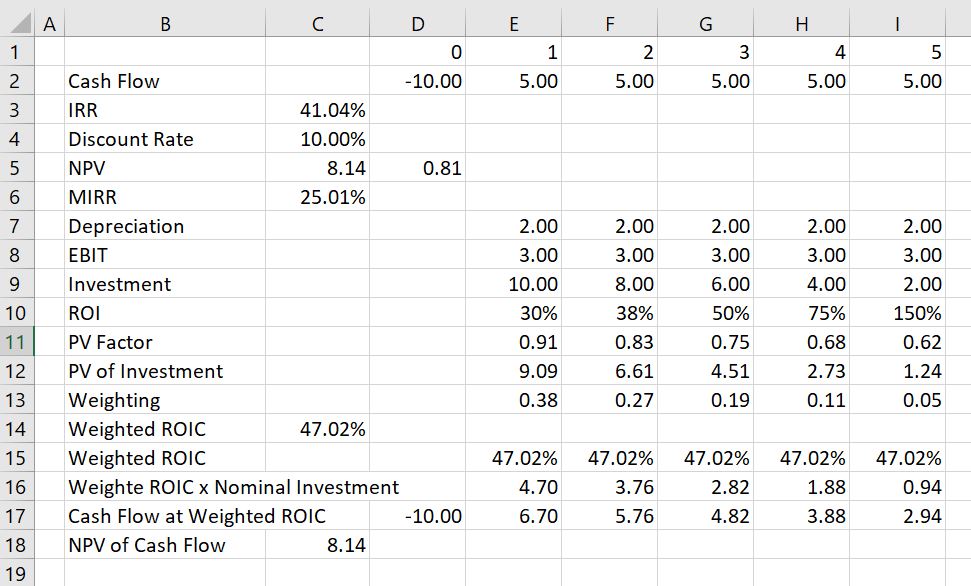
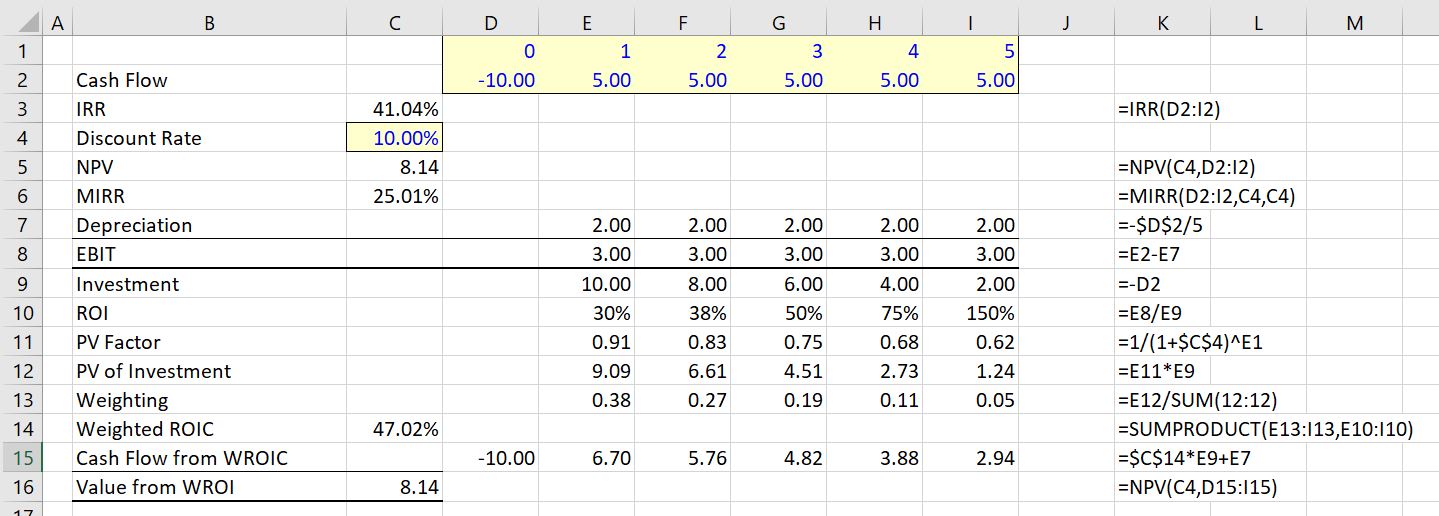
To illustrate how the IRR can distort ranking of investments begin with the example used in the McKinsey article. This case has an outlflow of 10 followed by positive 5 cash flow for 5 years. This cash flow produces an IRR of 41.04%. With a discount rate of 10%, the MIRR is 25.01% and the weighted average ROI is 47.02%. The reconciliation of the NPV of 8.14 is confirmed with the NPV from the weighted ROI in the screenshot below.
Next consider a case where there are no middle year cash flows and the final cash flow in period is 50. The cash flow of 50 is much more than the 5 years of cash flow of 5 that adds up to 25. But because of timing, the unadjusted IRR is lower than the first case. The IRR is 37.97% as shown in the screenshot below. But when the NPV is computed at a discount rate of 10% the NPV of the investment is higher — it is 19.13 rather than 8.14. This is thus a classic case of different ranking for NPV and IRR. The first investment with 5 years and a cash flow of 5 has a better ranking from the IRR than the investment shown in the screenshot below. But the first investment above has a lower ranking than the investment shown below when the NPV is used. The correct decision would be to use NPV and take the second investment.
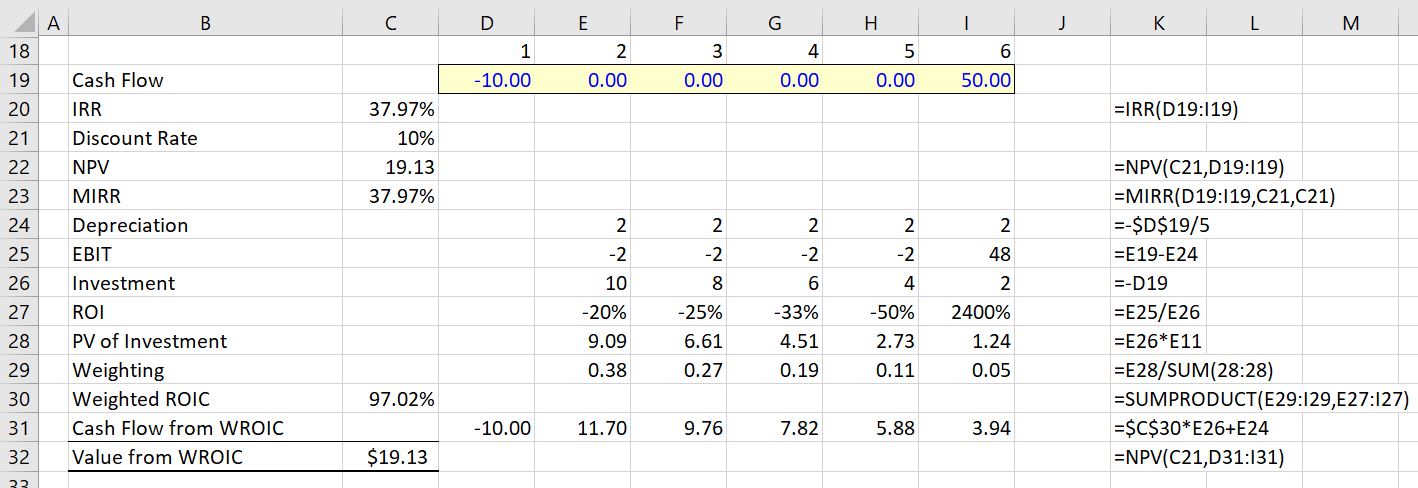
When looking at the above screenshot, you can see that MIRR of 25.01% is lower for investment 1 than for investment 2 where the MIRR is the same as the overall IRR of 37.97%. The MIRR is the same in the second case because there are no middle period cash flows. In the first case, the MIRR is lower than the IRR because the middle cash flow earns a lower return than the overall IRR. In terms of the WROI, the ranking is the same as the correct ranking where the second investment has a very high WROI. The MIRR of 25.01% for the first investment is lower than any of the ROI.
Case with Projects that have Different Lives Demonstrating Problems with MIRR
When investments with different lives are ranked, the MIRR falls apart as a statistic. On the other hand, the weighted average ROI continues to correctly value different projects. To illustrate this, compare the case with 5 years of 5 cash flow to a case with 10 years of 5 cash flow. If the investment is the same, it is pretty obvious that you would rather have the longer cash flow. But the MIRR gives a lower return to the longer cash flow because it compresses cash flows to the re-investment rate. The longer term cash flow project would be ranked lower than the project with shorter cash flow.
To illustrate this case, return first to the 5-year case. This is a repeat of the screenshot above with an IRR of 41.04% with an MIRR of 25.01% and a weighted ROIC of 47.02%. The NPV of the investment is 8.14.
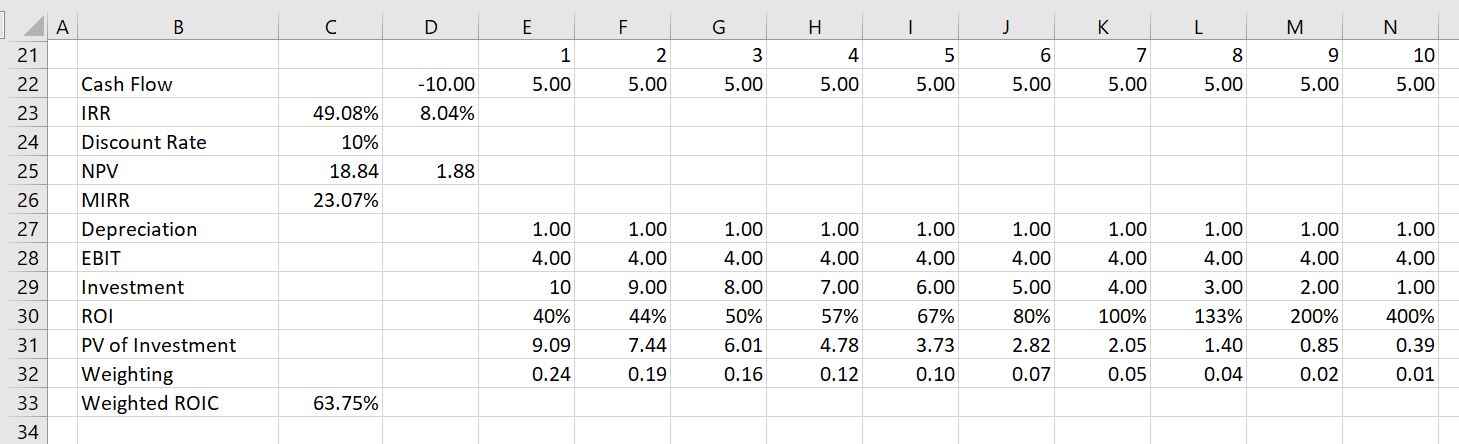
In the second case where the cash flows are simply extended, the IRR increases to 49.08% (not too much) and the MIRR declines from 25.01% to 23.07%. The NPV of the investment more than doubles from 8.14 to 18.84. Thus, the MIRR would actually suggest that the investment below is worse than the investment with only 5 years of cash flow. The MIRR is not consistent with the NPV. The NPV is B.S.
On the other hand, the WROI increases dramatically as did the NPV. It increases from 47.04% to 63.75%.
Videos that Describe WROI as an Alternative to MIRR or IRR
The three videos below describe the problems with IRR when you have middle period cash flow. It is demonstrated that a weighted average return solves problems with the IRR in terms of measuring growth and ranking investments.
[wonderplugin_video iframe=”https://www.youtube.com/watch?v=mjlNTAP8rbo&t=120s” videowidth=600 videoheight=400 keepaspectratio=1 videocss=”position:relative;display:block;background-color:#000;overflow:hidden;max-width:100%;margin:0 auto;” playbutton=”https://edbodmer.com/wp-content/plugins/wonderplugin-video-embed/engine/playvideo-64-64-0.png”]
[wonderplugin_video iframe=”https://www.youtube.com/watch?v=4Npyc2K40Vk&t=5s” videowidth=600 videoheight=400 keepaspectratio=1 videocss=”position:relative;display:block;background-color:#000;overflow:hidden;max-width:100%;margin:0 auto;” playbutton=”https://edbodmer.com/wp-content/plugins/wonderplugin-video-embed/engine/playvideo-64-64-0.png”]
[wonderplugin_video iframe=”https://www.youtube.com/watch?v=YwwNgFuhgn0&t=26s” videowidth=600 videoheight=400 keepaspectratio=1 videocss=”position:relative;display:block;background-color:#000;overflow:hidden;max-width:100%;margin:0 auto;” playbutton=”https://edbodmer.com/wp-content/plugins/wonderplugin-video-embed/engine/playvideo-64-64-0.png”]