This webpage discusses how to use the price to book ratio to evaluate the the cost of capital as a real alternative to the CAPM. The general and simple idea is that if you know the value of a company or an investment and if you also know the value of a company, you can derive the cost of capital. Think of a case where for some reason the cash flow is constant and will stay constant in terms of expected value. The value is NPV at cost of capital of the cash flow or cash flow/cost of capital. Or, the formula can be written as value = cash flow/cost of capital or alternatively cost of capital = cash flow/value. You can also go further and understand that if cash flow is return x investment then the formula is value = the NPV of the return x investment at the cost of capital. In this case the value = return x investment/cost of capital or cost of captial = return x investment/value. If the investment is equal to the market value, the return equals the cost of capital. You can get much more advanced and detailed with this general idea. I demonstrate how you can use the formula P/B = (1-ROE)/(1-Cost of Capital) to derive the cost of capital and how to consider situations were growth and cost of capital change. I also show how you can create a regression analysis of price demonstrates that you can use creative alternatives to the CAPM through making a regression analysis of market to book ratios and deriving the cost of capital from P/E ratios or EV/NOPAT ratios. I go a little crazy when finance professors make very general statements about the cost of capital being computed from financial ratios without any discussion of how this can be implemented in practice. In this page I hope to allow you to see how it can really be done. There are a couple of files that will be used in my explanation. These are attached to the buttons below.
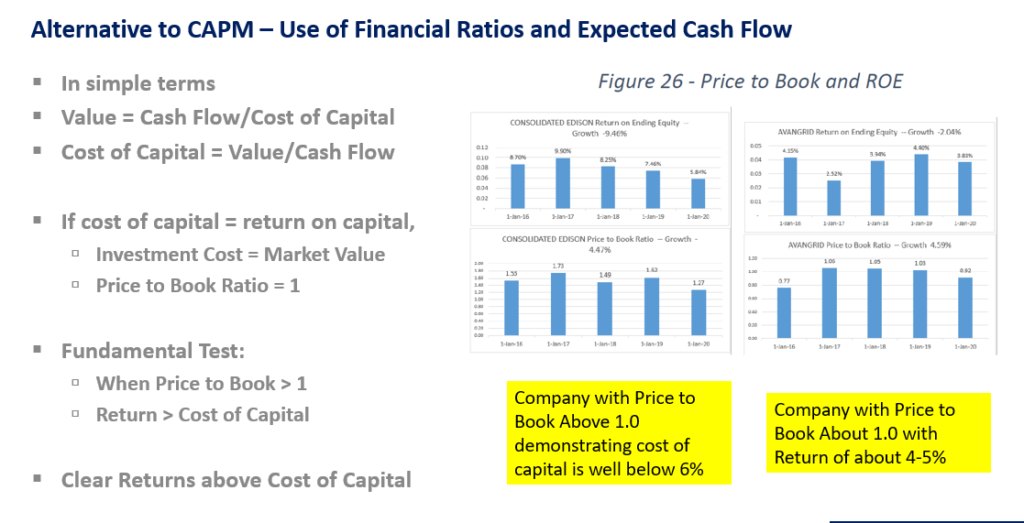
The general notion of deriving the cost of capital from stock market valuation and cash flow estimates is founded on the idea that the value of any investment can be expressed as a cash flow forecast discounted by the cost of capital. This is illustrated in a very simple manner in the equation below (I write a few equations in this section, but I attempt to make them as simple as I possibly can). In writing the equation you could assume the cash flow occurs for an indefinite period and write infinity. I have written 1000 which in terms of present value is the same as infinity.
Value = Cash Flow1/(1+Discount Rate) + Cash Flow2/(1+Discount Rate)
+ … Cash Flow1000/(1+Discount Rate)
This equation can be simplified to the following if the cash flow is the same each period. In finance this is called an annuity.
Value = Cash Flow1/Discount Rate
The idea behind this equation is the basis of deriving the implied discount rate from the value and the cash flow. By re-arranging the equation, you can derive the discount rate from the value divided by the cash flow. Note that behind deriving the cost of capital in this manner is that you must make some kind of cash flow forecast. The central question in using implied cash flow instead of the CAPM is whether you can make a more reasonable forecast of growth rate in cash flow or whether the CAPM inputs – EMRP, Beta and Country Risk Premium – are more reasonable to forecast.
When the cash flow model to derive cost of capital was originally applied in regulatory proceedings, it used a constant growth rate formula. In 1956 a finance professor named Myron J. Gordon (who wrote testimony in support of increasing the cost of capital for utility companies) used the basic fact from integral calculus that if there is constant growth in cash flow, the value formula becomes:
Value = Cash Flow1/(Discount Rate – Constant Growth)
If the cash flow used in this formula is dividend payments on a stock and the formula is re-arranged, then the discount rate or the implied cost of capital can be expressed as the forward dividend yield and the growth rate. This is illustrated in simple formulas below:
Stock Value = Dividend per Share1/(Cost of Capital – Constant Growth)
Cost of Capital = Dividend per Share1/Stock Value + Constant Growth
This formula as caused a lot of debate in regulatory proceedings as the estimate of constant growth drives the estimate of the cost of capital. A higher growth rate yields a higher cost of capital estimate. When making growth rate forecasts, consultants typically debate whether the growth rate in dividends should be forecast from estimates made by industry analysts or whether a constant growth formula (discussed below) should be used. This debate involves whether published estimates of growth rate are optimistic and whether the dividends relative to the earnings remain constant. In one of the databases provided to NEPRA associated with this project I provide estimates of growth for US utility companies. This database is documented in Appendix 6.
The set of videos is supposed to suggest practical alternatives even though regression analysis of price to book ratios is presented and statistical analysis of beta is discussed. The videos and files generally demonstrate that CAPM overstates the cost of capital. In addition, the corrected value driver formula is used to evaluate the cost of capital. The lesson includes two files that illustrate the theory of coming up with cost of capital from the P/E formula and the P/B formula and also a database to compute the cost of capital using a lot of different methods. Both the data analysis and the theory are quite advanced and not consistent with traditional methods to evaluate the cost of capital.
| Cost of Capital Subject | File Reference | Video Link | ||
| Cost of Captial Database Introduction | Dow 30 Companies | https://www.youtube.com/watch?v=MOpSVBstv4o | ||
| Cost of Capital Sensitivity Analysis Using the P/E Ratio Formula | Price to Earnings Analysis | https://www.youtube.com/watch?v=A5FoWknb0HM | ||
| P/E Cost of Capital and Scenario Reporter | Scenario reporter | https://www.youtube.com/watch?v=j5DOUe6Wqbk | ||
| P/E ratio and Cost of Capital with Transition and Interpolation (Number 6) | Interpolate and Lookup | https://www.youtube.com/watch?v=XLVqKfvmjCM | ||
| P/B Regression Simulations for the Cost of Capital (Number 5) | Price to Book | https://www.youtube.com/watch?v=bhYlYSSWDVw | ||
| P/B Formulas and Cost of Capital | Price to Book | https://www.youtube.com/watch?v=s2NdJs8Su44 | ||
| Demonstration of Problems with CAPM | Beer Companies Database | https://www.youtube.com/watch?v=PL0zOQe-_6c | ||
| Collecting Data with Ticker Symbols | Cost of Captial Database | https://www.youtube.com/watch?v=MTskVI_VERk | ||
| Building Cost of Capital Data with Indirect Function | Cost of Captial Database | https://www.youtube.com/watch?v=UBl_pAvxhbs | ||
| Problems with Beta and Measuring Cost of Capital | Renewable Stock Price | https://www.youtube.com/watch?v=eTDjLjZo9cE | ||
| Use of Market P/E Ratio to Derive Cost of Capital | Economy Wide Cost of Capital | https://www.youtube.com/watch?v=GAolSYR1-pc | ||
| DCF Model for Deriving Cost of Capital | Integrated Electricity Model | https://www.youtube.com/watch?v=9rsxSVDbjxE | ||
| ……………………………………………………………………………………………………………………………. | … | ……………………………………………………………. | … | ………………………………………………………………………………………… |
Files Used in Advanced Valuation Concepts Lesson Set 1: Using Methods other than CAPM to Estimate the Cost of Capital
There are two general sets of files associated with the cost of capital analysis. The first set of files in the cost of capital set work through the theory of valuation and alternatives to the CAPM.
The second set of files show how the models work with real market data. The set of files and videos below include both development of spreadsheets that measure the theory and explanation of how to construct comprehensive financial ratio databases that can be automatically uploaded to evaluate cost of capital.
Deriving the cost of capital from the P/E ratio requires a lot of assumptions about long-term ROE versus cost of capital, long-term growth, inflation rates and transition periods. The P/E ratio files and videos use alternative scenario analyses to demonstrate the difficulty. The P/E Analysis file below evaluates the cost of capital with sensitivity and scenario analysis. It demonstrates how to correct the value driver formula P/E = (1-g/ROE)/(k-g) for inflation and changing returns.
Price to Earnings Analysis.xlsm
Cost of Capital and PE formula.xlsm
Price to Book Analysis.xlsm
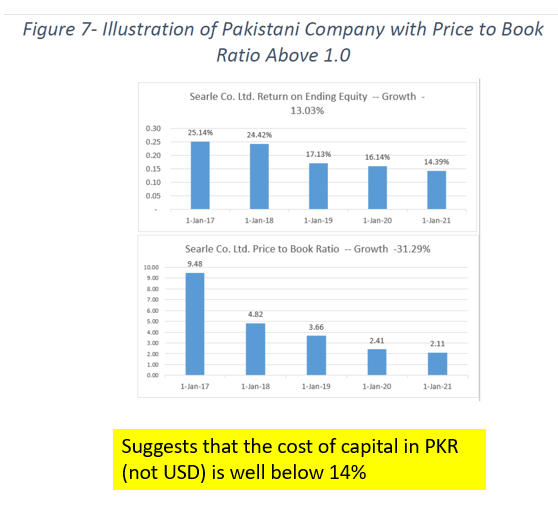
This files below evaluates the price to book ratio analysis with regression analysis and shows how to develop the formula: PB = (ROE-g)/(k-g). It shows how you can use the market to book ratio to compute cost of capital and it demonstrates how a regression equation for the market to book ratio can be used to evaluate the cost of capital. If the CAPM is a biased and flawed model, bizarre attempts to adjust the cost of capital for country risk resulting in premiums as much as 11% for some countries. These CAPM derived premiums published by a man named Mr. Damoradan and frequently used have to imply that the real cost of all sorts of products ranging from houses to electricity can be as much as double for so-called risky countries.
1. Dow Stocks.xlsm
3. Utility Companies.xlsm
1. Beer Companies.xlsm
The database evaluates historic market to book ratios relative to projected return on equity to evaluate cost of capital. In addition PE ratios and published growth estimates are used along with assumed transition rates to back into the cost of capital. The CAPM is also computed along with the dividend discount model. The next set of videos explain the theory behind using the market to book ratio and the P/E ratio using simulation and sensitivity analysis. The final set of videos in the set explain details of how to build the data base.