This page demonstrates how to model the cost of home solar power systems with batteries and compares the cost of solar and battery systems with kerosene lamps. Battery and solar analysis is developed through a sources and uses of energy. The battery and storage analysis is made using varying solar power shapes and demand curves. To make this economic comparison I have created a database of the cost and electricity output from a variety of home solar systems and then applied different financing and operating life assumptions. The solar costs are computed on an annualised or levelised basis and compared to kerosene lamps that produce a similar amount of energy or light. The files that are attached to the buttons below contain analysis of the light produced from kerosene lamps (in lumens) relative to the amount of energy input.
The first part of the home solar power system analysis assumes that all of the output from the battery storage can be used (ignoring the available solar power) and the energy from storage discharged from the battery is compared to equivalent amount of energy that is used in the kerosene applications. Once the comparison using available storage is established I have made a second section that applies different financing methods to the home solar power systems. The third part of the solar home power systems analysis versus the kerosene analysis includes analysis of the sources and uses of energy to evaluate whether the battery capacity can be used from available solar energy during a day. This analysis is made assuming a given daily pattern of solar power and evaluates how much energy is usable with different demand patterns and limits of battery capacity. The final part of the solar home addresses the variation in solar power for different days and different seasons and how this variation in solar loads combined with operation of the battery affects the cost. The excel file with the solar home power system databases and the dispatch model is attached to the button below.
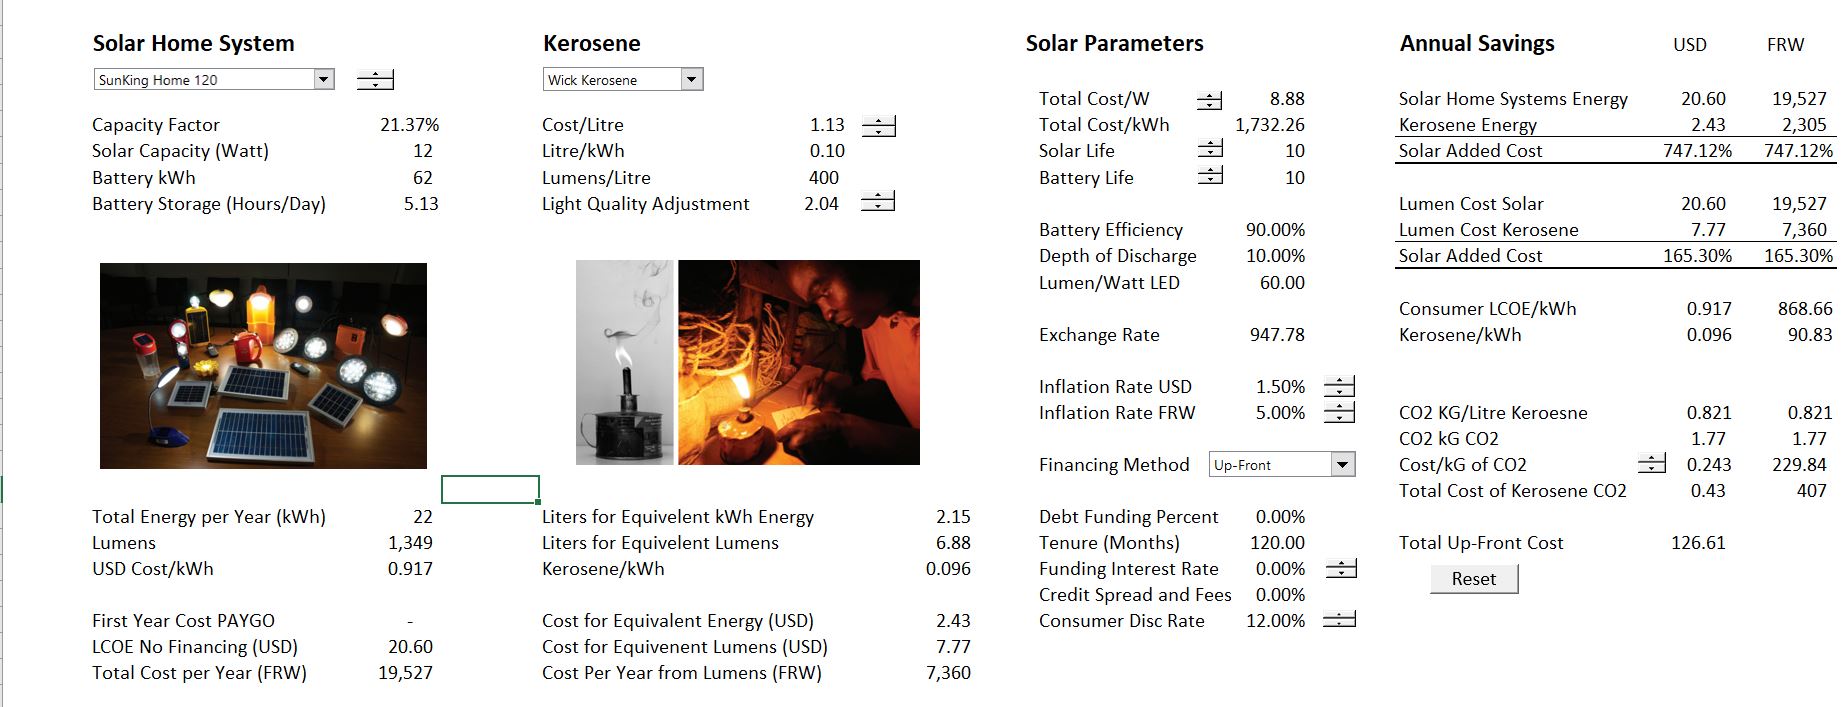
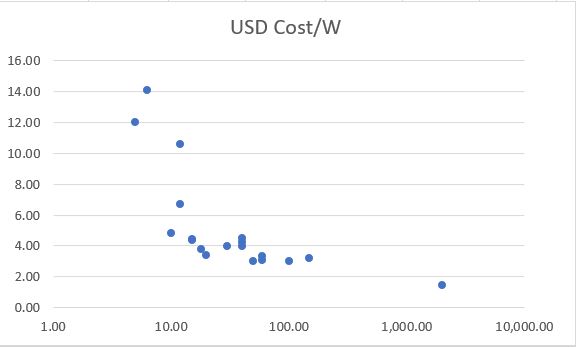
The two diagrams below demonstrate results of the analysis for extreme cases. The first case demonstrates that with a very small system of only 12 watts and a cost of almost 9 USD/watt that the cost of the home system is much more than the cost of kerosene. This is either when the comparison is made on the basis of energy or on the basis of light quality. The second diagram shows results from the model using a larger system with a much smaller cost as well as lower cost financing. This scenario with a much lower cost per kW and cost per kWh demonstrates savings on an energy basis or on a quality of light basis.

This page also includes a database that includes estimates of the capital cost per kW and per cycle (kWh) as well as estimates of operation and maintenance and efficiency of batteries. In this database I have included battery life, replacement cost and decommissioning cost. Some of these parameters like degradation, lifetime, intermediate capital expenditures and cost of capital are drivers of the carrying charge rates. Other parameters such as the up-front cost, the O&M cost and the efficiency are directly included in cost/benefit analysis. This database is now out of date, but I have left it in to demonstrate how you can create a database from Lazard data.
Battery and Solar Analysis for a System that Produces Enough Electricity for one LED Light and Phone Charging
When comparing kerosene with solar plus battery, we are comparing a dispatchable technology — lamps that you can turn on and off whenever you want — to a non-dispatchable technology (solar) that is supported by batteries. Whether this is for a big system, a microgrid or a big system, the analysis of a solar and battery combination must account for the charging and discharging of batteries as well as the amount of solar power that is available.
The analysis may seem very simple — how many hours of light do you get in terms of kWh and what is the cost of the similar amount of energy produced with kerosene. But even for such a simple case you need to measure the capital cost, come up with a carrying charge rate, evaluate inflation, consider the amount of solar energy in different seasons and different places, consider battery parameters and quantify other factors. So, lets do some of this.
I begin the kerosene versus home solar systems with battery by reviewing the costs and characteristics of different solar combined with battery systems.
This system only has one light and is able to also charge a cell phone. Lets say we are computing the cost of this system and comparing it to the cost of lighting with Kerosene.
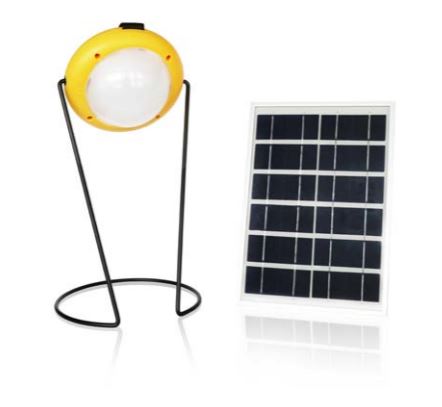
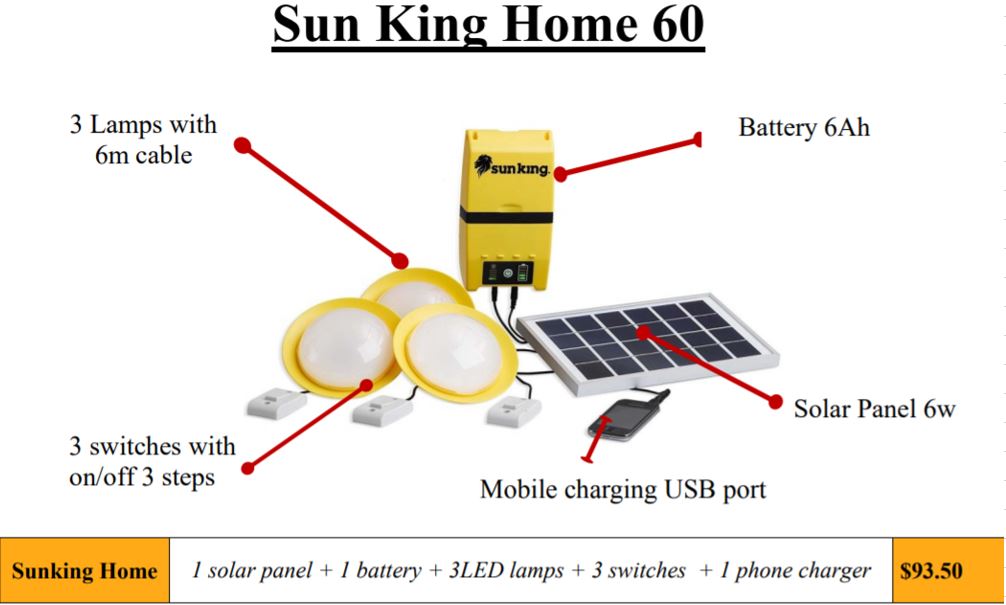
The first step in analysis of the comparative costs of a battery and solar system versus a kerosene system is gathering data on the cost characteristics of the home system product. The diagram below illustrates the simplest case of a solar panel and a simple lamp that . The cost of this system is about USD 60 and the panel can theoretically produce 5 W (presumably at STC which means standard testing conditions and includes 1000 Watts of light). The second diagram below shows a similar system where the battery is shown with 6 Watts of solar power and 6 amp hours of current. The voltage (the electrons flow rate) is not shown on the picture, but if it flows at 3.3 volts, then the power that can be discharged by the battery is 6 x 3.3 or 19.8 watt hours. it includes a solar panel and a lamp with a battery a shown in the diagram above. This system is quoted to have a capacity of 6 Watts of solar power and
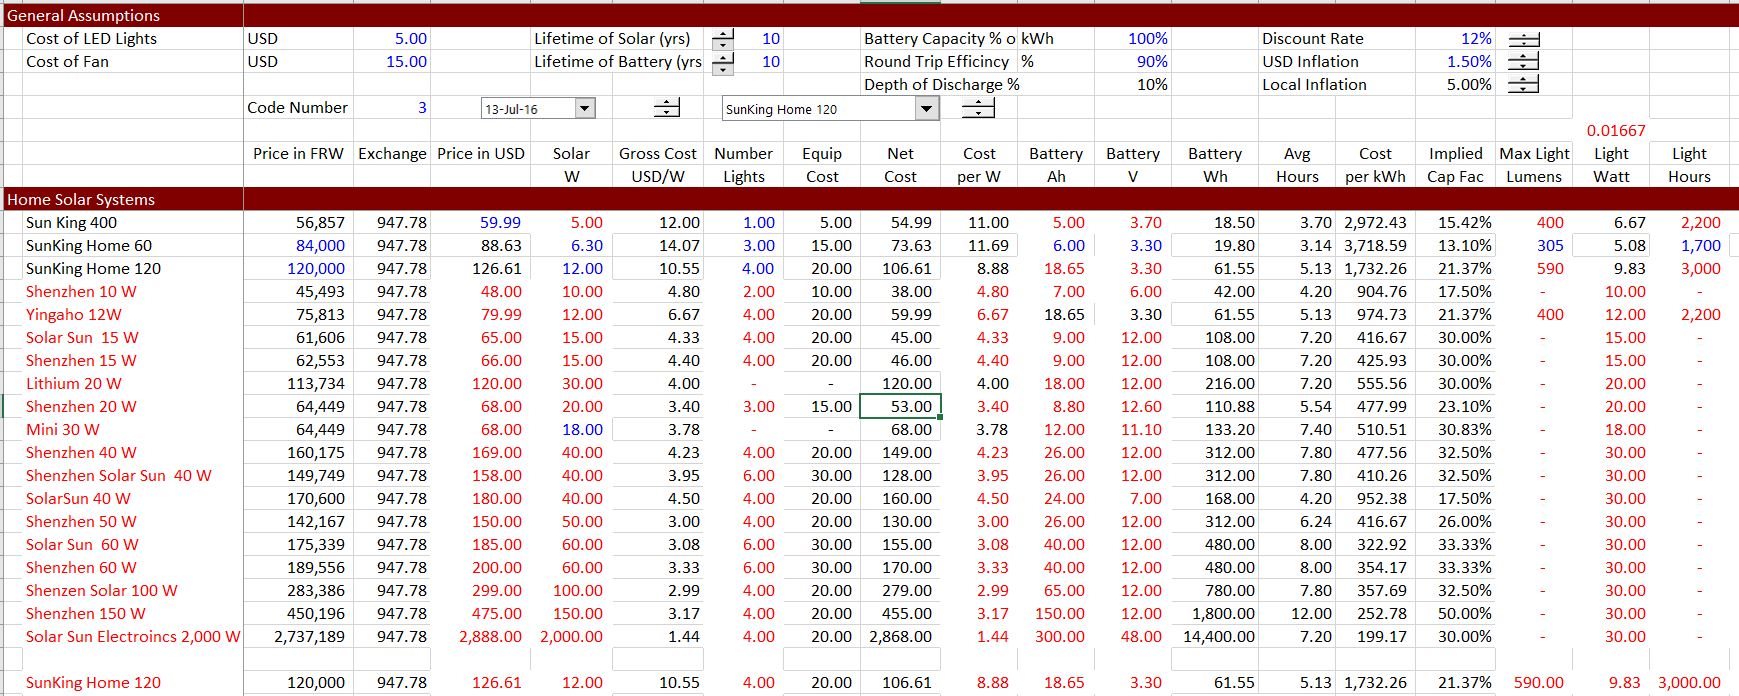
When creating the database, various factors are collected for each home solar power system. First, the cost of the home solar system is tabulated as shown in the screenshot below. Then the capacity and energy aspects of the solar and battery system is tabulated. If you look carefully below you can see that the 15 watt of solar capacity is reported as the 12 Volt and 9 amp hour of the battery. The amp hour (or mAh/1000) is multiplied by the volts gives the Watthour capacity of the battery.
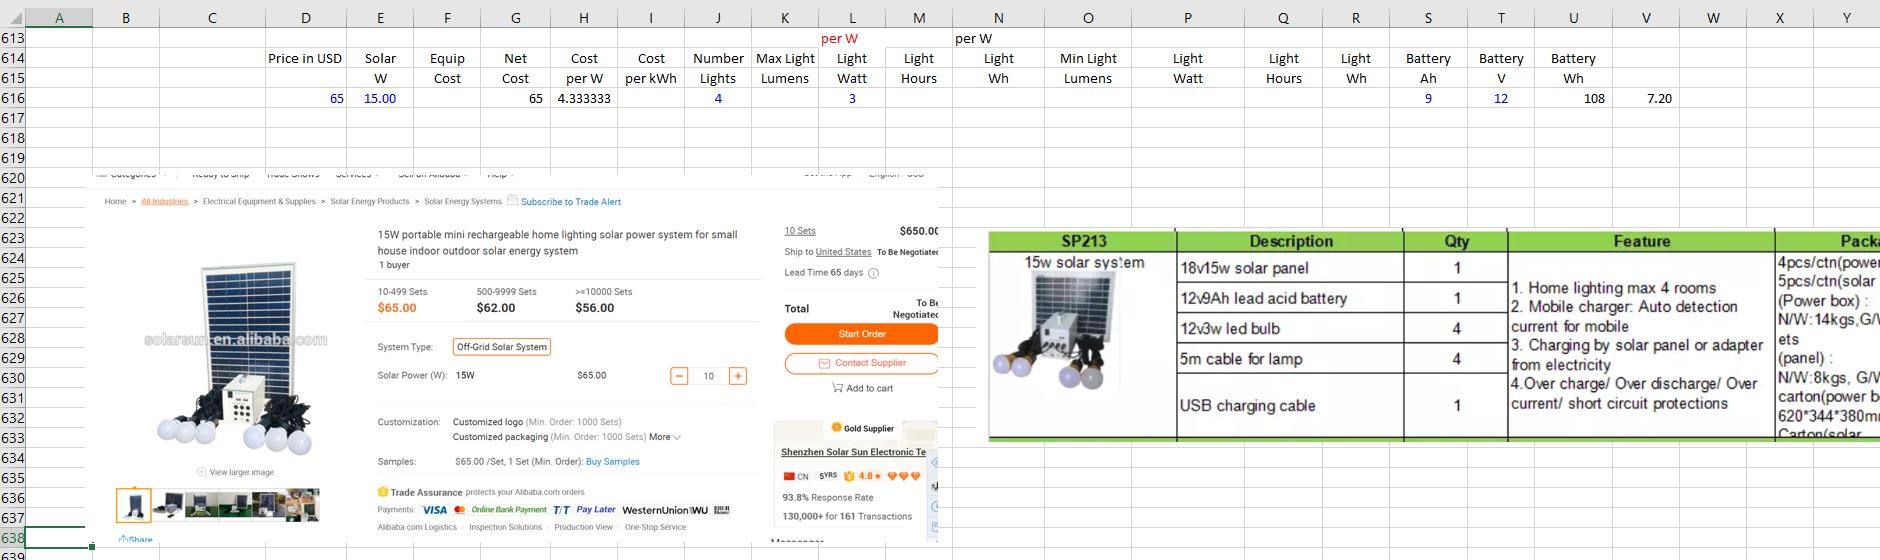
Once the costs and capacity of each home solar power system is tabulated, I put the data into a small database that is illustrated below. I have also recorded the number of lights and other equipment that is included with the home solar power system. I do this so the cost of electricity can be evaluated aside from the cost of the equipment. The cost of the system is computed relative to the amount of the solar capacity measured in Watts and relative to the amount of battery capacity measured in Watthours.
Computing the Cost of Home Solar Power Systems without Financing
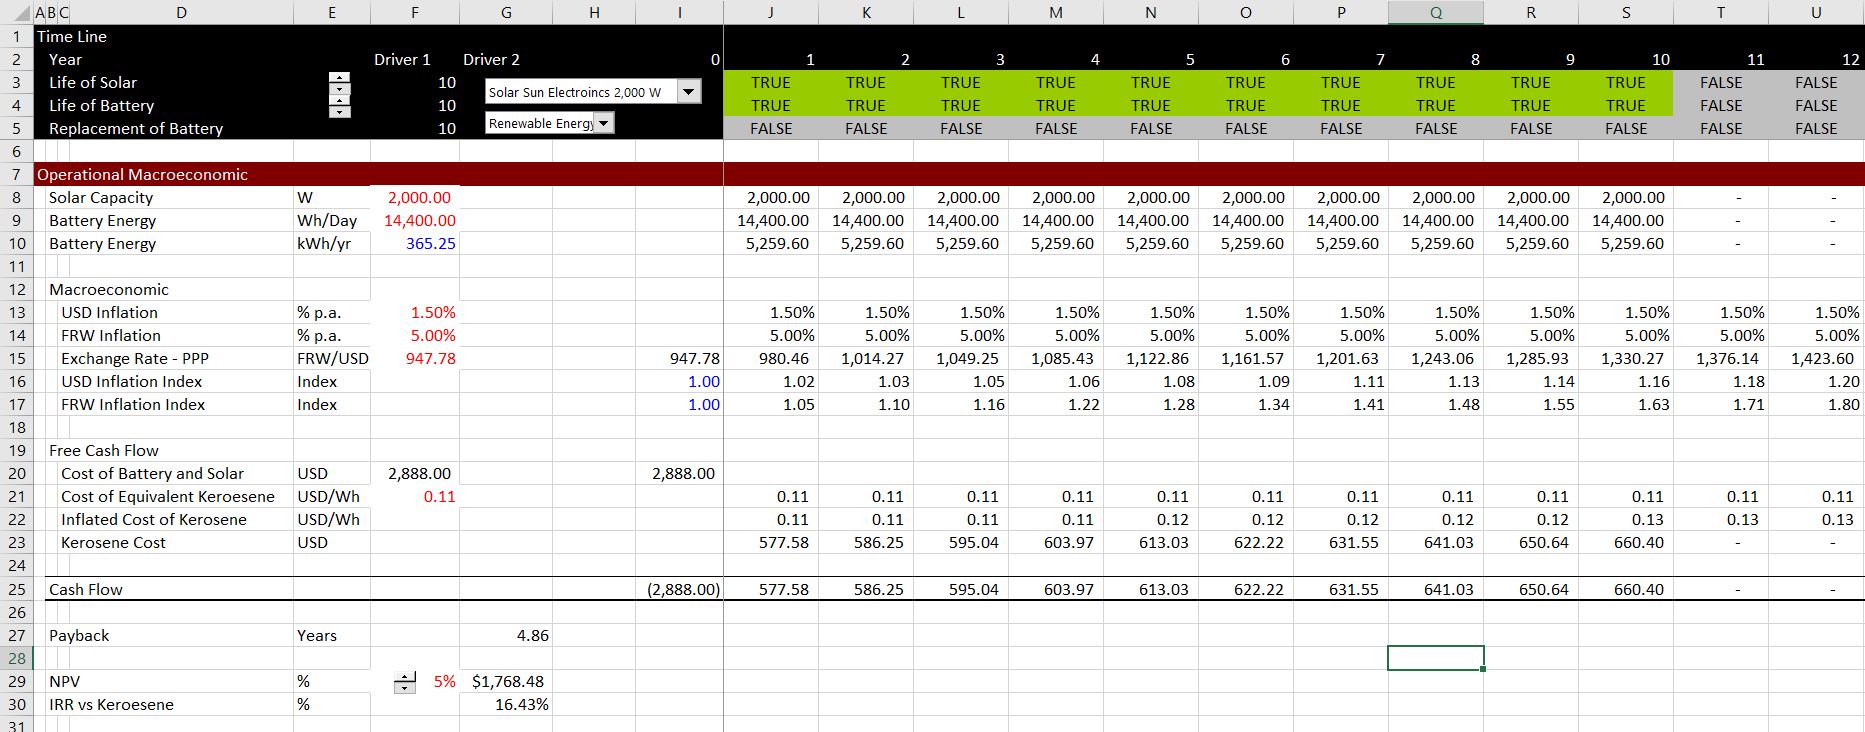
If we make a very simplistic (and incorrect) assumption that the battery energy can be used to meet lighting, phone charging and other loads, you can compute the cost of electricity from the home solar power system. This idea of using the amount of battery energy ignores the amount of solar energy available and the amount of coincident solar that can be used without the battery. With the capital cost of the solar system and energy used as well as assumptions about the lifetime of the home power system and the opportunity cost of capital, a simple LCOE can be computed for the systems. The two screenshots below illustrate this fundamental analysis. The first shows how a time line along with capacity and energy as the first items. Then, the free cash flow is measured from the cost of the alternative power (kersoene cost as described below). This provides a payback period that can be computed from the payback function. See the payback webpage to find the payback user defined function.
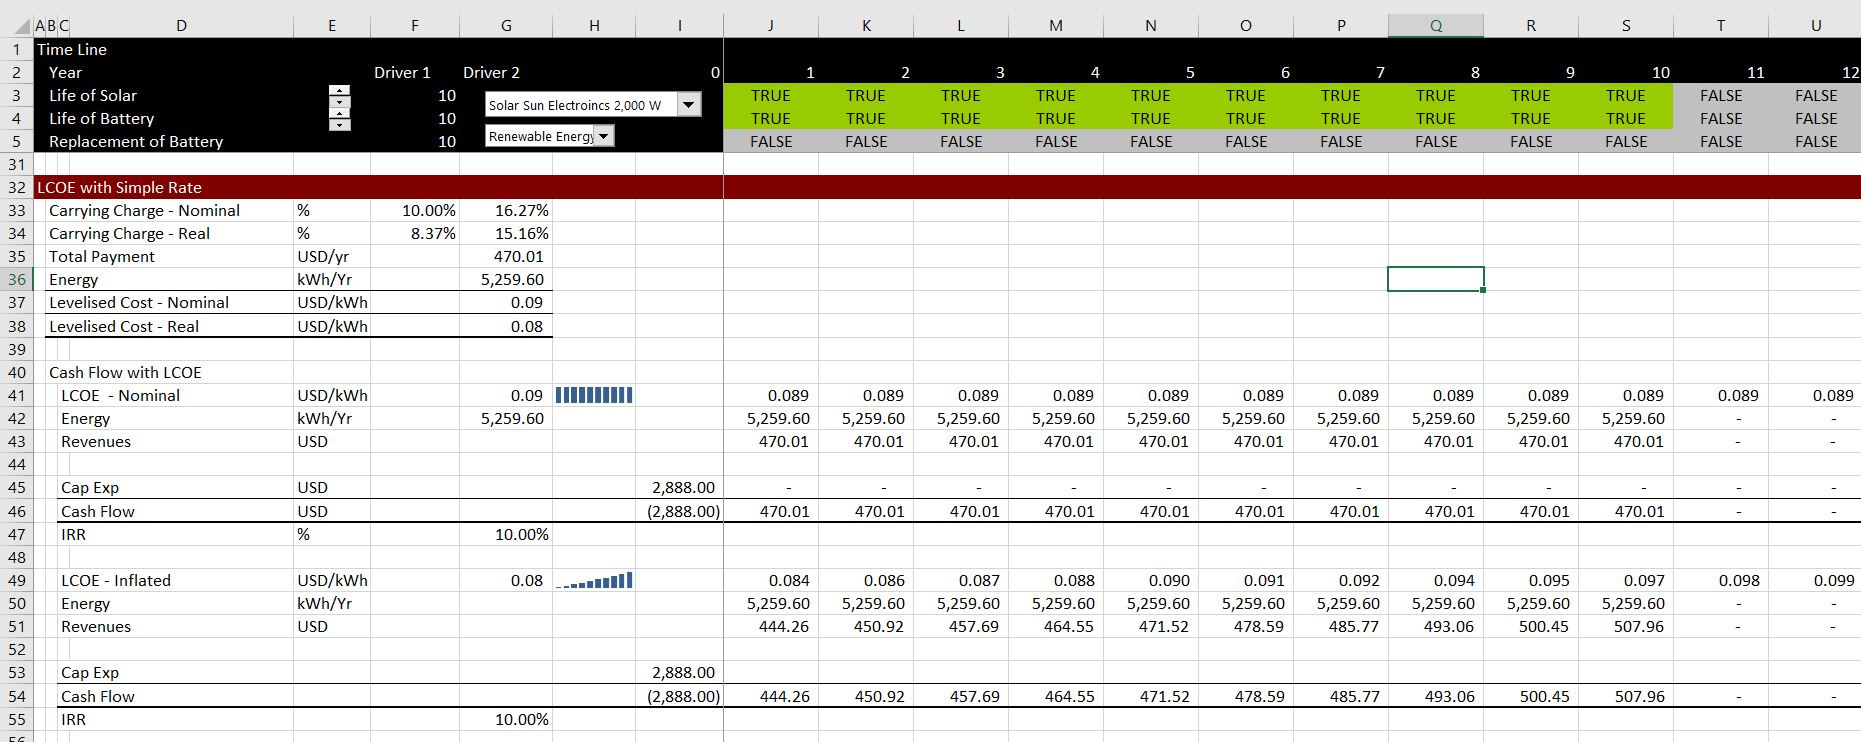
The second screenshot shows computation of the LCOE for the home solar power systems. This computation is pretty simple if you calculate the carrying charge rate from the PMT function. The PMT function requires the cost of capital, the project life and the cost of the financing. The carrying charge rate with the PMT function can be computed with either a real or nominal cost of capital, resulting in either a real or nominal LCOE computation. The carrying charge multiplied by the cost of project and divided by the energy produced from batteries. In the example below the nominal LCOE is .089 USD/kWh and the real LCOE using a discount rate that is lowered by the inflation rate is USD .084/kWh. In the final part of the screenshot, the difference between the real and the nominal LCOE is illustrated. In the case of the nominal LCOE, the flat LCOE multiplied by the annual battery production is computed relative to the capital expenditures for the home solar system. As seen in the screenshot, this results in the target IRR of 10%. Below the nominal the LCOE, the real LCOE with inflation is illustrated. In this case the LCOE is inflated. If the inflated LCOE is multiplied by the battery production and compared to the capital expenditure, the same target IRR results.
A description of the home solar power systems along with a basic computation of the associated levelised cost of electricity is presented in the video below.
[wonderplugin_video iframe=”https://www.youtube.com/watch?v=civJpQE-q70″ videowidth=600 videoheight=400 keepaspectratio=1 videocss=”position:relative;display:block;background-color:#000;overflow:hidden;max-width:100%;margin:0 auto;” playbutton=”http://edbodmer.com/wp-content/plugins/wonderplugin-video-embed/engine/playvideo-64-64-0.png”]
[wonderplugin_video iframe=”https://www.youtube.com/watch?v=60uNhFBkx3Q” videowidth=600 videoheight=400 keepaspectratio=1 videocss=”position:relative;display:block;background-color:#000;overflow:hidden;max-width:100%;margin:0 auto;” playbutton=”http://edbodmer.com/wp-content/plugins/wonderplugin-video-embed/engine/playvideo-64-64-0.png”]
Home Solar Power System Analysis with Alternative Financing, Inflation and Scenario Analysis
Battery Dispatch Analysis on an Hour-by-Hour Basis
When comparing kerosene with solar plus battery, you are comparing a dispatchable technology — lamps that you can turn on and off whenever you want — to a non-dispatchable technology (solar) that is supported by batteries. Whether this is for a big system, a microgrid or a big system, the analysis of a solar and battery combination must account for the charging and discharging of batteries as well as the amount of solar power that is available. I have tried simple methods to get around this, but there is really no way to avoid some kind of uses and sources of energy on an hour-by-hour basis. Further, the hour-by-hour analysis must have a battery balance. When messing around with storage and solar and trying alternative techniques, I keep coming back to the following steps.
Start with Cronological Demand Pattern
Need Watthours on an hour-by-hour basis to see how much can be met without batteries. I use the case that if the load is coincident with solar power, the battery capacity will not be important and storage is not necessary. To build up load from appliances, the Watthours can be computed from the Watts x hours. You can work through hour by hour uses of appliances as a percent of the capacity of the appliance — you could call this the load factor of an appliance. Formally, the load factor for a day is the average load over the course of a day divided by the total load of the appliance. For example, if an LED light is used at its full capacity of three Watts and the light is used for four hours, the load factor would be 25%, if the amount of the light use was 100% of its capacity for the four hours of use. I hope you can see that this means the demand analysis should measure the amount of the capacity for each appliance and the percent of each hour the appliance is used.
Note that the demand can be more than available capacity and un-served demand can be computed. This could be dimming the lights, running out of battery power to charge solar power.
Evaluate the Solar Power Production from Solar Capacity and Daily Production Curves
You can find hour by hour solar. This is described below. For now I just use an example.
Compute the Deficit or Surplus Energy From Solar Production and From Demand
You can find hour by hour solar. This is described below. For now I just use an example.
Compute the Period for Beginning to Charge for Re-ordering of the Supply and Demand and the Battery Balance
You can find hour by hour solar. This is described below. For now I just use an example.
Evaluate the Amount of Load that Can Be Served from the Battery
You can find hour by hour solar. This is described below. For now I just use an example.
[wonderplugin_video iframe=”https://www.youtube.com/watch?v=GiK9ctG9PI0″ videowidth=600 videoheight=400 keepaspectratio=1 videocss=”position:relative;display:block;background-color:#000;overflow:hidden;max-width:100%;margin:0 auto;” playbutton=”http://edbodmer.com/wp-content/plugins/wonderplugin-video-embed/engine/playvideo-64-64-0.png”]
Working with Hourly Solar Data to Evaluate Battery Charging and Discharging
In order to evaluate battery charging and discharging, you must understand the distribution of solar power over the course of a charging cycle and evaluate whether there is enough energy to charge the battery. There are two things that you cannot do. First, you cannot use some kind of typical load shape that ignores the variation in solar energy over time. Second, you cannot ignore seasonal variation and assume some kind of average daily load pattern.
The discussion above is discussed in detail in the video below. The button below is attached to the file that is associated with the video.
[wonderplugin_video iframe=”https://www.youtube.com/watch?v=Hnq4kuYTsfo&t=2s” videowidth=600 videoheight=400 keepaspectratio=1 videocss=”position:relative;display:block;background-color:#000;overflow:hidden;max-width:100%;margin:0 auto;” playbutton=”http://edbodmer.com/wp-content/plugins/wonderplugin-video-embed/engine/playvideo-64-64-0.png”]
Database from Lazard PDF Files
To evaluate batteries I have used as a basis, data from studies that have been periodically published by Lazard. These studies have a lot of fancy, but pretty meaningless graphs. The useful data in the Lazard studies on costs, lifetime, duration, efficiency etc. is not available in excel. So, the databases available for download below just put all of the data from two versions of the studies into excel files. I therefore begin by making a database from the Lazard study which contains costs and some storage characteristics and O&M data for different types of batteries. I have made databases from the Lazard version 1 study published in 2016 and the Lazard version 2 study from 2017. Note that there was more detail in the version 1 study and a very confusing item named auxiliary cost suddenly appeared in version 2 of the study (along with longer assumed life). You can download these two databases by clicking on the buttons below.
Database of Battery Costs and Operating Characteristics from Lazard 2016 Version 1 Study
Updated Databases of Battery Costs and Operating Characteristics from 2017 Update of Lazard Study
Database of Battery Costs and Operating Characteristics from Lazard Converted to Excel (Version 3.0)
The screenshot below shows the format of the battery database. The database is set-up so that you can import the data into PowerBI. The screenshot below the database excerpt is an illustration of the type of things you can do with analysis of PowerBI.
Mechanics of Creating Battery Databases
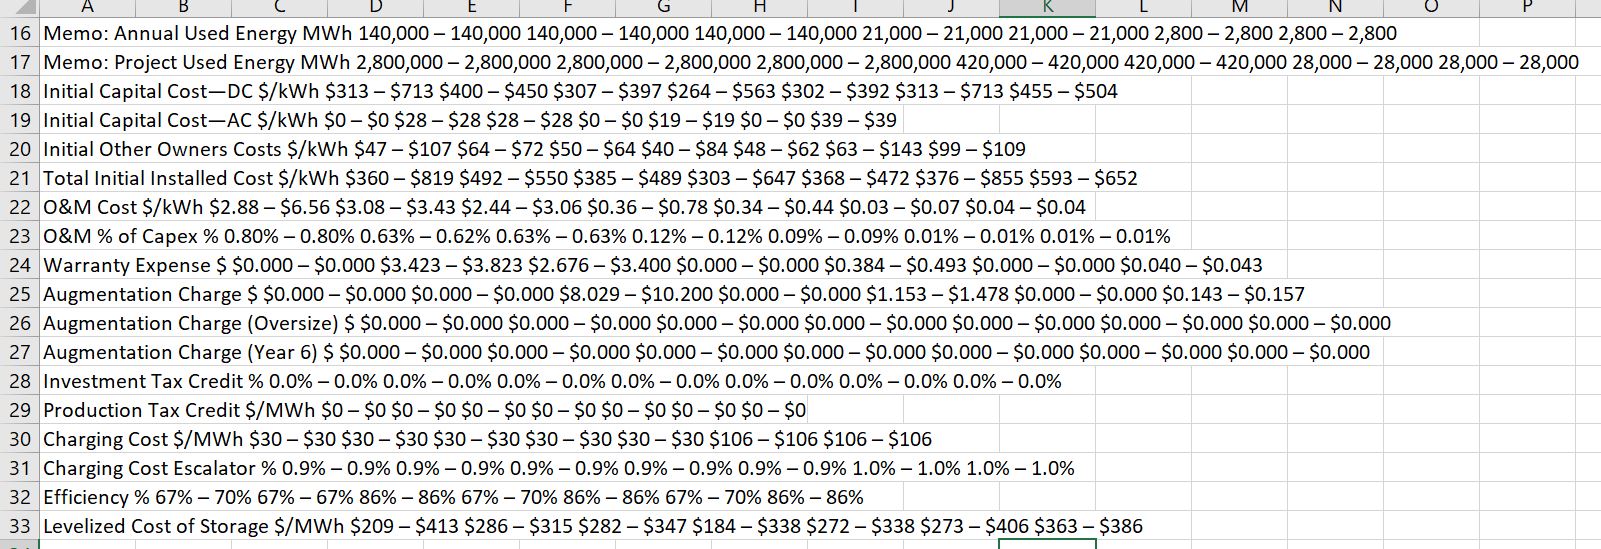
To create the battery database I have used the read pdf a lot from the Lazard pdf file that can be downloaded. It is a little tricky because of the dashes in the Lazard study.
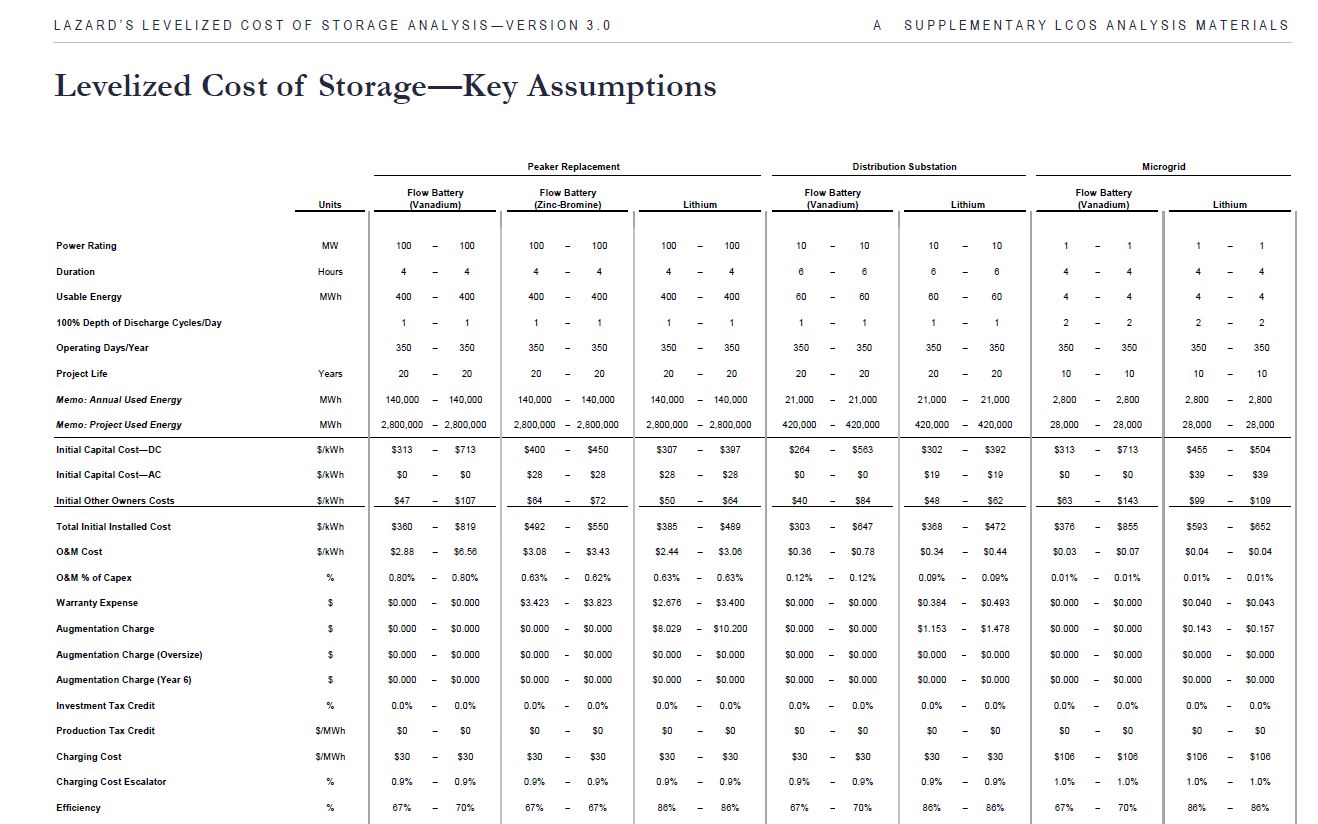
In using the Lazard studies, there are dashes between the low and high cost estimates. These dashes are converted to zeros and must be included in the count of numbers that is used to translate the data. I count 21 pieces of data including the blanks as illustrated on the screenshot below.
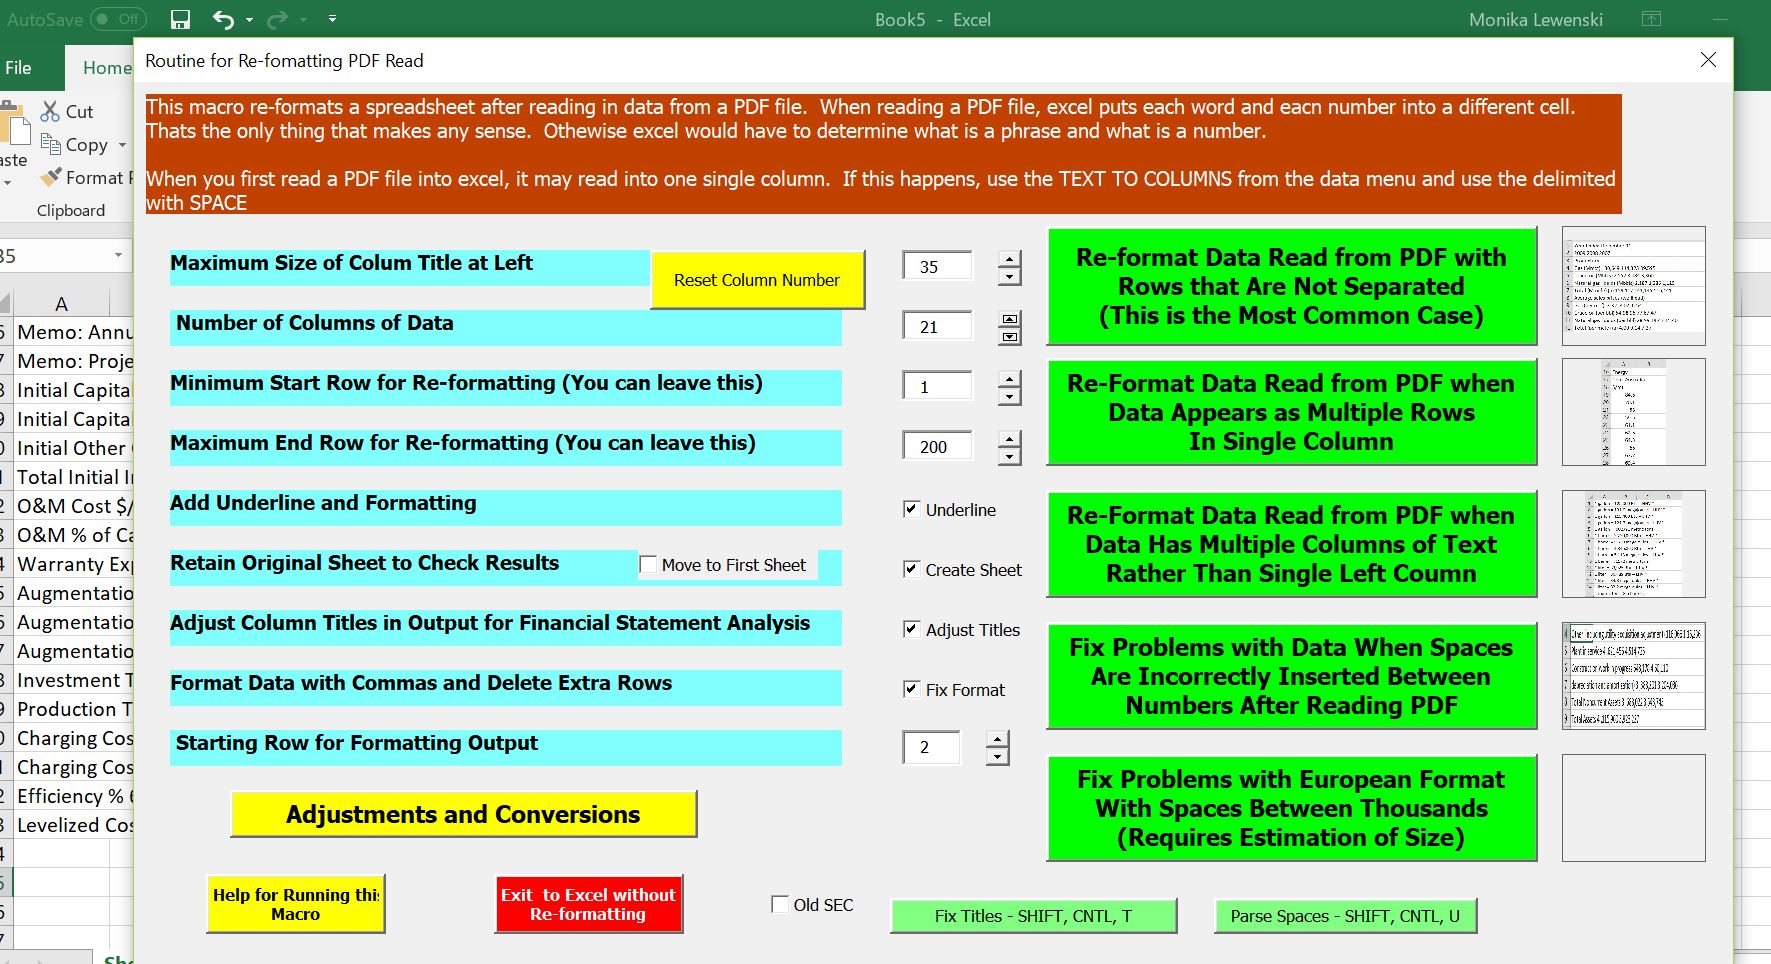
When you run the read PDF file, you should enter the number of columns (and you may have to run the program twice). Then you can adjust the titles and complete the database. A screenshot of the read pdf used to clean up the data is shown below. Note that there the number 21 is entered for the number of columns.
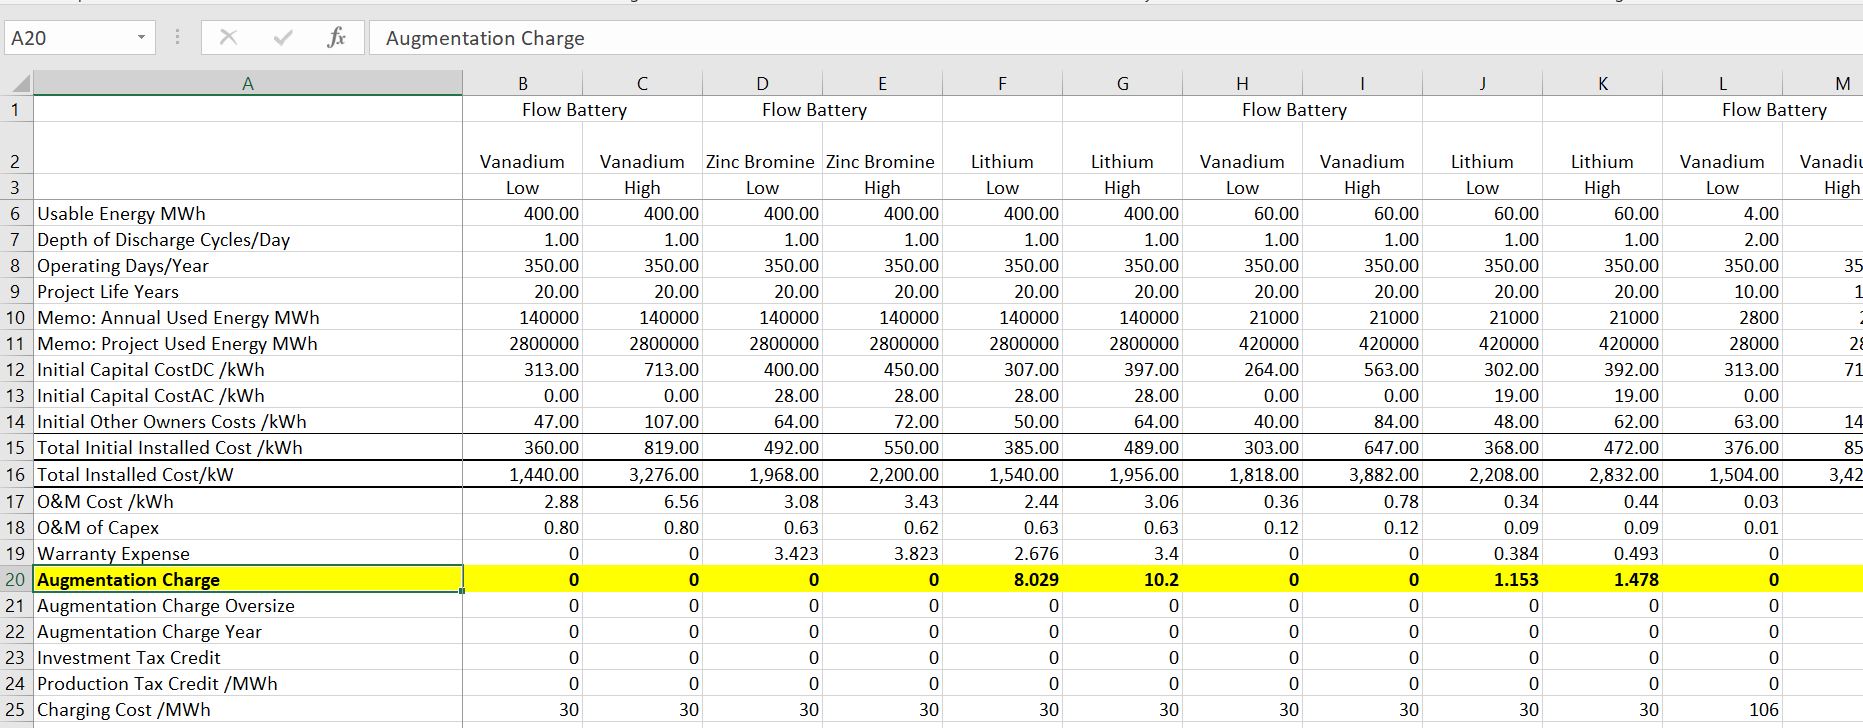
The final database is demonstrated in the screenshot below. I have added a line for the cost per kW of capacity. I also point out the Augmentation Charge that is added to Lithium Batteries that I understand do not really have a 20 year life. In modelling the Lithium Batteries it may be better to use a shorter life and ignore the mythical augmentation charge.
I have made a video on how you can efficiently read the Lazard version 1.0 study from the internet. The battery database derived from the Lazard study is included in the excel file below. I think it is useful to export the excel database into PowerBI so you can more clearly see the different characteristics of various batteries.
[wonderplugin_video iframe=”https://www.youtube.com/watch?v=SwCwi_C7ycE” videowidth=600 videoheight=400 keepaspectratio=1 videocss=”position:relative;display:block;background-color:#000;overflow:hidden;max-width:100%;margin:0 auto;” playbutton=”http://edbodmer.com/wp-content/plugins/wonderplugin-video-embed/engine/playvideo-64-64-0.png”]
The video below illustrates how you can use the battery database for selecting the best type of battery for analysis from an economic standpoint.
[wonderplugin_video iframe=”https://www.youtube.com/watch?v=33v-BZHluFI” videowidth=600 videoheight=400 keepaspectratio=1 videocss=”position:relative;display:block;background-color:#000;overflow:hidden;max-width:100%;margin:0 auto;” playbutton=”http://edbodmer.com/wp-content/plugins/wonderplugin-video-embed/engine/playvideo-64-64-0.png”]