This page demonstrates how you can replicate the Black-Scholes model with Monte Carlo simulation. Replicating the Black Scholes model in with Monte Carlo is a way to confirm that the way you have set-up your simulation correctly. With confirmation of the Black-Scholes you can use different distributions (e.g. Wiebull), you can test the effect of mean reversion and evaluate alternative option structures.
I have struggled with getting exact numbers for the replication for a long time. In the file that you can download below, I have made a Monte Carlo Simulation using log-normal distribution and compared the result to the Black Scholes which is computed with a function that you can copy into your file. The Monte Carlo Simulation is performed with a little macro.
File the Includes Black-Scholes Model and Monte Carlo Replication with Log-Normal Distribution
In creating the file various option input are used as shown in the screen-shot below. These are the same inputs used in a standard Black-Scholes model. The file above has very simple inputs with a zero interest rate and the strike price is the same as the current price. In this case, the call option has the same value as the put value.

With these inputs, a Monte Carlo simulation can be created as illustrated in the screen shot below. As with other simulations the NORMSINV(RAND()) is used. In this case, rather than using a simple stock price progression, the formula e raised to the (VOL x Rand + growth) is used. In this case, the growth is just the risk free rate.
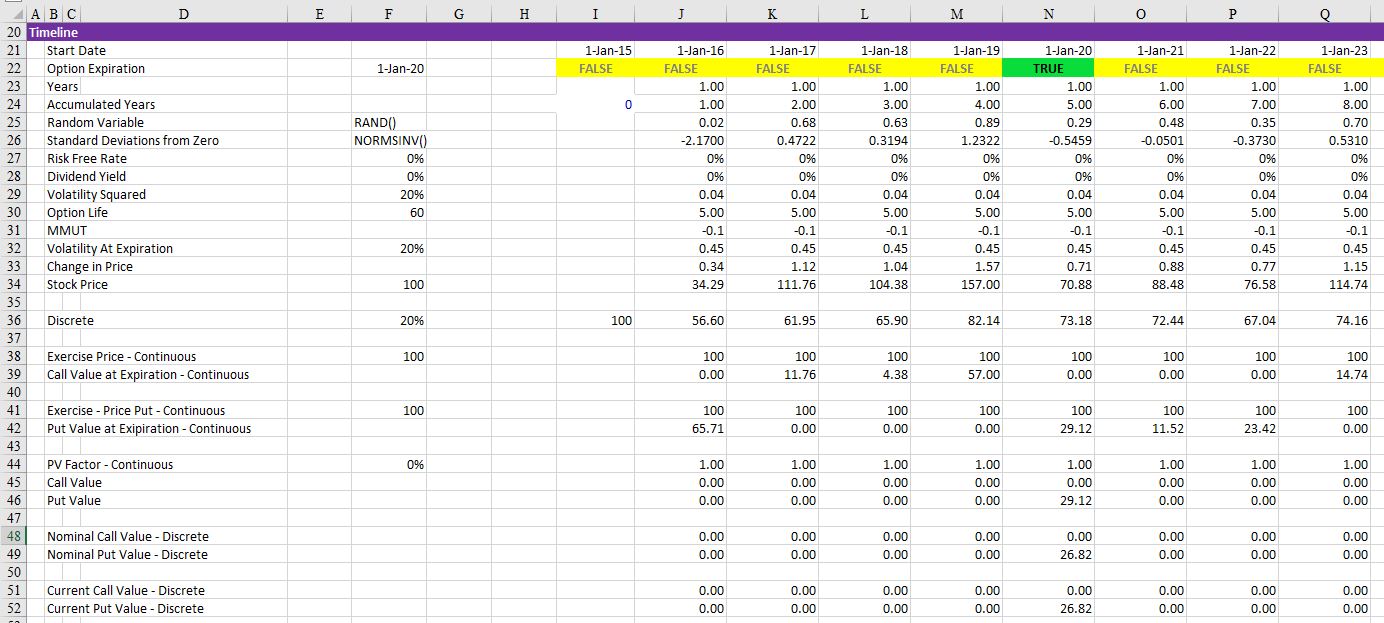
Creating the Monte Carlo Simulation
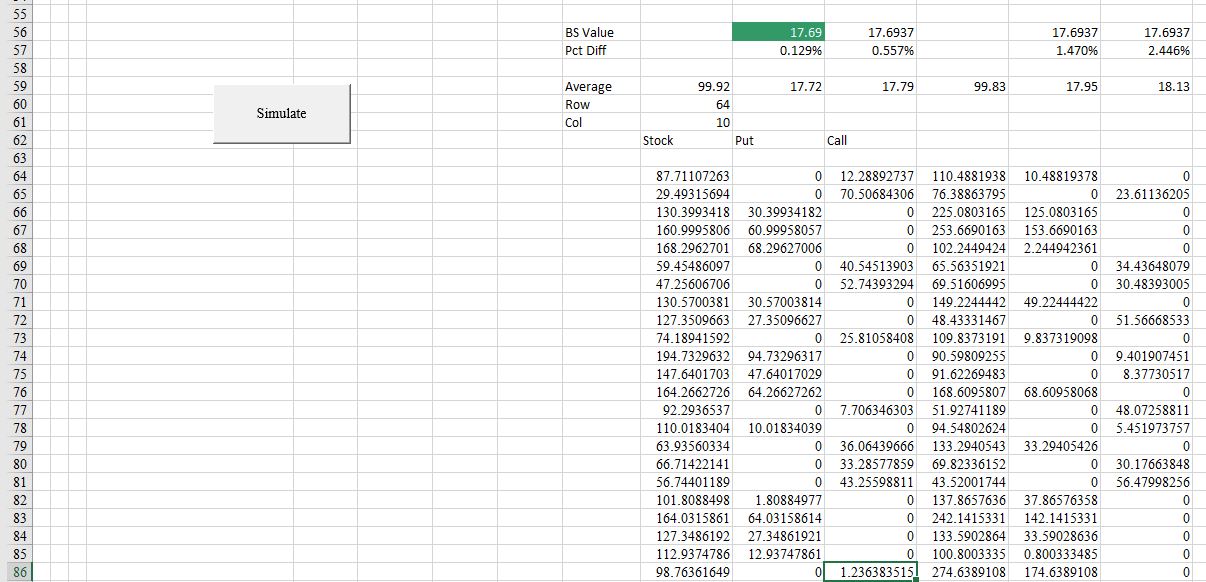
In creating the Monte Carlo Simulation, the results of the above spreadsheet are re-run for many different random simulations. This can be accomplished with a for loop as illustrated in the VBA code below. Results of a simulation with 10,000 random variables are shown below. You can run the simulation by pressing the button illustrated on the screenshot below. Note that the put and call are not exactly the same and they are not exactly the same as the Black-Scholes value.
VBA Code for Creating a Simulation
The VBA code below requests the number of simulations, runs a simulation and then puts the results into a separate cell. Note that you can use the input box to define the number of simulations. The status bar changes every 1,000 iterations.
.
Sub simulate1()

Range("simulations").Clear

Application.DisplayAlerts = False
Application.Calculation = xlCalculationManual

For Row = Range("row") To InputBox(" Number of Simulations") + Range("row")

ActiveSheet.Calculate

Cells(Row, Range("col") + 0) = Range("stock")
Cells(Row, Range("col") + 1) = Range("call")
Cells(Row, Range("col") + 2) = Range("put")

Cells(Row, Range("col") + 3) = Range("stock_d")
Cells(Row, Range("col") + 4) = Range("call_d")
Cells(Row, Range("col") + 5) = Range("put_d")

If Row Mod 1000 = 0 Then Application.StatusBar = " Iteration " & Row

Next Row

End Sub
.
The function for computing the Black Scholes function is shown below.
.
Function BSOptionValue(iopt, S, X, r, q, tyr, sigma)
' Returns the Black-Scholes Value (iopt=1 for call, -1 for put; q=div yld)
' Uses BSDOne fn
' Uses BSDTwo fn
 Dim eqt, ert, NDOne, NDTwo
 eqt = Exp(-q * tyr)
 ert = Exp(-r * tyr)
 If S > 0 And X > 0 And tyr > 0 And sigma > 0 Then
 NDOne = Application.NormSDist(iopt * BSDOne(S, X, r, q, tyr, sigma))
 NDTwo = Application.NormSDist(iopt * BSDTwo(S, X, r, q, tyr, sigma))
 BSOptionValue = iopt * (S * eqt * NDOne - X * ert * NDTwo)
 Else
 BSOptionValue = -1
 End If
End Function


.