This page describes how to evaluate battery storage and solar analysis in the case of a microgrid with no support from an external grid. The costs and benefits of different storage and dispatchable technologies is evaluated with different load shapes and daily solar yields. The analysis illustrates modelling challenges of a micro grid that include evaluating different load shapes; considering the uncertainty of solar and other renewable resources; maintaining the balance of energy in the battery, evaluating the effect of the energy storage relative to the capacity of the battery, incorporating capital costs of the battery and solar in the analysis and many other issues. The analysis demonstrates that the value of installing batteries depends on the cost of the battery, the efficiency of the battery, carrying charges as well as the price of diesel fuel and the economics of solar power.
Overview of Microgrid Analysis with Uses and Sources of Energy and of Money
Evaluation of the costs and benefits of microgrid is akin to modelling and integrated utility company in a large region of a developed country. The most basic function of a utility is to meet the demand of its consumers with generation, transmission and distribution assets. It should like to meet the demand with a combination of resources that minimises costs (including externalities). The stating point of analysis of an integrated utility company is evaluation of the demand (that I often call load) and understanding of different ways to meet the load. Demand can be evaluated over different hours in a day; different seasons in a year; and, growth rates over a multi-year period. For each period, and analysis that demonstrates how much energy is needed by hour; by season or by year is the starting point. Furthermore, the amount of peak load in different periods should be understood as well as the average load relative to the peak load which is called the load factor.
Once the load is analysed (with different possible scenarios), the amount of generation required to meet the load can be evaluated. Different strategies with alternative generation mixes and alternative amounts of capacity can be tested. The strategies can consider different amounts of available renewalbe energy during different time periods — hours; seasons and years. On top of this, different amounts of storage capacity should be simulated along with dispatchable capacity from diesel or other technologies. Finally, as in the case of modelling an integrated utility company, the cost of un-served energy can included in the analysis even though it may be challenging to put a number on.
I hope the retail example demonstrates how you can visualise the effects of different parameters and the effect of things like the pattern of solar in a day, the duration of a battery and other factors. Instead of showing how you can use the solver tool in excel to optimise the amount of battery capacity and solar capacity that I used in version 1.0, I have put a bunch of spinner boxes and simpler function so you can see the effects of different variables.
The general idea of analysis presented on this page is to show you that you can evaluate the economics of battery storage by yourself without referring to a study such as the Lazard study that has a lot of pretty pictures but means very little. You can use the spinner boxes and the drop down boxes to evaluate what the cost of the battery, the cost of capital, the load shape, the diesel price, the solar cost, the solar capacity factor and other variables have to be to make the battery economic.
The file that is discussed on this page is available for download by pressing the button below.
Illustration of Results from Microgrid Analysis with Diesel, Solar and Batteries
Before discussing any technical details, I present and example of how you can use the file below. I am sure that you would want additional features in a real analysis, but I hope this demonstrates how you may present some of the results and how to make a cost benefit model using the crucial assumptions. To introduce the model I have presented three screen shots for cases with (1) no solar or battery; (2) solar but no battery; and (3) solar and battery. In this hypothetical example, the case with solar and a battery produces the lowest costs. But the results depend on many variables such as (1) the solar power pattern; (2) the load pattern; (3) the cost of solar power; (4) the carrying cost for batteries; (5) the cost of batteries; (6) the carrying cost of solar power; (7) the price of diesel; (8) the capacity of the solar power; (9) the capacity of the batteries; (10) the efficiency losses of the batteries; (11) the battery storage duration; (12) the solar O&M cost; (13) the battery O&M cost; (14) the diesel variable O&M; (15) required spinning reserve for the diesel; (16) changes in load from day to day; (17) changes in solar power from day to day; and other variables I have probably not mentioned.
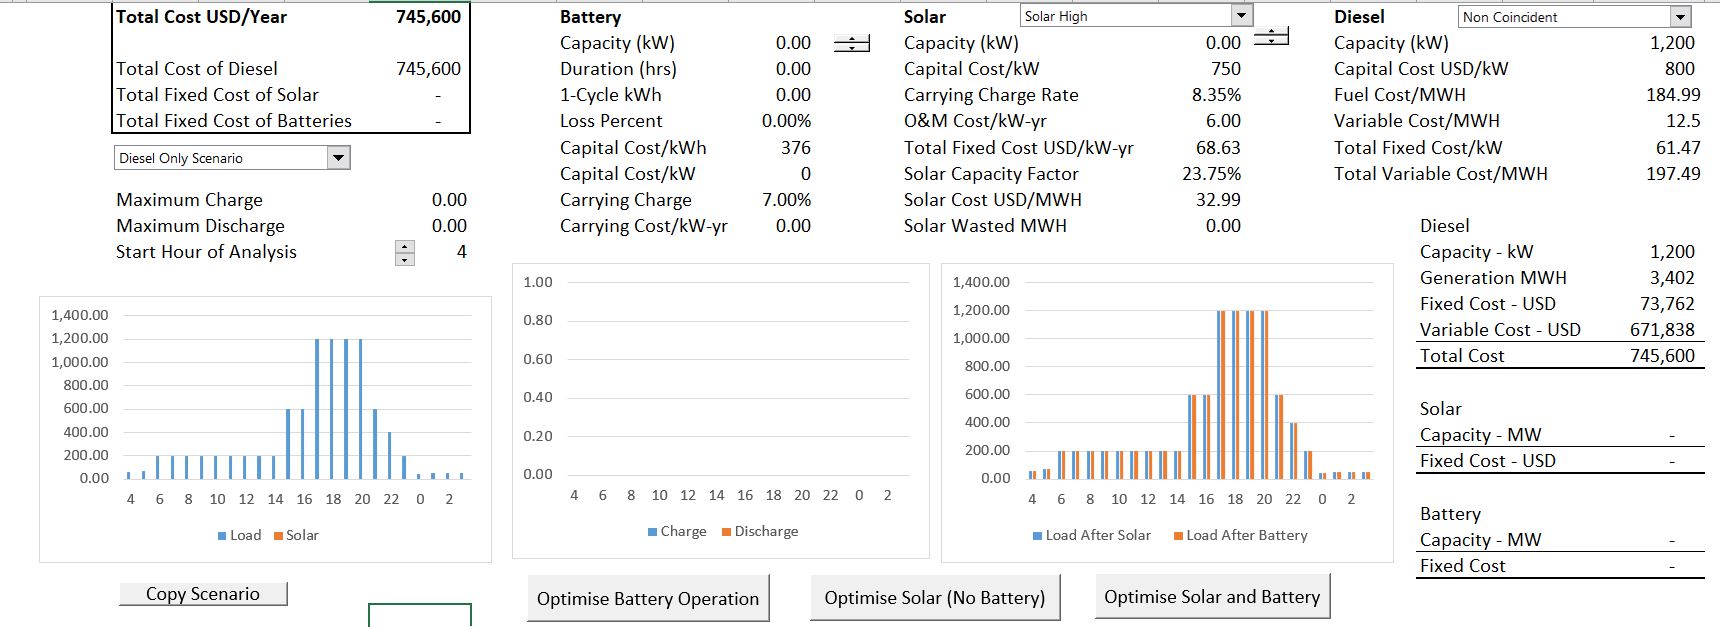
Case 1: No Battery or Solar Power
The screenshots of the summary pages shown below demonstrate how you may present the results of your analysis. The general idea is that load after solar production must be derived from somewhere. In the microgrid case, the load could be met by paying for diesel power, producing solar power, or using of batteries (that really moves the loads around). The costs of meeting load from diesel power; from solar power; or from batteries is shown on the summary page. In the first example, there is only load with a picture of the load on the bottom left of the summary page. Note that the total annual cost of this alternative is 991,145 per year for a demand of 1,200 kW and energy of 7,198 MWH. There is no cost for the battery or for the solar panels.
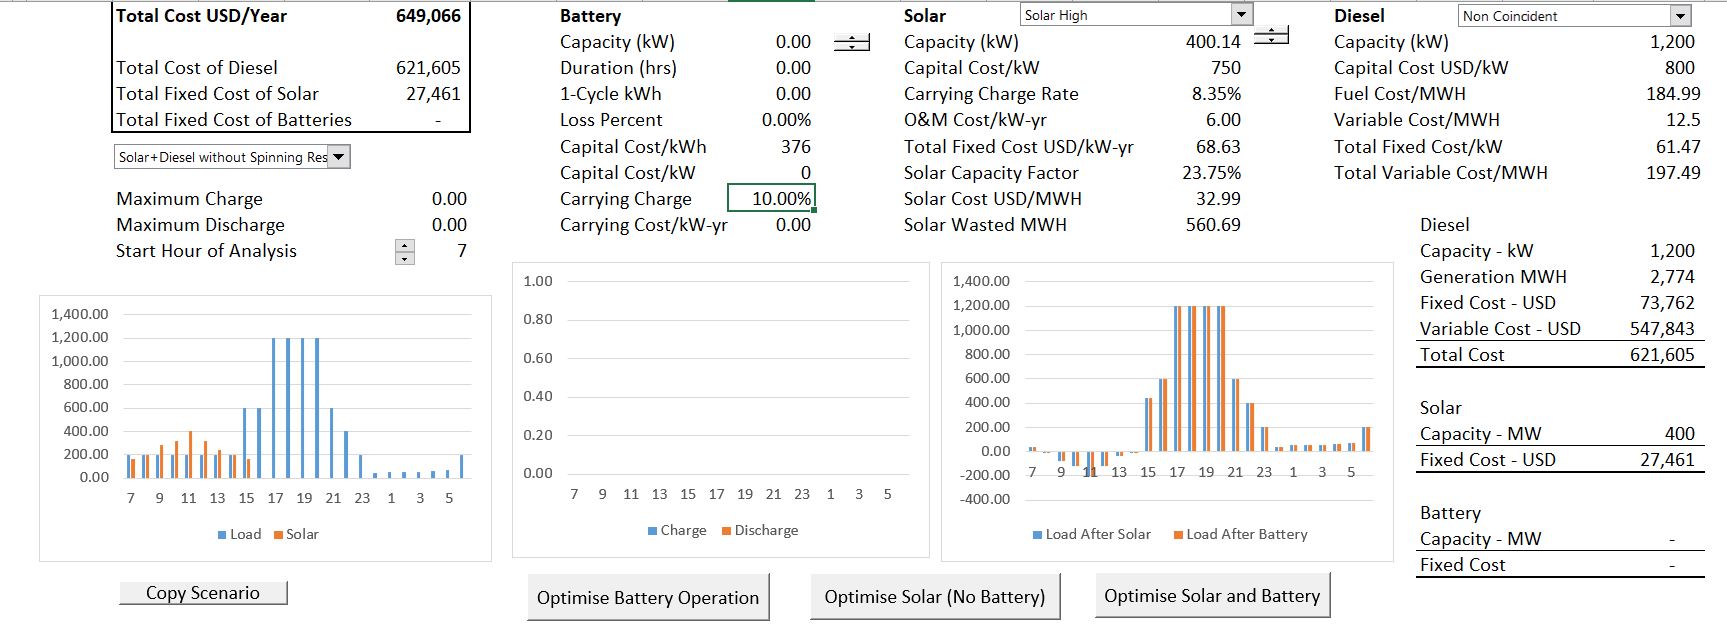
Case 2: Solar Capacity with Load that is Non-Coincident with Solar Power Pattern
In the second case, solar capacity is added, but no battery capacity is included. As the solar power usage does not have the same pattern as the demand usage, battery capacity is less important. Note that there is some reduction in total cost as the fixed cost of installing solar power over the course of a year is less than the reduction in the cost of running diesel power.
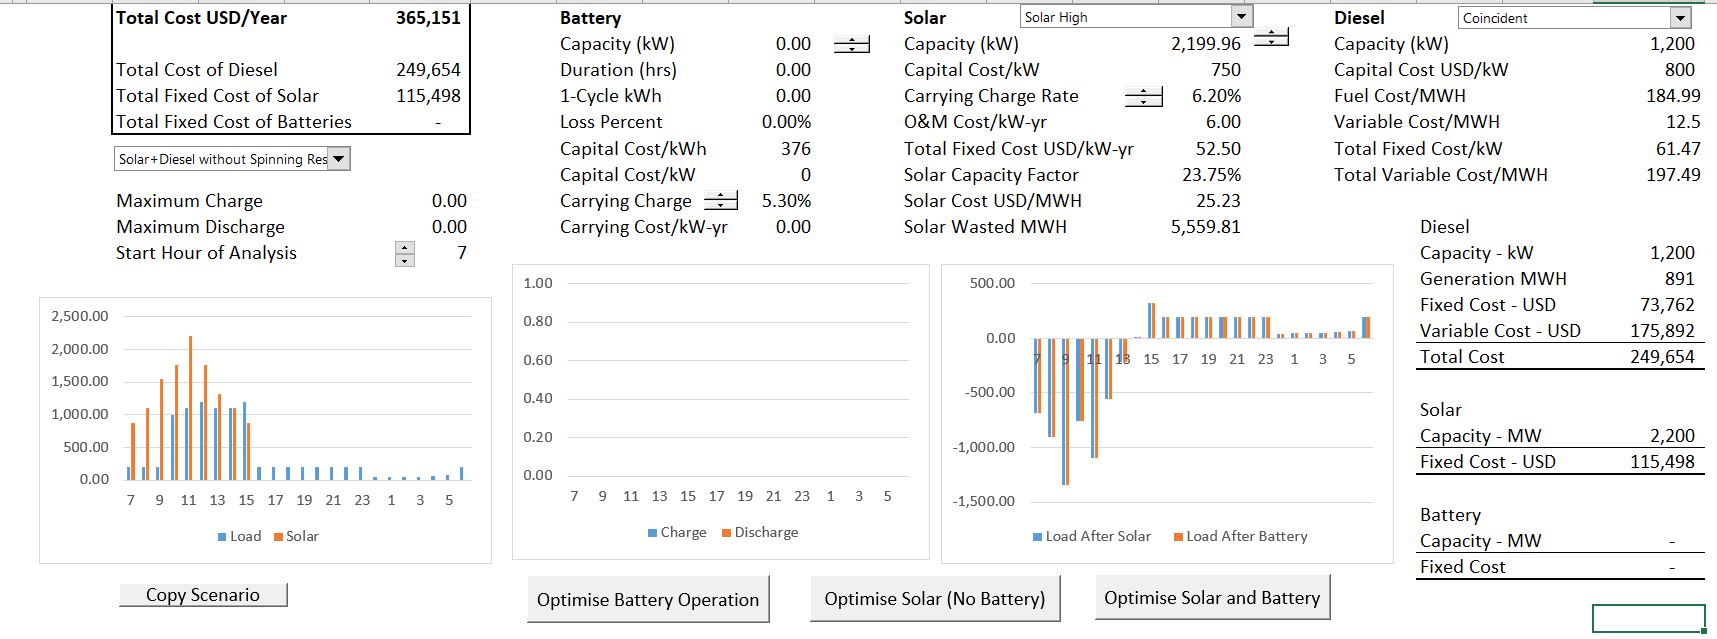
Case 3: Solar Power and No Battery in Case where Solar Power Pattern in Coincident with Loads
If the solar pattern is similar to the load pattern, then much more solar capacity can be justified without batteries. In this case, the amount of solar capacity is increased to 2200 kW and the cost is reduced a lot compared to the diesel only case. Here, with load that has a similar or coincident pattern to sunlight energy, the need of a battery is much less.
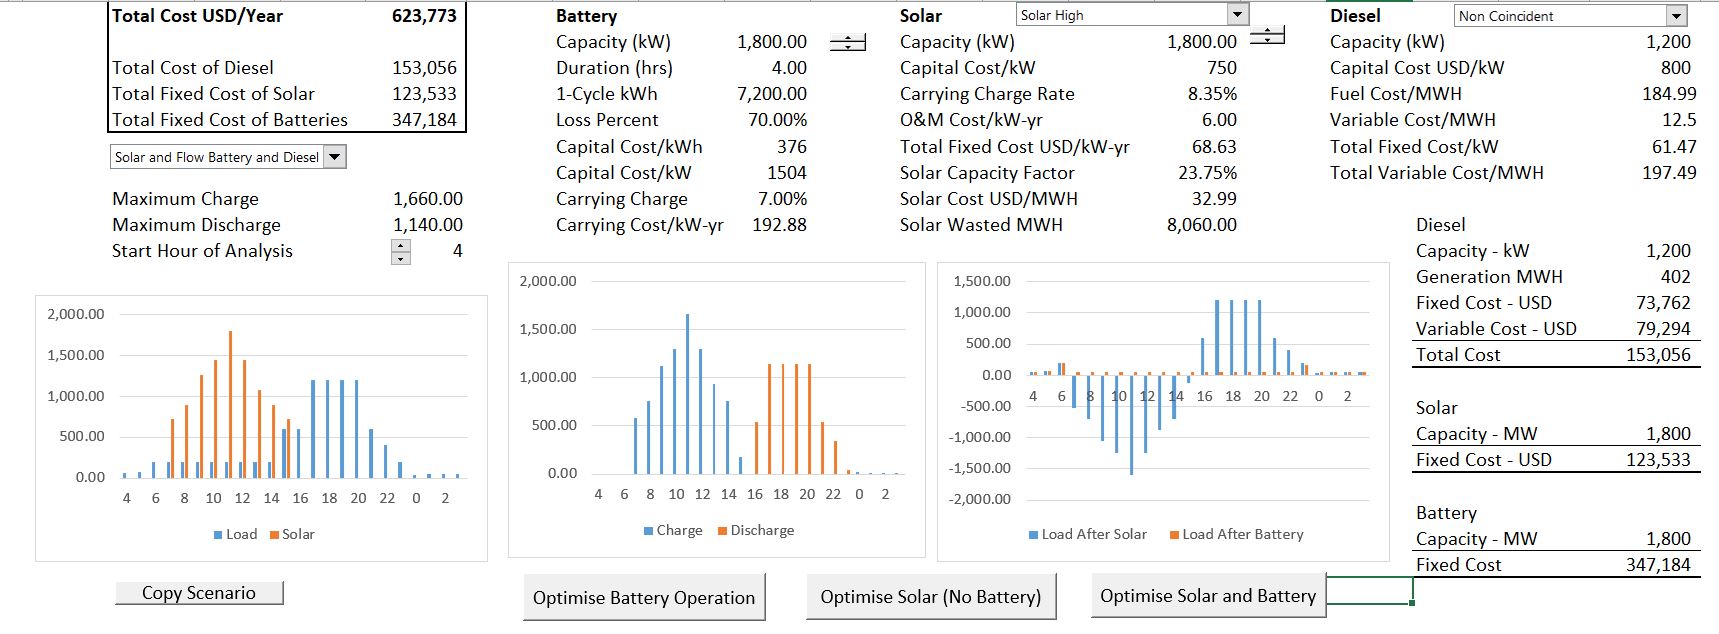
Case 4: Case with Non-Coincident Load with Battery and Solar
The last slide on this page shows the optimal solar and battery capacity in the case with batteries and solar power. In this case the diesel power is further reduced and the total cost is somewhat less than the cost with only solar power. The savings are driven to a large extent by the cost of the batteries and the carrying charge rate on batteries. With higher battery costs and higher carrying charge rates, the costs of batteries become uneconomic.
Background for Analysis of Using an Isolated Island Systems as the Starting Point for Battery Analysis and the Rubbish Notion of LCOS
You have probably heard a lot of buzz about batteries and storage lately. Solar and wind power economics have dramatically improved and now the question in the electricity industry is no longer about whether the government should subsidize the technologies. Instead, issues are being discussed about problems with the intermittency of solar and wind and problems with sudden cloud covers or sudden wind bursts. After the success of solar power (probably mainly because the Chinese came into the market), the issue is whether batteries can provide a similar revolution.
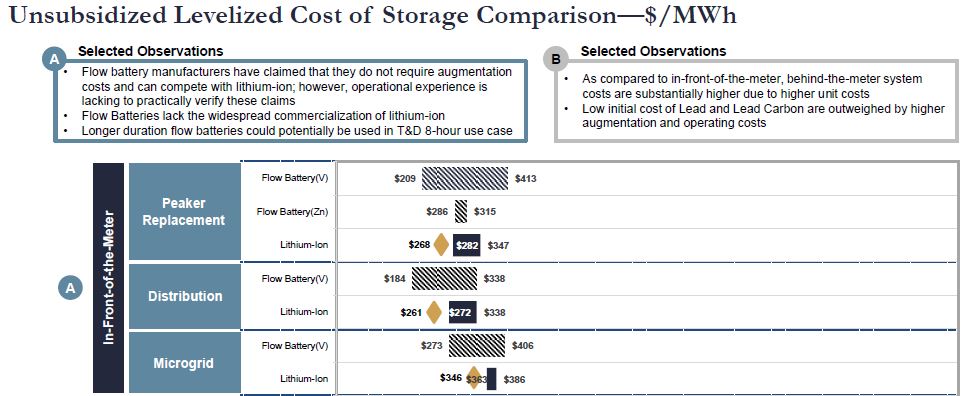
When you hear about batteries two sources seem to be prominent. The first is Elon Musk (the paypal ripoff man). The second is a study by the American Investment Bank Lazard. The latest Lazard study presents a whole bunch of football field diagrams on the levelised cost of storage, a couple of which are illustrated below. (You can see how to build football field diagrams in another sheet). The first excerpt is from the costs presented in USD/MWH for different uses. Note that the cost per MWh is dramatically higher than the cost of USD 20/MWH that has been quoted in some PPA’s recently for solar. Note also that that cost of a flow battery in a micro-grid has a very high range and could have a higher cost than a lithium battery.
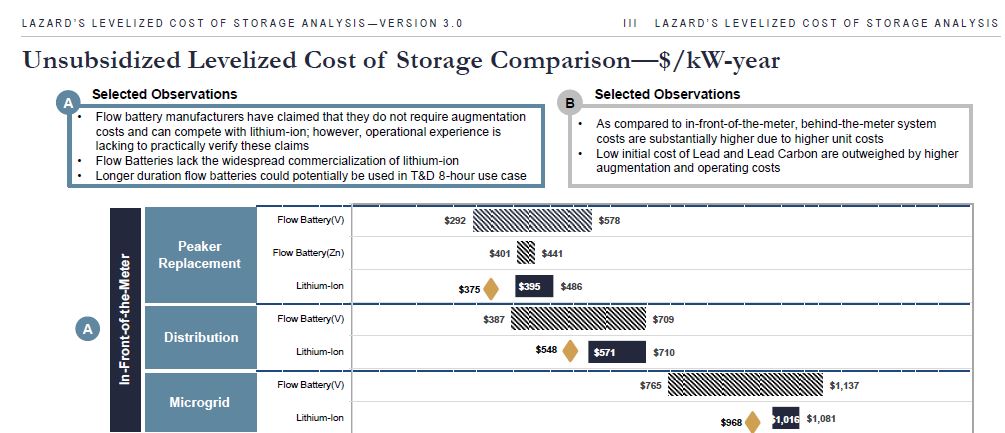
Another football field presents results in terms of the cost per kW-year. For a few people who have spent a lot of time in the electricity industry this may seem more interesting. But as a rule of thumb, the cost of a peaker at something like USD 600 per kW with a carrying cost of 7% should have a cost around USD 54/kw-year. Costs in the range of USD 1000 per kW-year cannot mean anything at all.
I hope by now you are thinking, what a lot of BS. This does not help at all in telling me whether batteries can really be economic or whether batteries are a fad that is being spouted by Elon Musk.
So I have tried to apply some objective and unbiased economic and finance principles to evaluating the cost and benefits of batteries. In the micro-grid situation, I compare the cost to consumers in three cases. Case 1 is no solar or battery. Case 2 is battery with solar. But this case may not be very good if people want to use electricity at night. Case 3 is solar plus diesel plus battery. In this case, the solar can be used to charge the battery and then the battery can be discharged at night when people want to use electricity.
Before presenting the results, consider the case of the island below in Malaysia. This is a real case where the only real alternatives are a diesel plant, some solar panels and maybe some batteries to store electricity.  This hypothetical example is in my opinion an effective way to illustrate many of the economic issues associated with battery analysis. It involves solar analysis, the cost of diesel fuel, the demand patterns of people who live on an island and the kind of batteries that would be most effective. If you can understand how the battery analysis works in an island scenario then you can add a portfolio of generating plants instead of the single diesel unit and you can use load patterns with more diversity etc.
As with so many issues, I get very lost by trying to jump into a large messy system without understanding the fundamental economics first. One of the major points about using an island system to demonstrate the issues is to show you that concepts of the levelised cost of storage are, basically, rubbish.
Cost and Benefit Analysis of Micro-Grid using Load Profiles, Diesel Costs, Battery Costs and Sunlight Patterns
The island system analysis demonstrates that the concept of levelised cost of storage makes virtually no sense at all. If you have an island system like in the above picture, you would like to compute the total cost to consumers in a scenario with and without batteries and with and without different amounts of solar power. The total consumer cost (which is also shown on a cost per MWH basis) includes the cost of batteries as well as the cost of operating the diesel units and the total cost of the solar plant.
If you use batteries you may have install more solar power depending on the load profile of consumers. You may also avoid the use of the diesel plant at minimum generation to provide spinning reserve.
In this section I walk through how to set-up the model on a step-by-step basis. The items you need to reflect in a storage analysis include: hourly loads; hourly solar production patterns; technology costs and characteristics for solar power; technology costs and characteristics for batteries; variable costs of running diesel including diesel prices (and spinning reserve constraints); financial, tax and operating life parameters for solar; financial, tax and operating parameters for batteries;
Hourly Load Inputs
With the revised model you can enter different hourly load shapes reflecting real world changes in usage, weather patterns, weekends and so forth. The screen shot below illustrates the sheet where you enter different assumed loads over the course of a day.
Once you have entered the raw data, in the assumption page you specify which loads will be applied for different days.
Solar Pattern Inputs
Technology Costs and Operating Characteristics of Solar Power
Technology Costs and Operating Characteristics of Batteries
Variable Costs of Diesel Including Diesel Fuel and Minimum Capacity
Financial, Tax and Operating Life Assumptions for Solar
Financial, Tax and Operating Life Assumptions for Diesel
Video on Using the Microgrid Analysis
The discussion above was supposed to explain how to use, modify and create an analysis with batteries, solar power and diesel power. Despite my efforts above, you may want to see how things work with a video. So, the video you can watch below works through the ideas and some of the mechanics of the storage and solar analysis in a microgrid situation.
.
[wonderplugin_video iframe=”https://www.youtube.com/watch?v=SFAM2SxU12c” videowidth=600 videoheight=400 keepaspectratio=1 videocss=”position:relative;display:block;background-color:#000;overflow:hidden;max-width:100%;margin:0 auto;” playbutton=”https://edbodmer.com/wp-content/plugins/wonderplugin-video-embed/engine/playvideo-64-64-0.png”]
Optimisation
In running the program there are a number of factors that you can optimise. One item to optimise is the manner in which the battery will be operated — i.e. the charging and discharging of the battery. A second item to optimise is the amount of solar power in the case without batteries. A third item is the amount of solar power and battery power in the case with solar and batteries. You could optimise these by making a data table with the cost as an output. With the data table that has a whole bunch of battery sizes and solar capacity sizes, you could pick the number in the data table that gives you the lowest cost. Then you could go back and put the solar capacity and the battery capacity in the model. As an alternative, you could create a macro that works through the variables and find the lowest cost with FOR NEXT loops. I have used this method in the optimisation.
Hourly Loads, Hourly Solar Pattern and Starting Hour
As stated above, if you want to use the model for a detailed analysis, you should be a lot more careful with hourly loads and with the solar pattern of production. You could include loads for weekends and different seasons. You could include different solar patterns for cloudy days or days during the rainy season. If you include the different patterns of loads and/or different patterns of solar power, you could make a longer time period in the model where, for example, you make the model last for a month. If you make the loads for a month the starting point for charging or dis-charging is not as important.
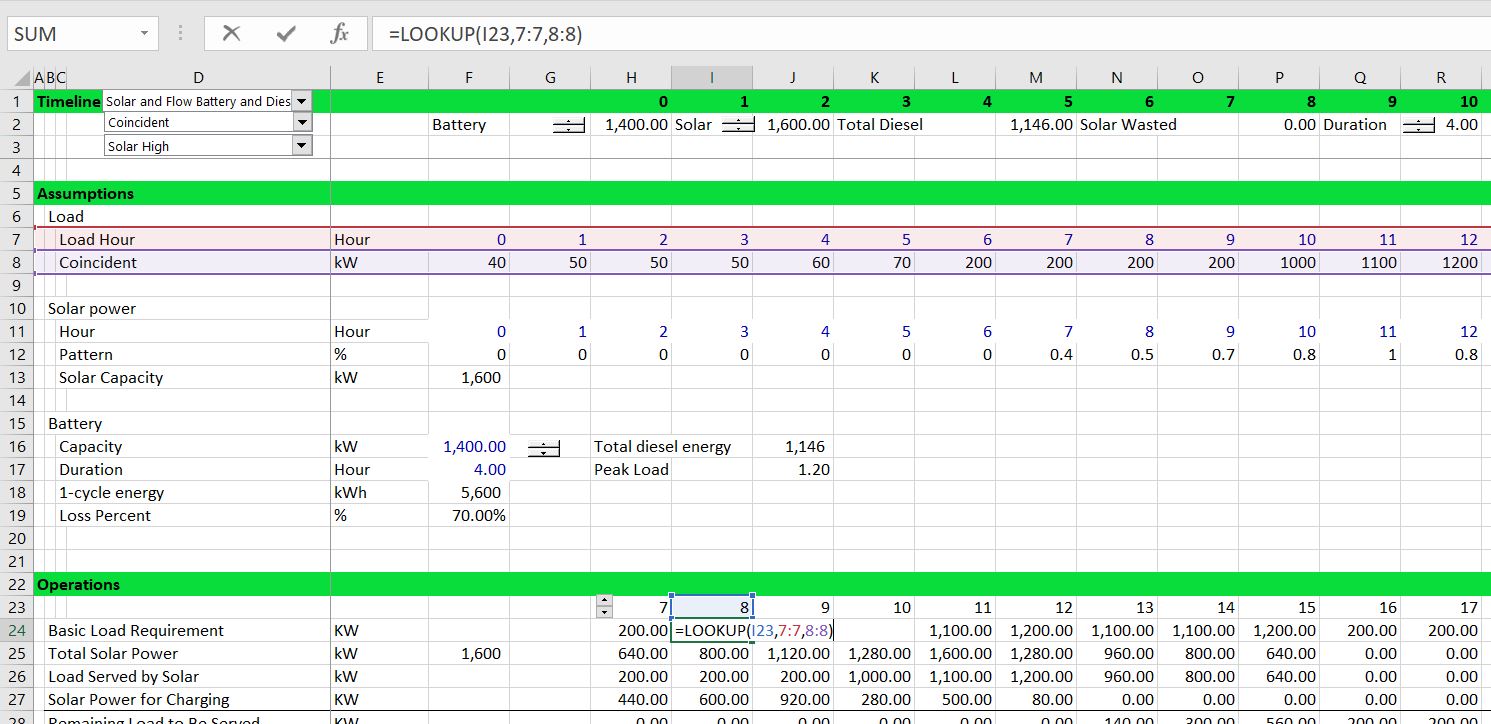
If you use typical loads for a day, the charging hours should be modelled before the discharge hours. Otherwise, if you begin with the charge hours, there is nothing in the battery to use. This means with a single day analysis, you may have to change the starting point so that it is the time when you charge. To do this you can move the time line around. For example, with solar power you should start the analysis when the sunlight during the mid-morning begins production of power and not at 1:00 in the morning. You can accomplish this using the LOOKUP function as illustrated in the screenshot below. The spinner box allows you to move the whole time line around. In the example below note how the load in hour 7 is moved to the beginning position because that is the first hour of assumed solar production.
Technical Details on VBA
The VBA code for optimisation is demonstrated below. These programs essentially replicate a data table that has many different possibilities and picks the value with the lowest cost. The first program tries different levels of set points that are adjusted until until the lowest cost set point is found.
.

Sub Optimise()

debug1 = False
Application.ScreenUpdating = False

Range("set_point") = 0
max_load = Range("max_load")
optimized_cost = Range("resulting_cost")

increment = max_load / 20
start_set_point = 0
end_set_point = Range("max_load")
Count = 1

restart:

For set_point = start_set_point To end_set_point Step increment

Range("set_point") = set_point

resulting_cost = Range("resulting_cost")

If resulting_cost < optimized_cost Then
optimized_cost = resulting_cost
best_set_point = set_point
End If

' MsgBox " set point " & set_point & " resulting cost " & resulting_cost & " Best Set point " & best_set_point

Next set_point

Count = Count + 1

start_set_point = best_set_point - increment
end_set_point = best_set_point

increment = (end_set_point - start_set_point) / 20

If debug1 = True Then _
MsgBox " Count " & Count & Chr(13) & _
" Increment " & increment & Chr(13) & _
" Start Point " & start_set_point & Chr(13) & _
" End Point " & end_set_point & Chr(13) & _
" Best Point " & best_set_point

If best_set_point = 0 Then best_set_point = 0.1

If increment < 0.1 Then
Range("set_point") = best_set_point
Exit Sub
End If

If Count > 20 Then
MsgBox " Too Many Iterations .. " & Count
Range("set_point") = best_set_point
Exit Sub
End If

GoTo restart

End Sub


.


Battery Update File