The webpages associated with this main page discuss selected issues associated with merchant power. I have tried to use historic price data to work through historic cases. I also discuss how to download historic data in a seamless manner using the workbooks.open method with specific issues associated with the different websites. I also cover some issues associated with marginal cost measurement.
Merchant prices can be used to evaluate the value of different types of power plants by summing the margin earned per kW in each hour. The process below illustrates how you could compute the value of a power plant from merchant prices.
- If you want to see the value of oil plants without trying to simulate every hour in the future, you could do the following:
- First, find a database of merchant power prices. For most markets as shown below you can get the historic data.
- Second, make an assumption for the heat rate, the variable operating and maintenance cost
- Third, find the oil price. If you have USD/BBL you can convert it to USD/MMBTU if you divide by 5.8 (you can see the convert spreadsheet)
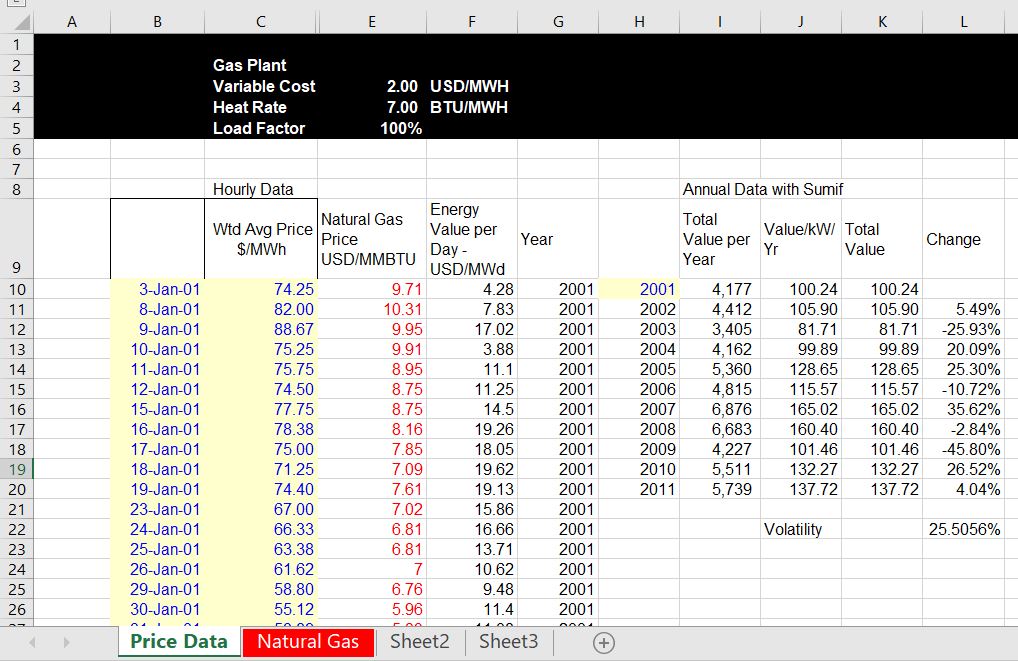
- Fourth, compute the total variable cost per MWH as the oil price per MMBTU x Heat Rate + Variable Cost
- Fifth, Compute the Margin for every single hour with the formula MAX(price – variable cost,0). Note that you could add a capacity price if there is a capacity price in the market.
- Once you have the margin per hour (which cannot be negative because of the option to not dispatch), add the margin for the entire year (use the SUMIF as explained below).
- When you add the margins for every hour, you get the value per MW per year instead of the value per MWH.
- After you compute the value per MW-year you can divide the number by 1000 to get the value per kW-year.
- Finally, compare the value per kW-year to the fixed cost. The fixed costs are discussed in the LCOE section. Fixed cost is typically stated in money (e.g. USD) per kW-year. It includes capital cost as USD/kW x CCR and O&M per kw-year.
- If the amount or the margin in USD/kw-year from merchant markets (including capacity price) exceeds the fixed cost (O&M and capital) you should theoretically build new plants. For example if the Oil margin + capacity charges is more than the oil cost, then build new plants.
- If the margin you make from markets is less than the fixed O&M on an existing plant, then you should theoretically retire plants.
Creating Simulated Supply and Demand Data from Bids
File that Contains the URL Links for Hourly Bids from the PJM Pool and from the NE ISO Websites
Simulating Prices from Volatility, Mean Reversion and Spikes
Acquiring Data on Merchant Electricity and Gas Prices from Around the World
Demonstration of How to Compute Plant Value from Merchant Markets
File that Demonstrates how to Compute the Value of a Combined Cycle Plant from Merchant Prices
I have collected electricity and gas price data from different markets around the world and publish it in a central place. I don’t think you can find this anywhere else and I have not finished the project. To make a comparison I gather hourly data and I convert all of the prices to a common currency — USD. Then to benchmark the prices in USD, the prices are compared to natural gas, oil or coal prices. The prices are tabulated in spreadsheets that can be updated with current prices from various different spreadsheets. To the maximum extent possible, I have tried to make this process easily.
The best thing would be so that you can just press a button in some excel files and get the data for a whole lot of different markets. Then you can compare electricity price volatility in different markets; evaluate the relationship between gas and electricity prices around the world; compare the level of electricity price in common currencies in different countries and regions; compute the economics of different types of new plants such as solar, wind and NGCC in different markets and many other things. You can also study fascinating cases including the California crisis, the crash in UK prices leading to bankruptcies of every plant that was purely merchant; effects of renewable energy on merchant prices in Germany; transmission constraints; effects of hydro on markets and many other issues.
To make the data comparable across the world, I have converted prices into USD per MWH so you can evaluate relative price levels in different places. (If nominal prices in local currency remain constant, but there is a devaluation in the currency, then the prices have effectively declined.) Once you have the electricity market price data you can compute the profitability of different plants if you download commodity energy prices that are often reported in USD. For example, you can sum the value that a solar project would earn in different markets through some assumptions about the timing of electricity production during the day and during the season. When you sum this over the year, you can derive the USD per kW per year. This amount can then be compared to the fixed cost per kW per year (see the LCOE page). I have also tried to compare the prices of electricity to the price of gas, oil or coal. For a dispatchable thermal plant this is essential and it demonstrates that around the world, the prices of electricity are related to the price of natural gas.
One of the best things about comparing detailed historic data from different markets is the wonderful case studies that can be evaluated. These case studies include: Price spikes and valuation of capacity in Australia; the California crisis with outages, hydro changes and market power; price spikes in the Midwest U.S. that prompted overbuild of peaking capacity; effects of capacity increases in U.K. and New England and the long-lasting effects of surplus capacity; effects of transmission constraints and renewable capacity in the Northwest U.S.; declines in electricity prices driven by gas prices and renewable energy causing one of the largest bankruptcies in history in Texas; changes in prices in Philippines and Turkey that move prices closer to worldwide levels; and prices in Nordpool that are less related to natural gas prices because of hydro energy.

Different markets have different challenges in terms of retrieving data. The UK has been the worst and some markets such as Nordpool are very transparent (luckily, you can now get UK prices from Nordpool). For Nordpool, you can just copy urls to a spreadsheet and use the WORKBOOKS.OPEN statement to automate the process. Australia has transparent data and some markets in the U.S. are better than others. In other markets such as Turkey and the Philippines you have to use a more manual approach. On this page I include files that have historic electricity and gas prices as well as a description of how to update the data. You should be able to update the data yourself if my instructions are anything close to reasonable. But if this is difficult, you can just use the files and look at the last update.