This page demonstrates how important financing cost and financing analysis is in battery and solar analysis. The price that is required to provide investors a given return is computed using a carrying charge rate. I explain how the carrying charge rate is driven by many factors including the construction period, the credit spread, the equity return, the debt to capital percent, the tax rate, the decommissioning and inflation rates. All of these factors can be expressed in a single number that assumes real prices remain constant over the lifetime of the investment. Both batteries and solar power are highly capital intensive with low operating costs relative to up-front capital costs. This means the carrying charge rate and cost of capital is a major driver for the analysis.
While the carrying charge is a single number, there is really an entire project finance model underneath the carrying charge rate. The discussion below demonstrates how you can reconcile the carrying charge rate with a project finance model. With the reconciliation, you can then quickly change factors such as the rate of return, the credit spread, degradation, etc. and compute the required price need to recover the cost of capital investment. Computing the carrying charge rate is particularly important for battery and storage analysis where there are different parameters for the battery and the solar panels.
Excel files that includes the carrying charge analysis are available for download below. The first file focuses only on the carrying charge rate, where you enter inputs for the carrying charges at the top of the file. A full project finance model that reconciles the carrying charge with the resulting return for equity investors is demonstrated in the second part of that file. The second file available for download is the file that includes solar and battery storage and uses the carrying charges to compute the prices for solar and batteries.
Illustration of Effect of Carrying Charge on Solar and Battery Costs and Capacity Optimisation
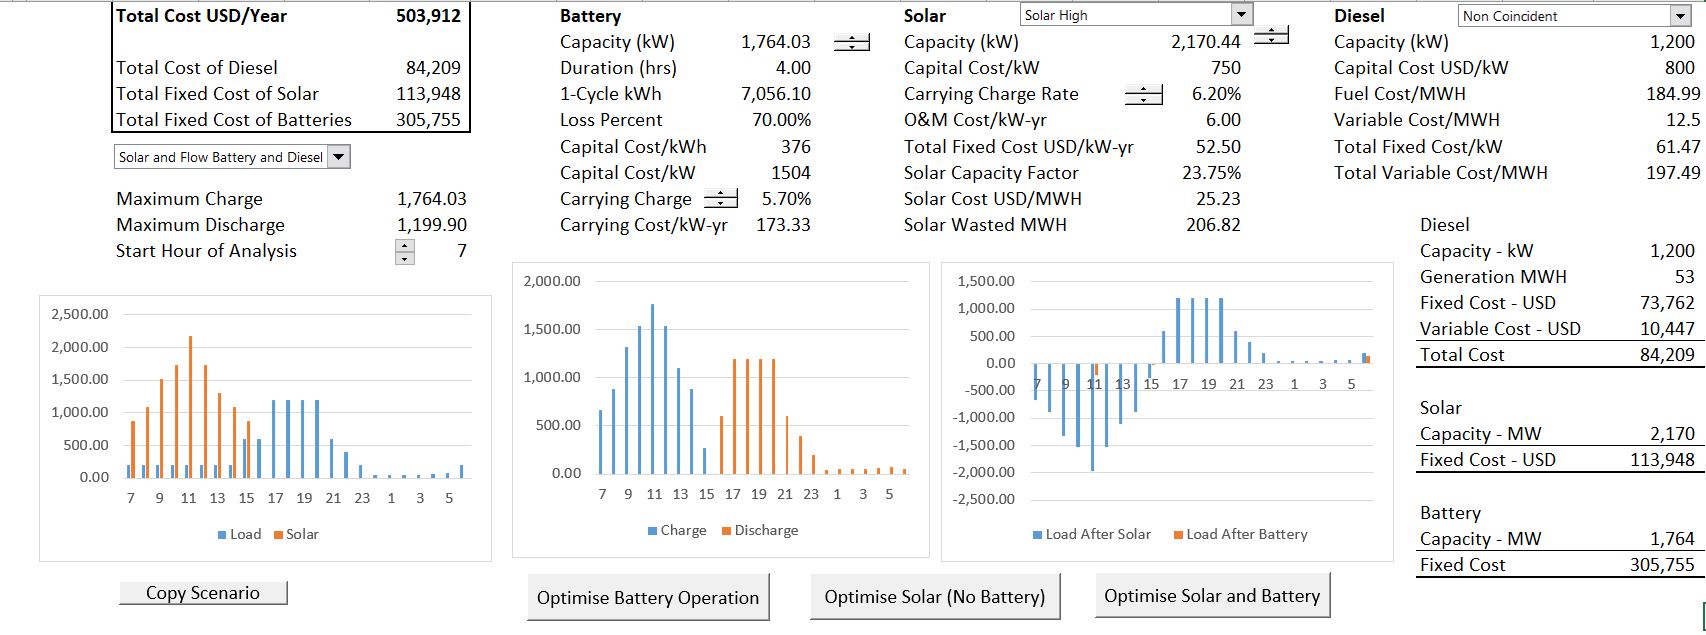
To introduce the importance of the carrying charge rate, I have used the microgrid analysis of solar, battery and diesel with different carrying charge rates. I demonstrate the result of optimising solar and batteries in two cases. One case has a high carrying charge rate and a second case has a low carrying charge rate.
If the carrying charge rate for the battery is low, then a lot of both battery and solar capacity can be justified to reduce the cost of diesel. When you press the button to optimise, a 2,170 kW of solar and 1,764 kW of battery capacity is added to the microgrid as shown in the screenshot below.
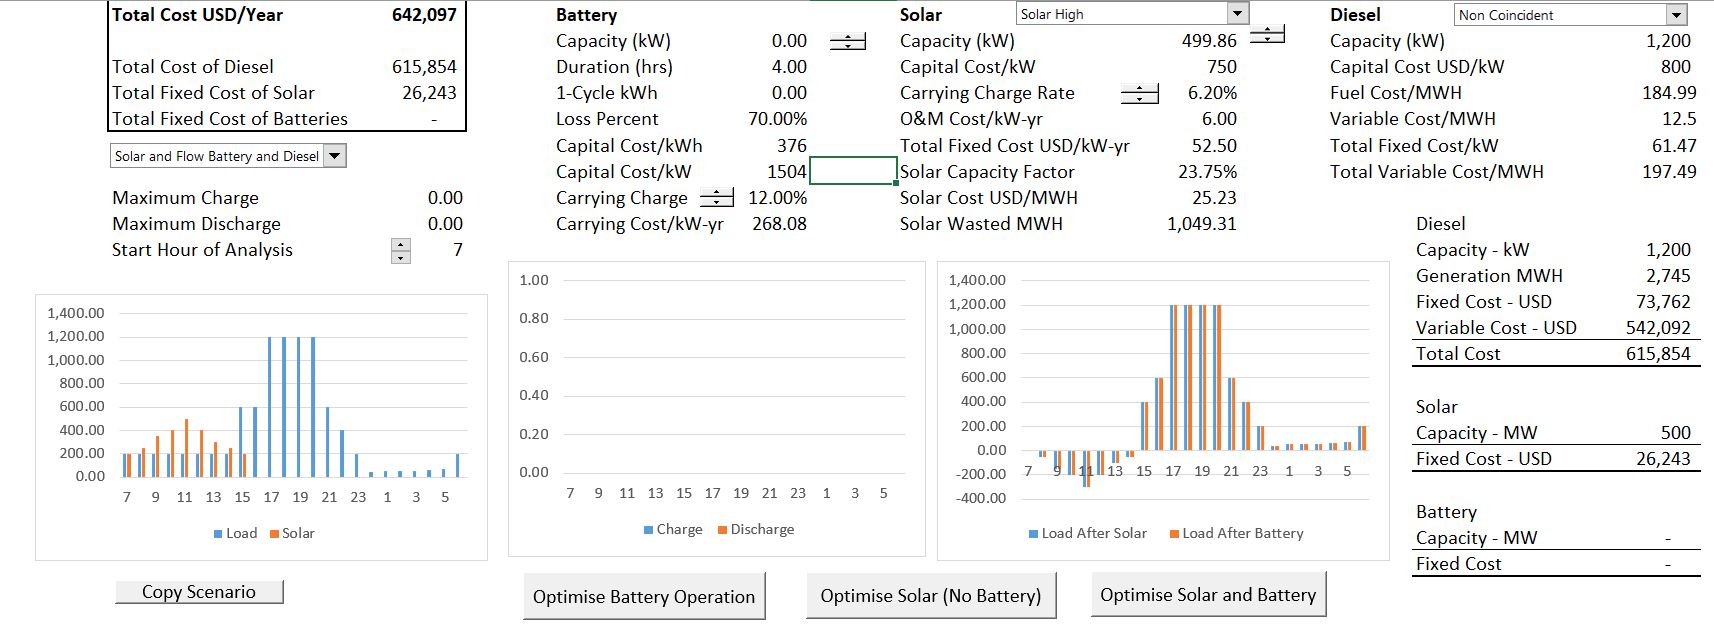
A big issue with batteries is that the if the lifetime of batteries is short and/or degradation is high, the carrying charge on the battery can be very high. The second screenshot below demonstrates that same case as above with higher carrying charge rates. All I did is use the spinner box to change the carrying charge rates and then re-optimise the amount of battery and solar capacity. In this case, neither the battery nor the solar is economic. The carrying charge rate that spreads capital costs that are paid in a single year to the remaining life of the project. In this case with higher carrying charges, the battery increases cost and is not justified economically. Without the battery, the high level of solar power capacity can also not be justified. This means with the high carrying charge there is a cascade of negative effects. Note that the cost of the microgrid system increases from 503,912 to 642,097.
Carrying Charges, Prices and Returns in Financial Models
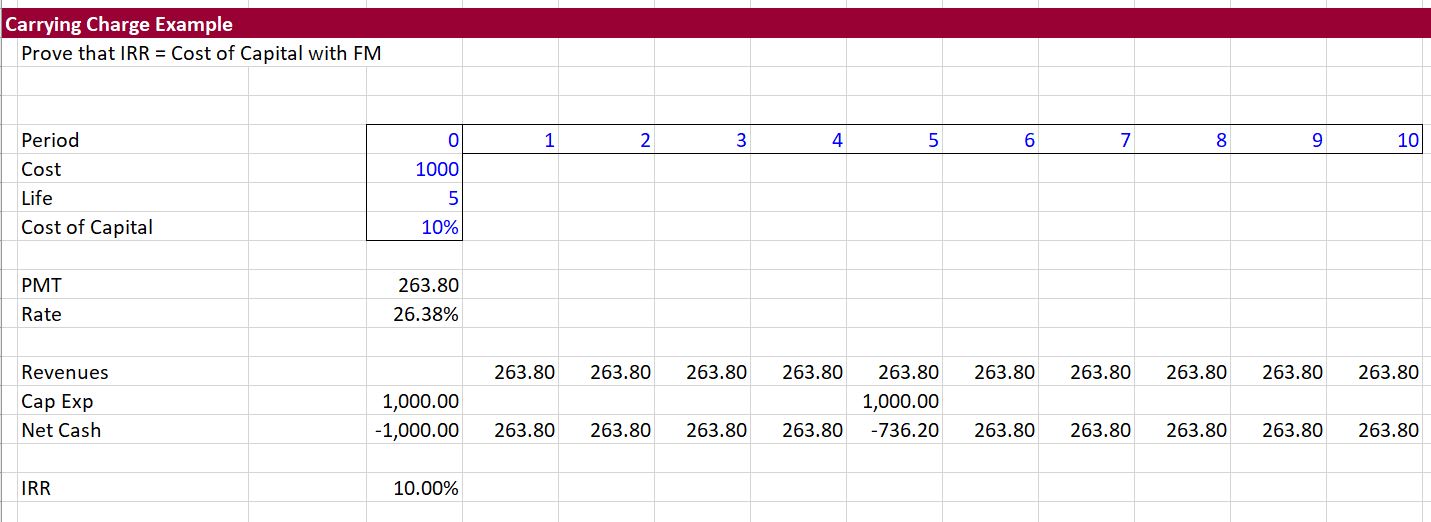
The relationship between the price computed from a carrying charge rate and a financial model is illustrated in the screenshot below using a simple case. The carrying charge is computed using the PMT function with a five year project life and a cost of capital of 10% is computed to be 262.8 (without inflation, taxes, debt, degradation, decommissioning and other items). In this case there are two investments over five years. The screenshot demonstrates that the carrying charge using the PMT function results in correct revenues to produce the required return of 10%.
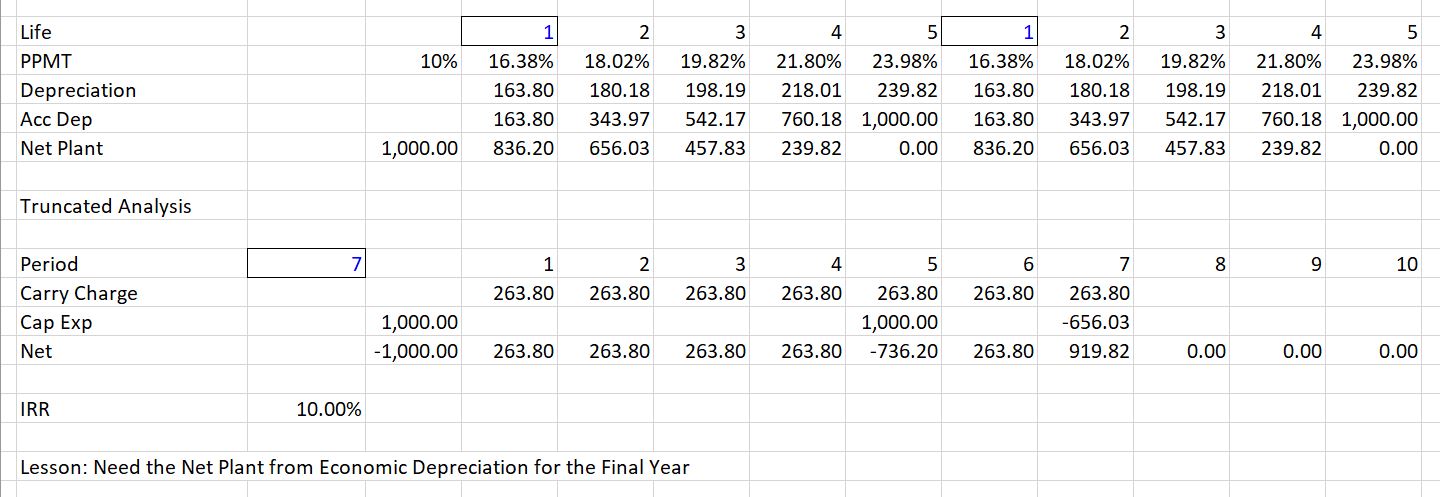
With batteries and storage it is probable that lifetime of the battery will not be the same as the lifetime as a solar project. In the screen shot below I demonstrate a case where the life of the solar project is assumed to be 7 years. As the battery has a life of 5 years, two batteries must be installed. The second battery will be sold (or used elsewhere). This means that you must reflect the residual value in the financial model that reconciles the carrying charge rate with a computed IRR. To compute the residual value, you should use the section that contains economic depreciation as illustrated in a simple way on the screenshot. Note that value after economic depreciation is 656 in year 7. With this value used in the cash flow analysis (the financial model), the financial model is adjusted and yields the correct 10% return.
Verification of Carrying Charges and Financial Model
In this section I demonstrate how the carrying charge rate reconciles to a financial model. I begin with a very simple case of adding solar power to retail rates and show that the target return used for carrying charge analysis produces the same return as the cash flow in a financial model. I then demonstrate that this carrying charge analysis remains in place for more complex situations with multiple battery investments, residual value, taxes, debt financing and degradation.
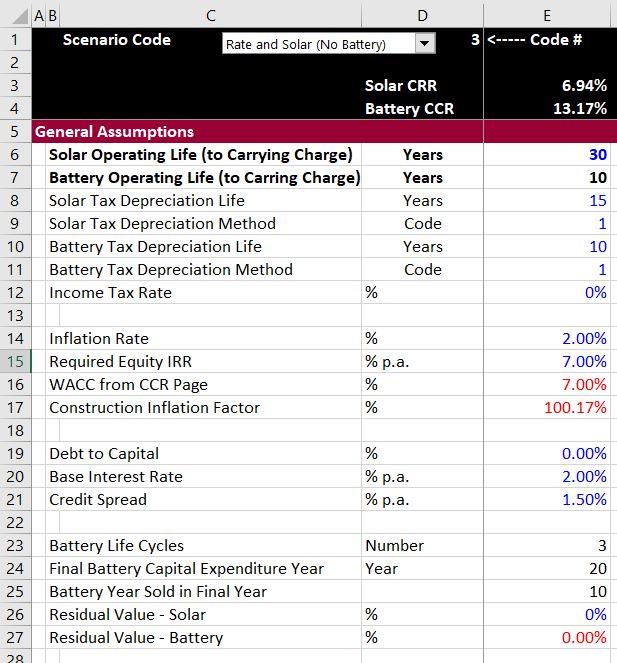
The first screenshot below shows how you can enter assumptions that apply both to the carrying charge and the financial model. (This is from the retail rate and storage model that you can download from the second button at the top of the page.) In the first case, simple assumptions are applied with no debt, no residual value and no taxes. When you change assumptions on this page, the carrying charge rate changes and the financial model inputs are adjusted. Please note that the colours are made in seconds from the generic macro file. I beg you not to waste time colouring.
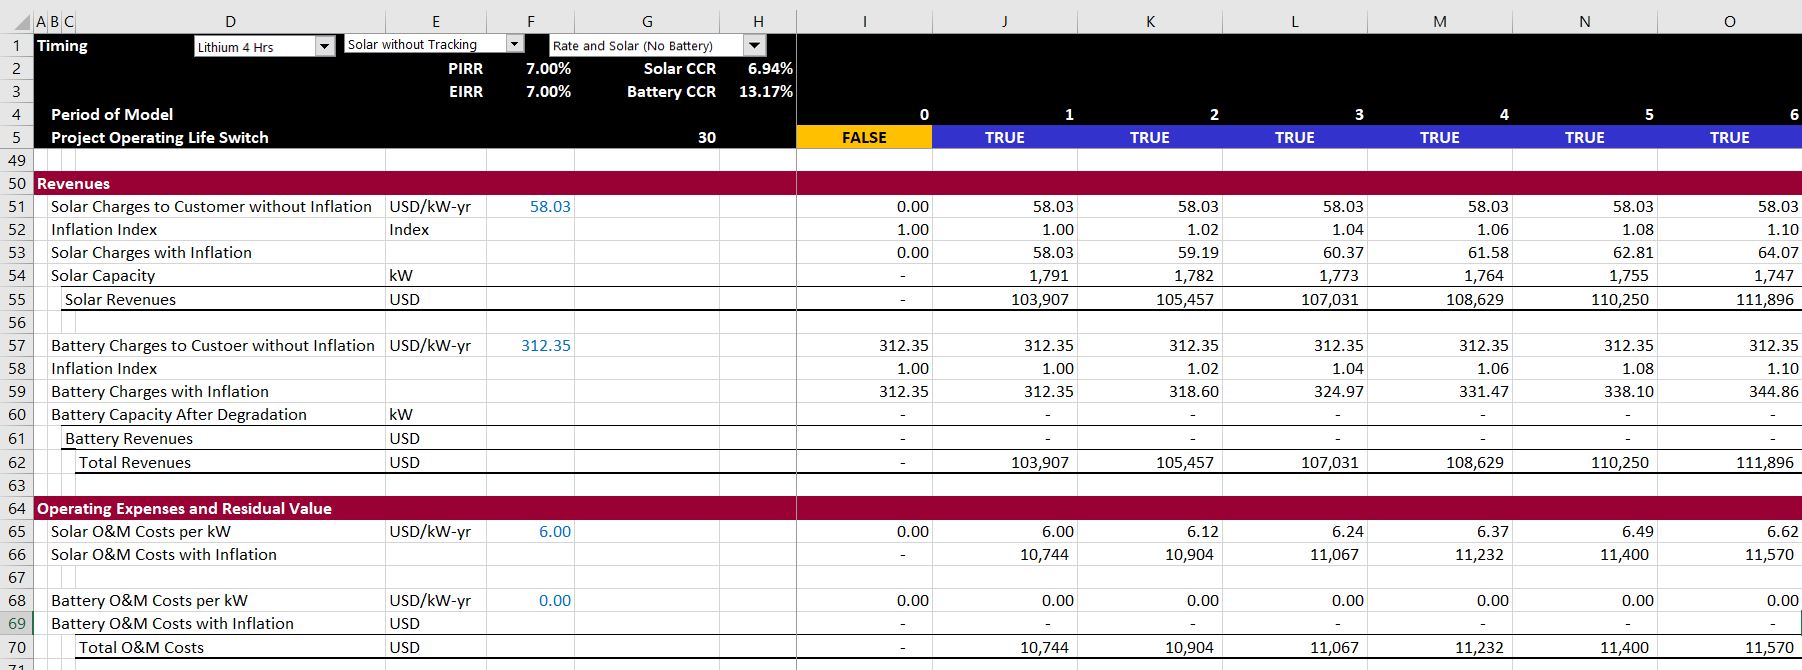
With these assumptions, the financial model in the case with only solar is shown. This is an excerpt where inflation and degradation are illustrated for the solar charges. The important thing to note is that the project IRR and the equity IRR are the same as the target return of 7% that is input.
Videos Explaining Carrying Charge Rates
The first video introduces general concepts that underlie carrying charge rates.
[wonderplugin_video iframe=”https://www.youtube.com/watch?v=z9s06nXh7U4″ videowidth=600 videoheight=400 keepaspectratio=1 videocss=”position:relative;display:block;background-color:#000;overflow:hidden;max-width:100%;margin:0 auto;” playbutton=”http://edbodmer.com/wp-content/plugins/wonderplugin-video-embed/engine/playvideo-64-64-0.png”]
[wonderplugin_video iframe=”https://www.youtube.com/watch?v=9uh8ZN_SHN4″ videowidth=600 videoheight=400 keepaspectratio=1 videocss=”position:relative;display:block;background-color:#000;overflow:hidden;max-width:100%;margin:0 auto;” playbutton=”http://edbodmer.com/wp-content/plugins/wonderplugin-video-embed/engine/playvideo-64-64-0.png”]
[wonderplugin_video iframe=”https://www.youtube.com/watch?v=n3MWZvnleWg” videowidth=600 videoheight=400 keepaspectratio=1 videocss=”position:relative;display:block;background-color:#000;overflow:hidden;max-width:100%;margin:0 auto;” playbutton=”http://edbodmer.com/wp-content/plugins/wonderplugin-video-embed/engine/playvideo-64-64-0.png”]
[wonderplugin_video iframe=”https://www.youtube.com/watch?v=ho2RnSHOWfk” videowidth=600 videoheight=400 keepaspectratio=1 videocss=”position:relative;display:block;background-color:#000;overflow:hidden;max-width:100%;margin:0 auto;” playbutton=”http://edbodmer.com/wp-content/plugins/wonderplugin-video-embed/engine/playvideo-64-64-0.png”]