The first part of the project finance A-Z course just reviews some modelling principles and philosophy including being lazy with excel formulas; looking at some bad practices in other models; creating efficient and flexible time lines; structuring a project finance model; incorporating accuracy checks, insuring equations are easy to understand and discussing some project finance theory. I begin the modelling discussion by making some suggestions on what not to do (I label these as impeachable crimes). As a historian of project finance models (I will later make a webpage on the exciting history of project finance models), I suggest the recent application of bureaucratic rules (FAST/SMART) have recently resulted in horrible models that have absurd amount of rows and can be anything but transparent, flexible or structured. When you have to call your modelling consultant to make a new scenario or change the model, the model is a complete piece of crap and worthless. I complain a lot in the discussion below and I have written this page as a therapy while I have had the horrible task of restructuring models to remove the bureaucratic rubish .
I start with a time line discussion is one of the keys to making a model and which has become a disgusting practice. When discussing time lines, I suggest a single master time line that with monthly periods pre-COD and semi-annual or quarterly periods post-COD. I also included a couple of files that you can use to prove if certain practices make a file “heavy” in this page and I demonstrate that there is no cost to using entire rows with LOOKUP. As I am old, I have looked at a lot of models and I have opinions on what are better and worse models for analysis (good models are well organised and easy to read and do not have merged cells, changing formats, too many repeated lines and macro buttons). In the file that you can download by clicking on the button below, you can test whether an excel practice of clicking on an entire line slows excel down or makes your file larger. The answer is that using an entire row or column with LOOKUP and/or INDEX does not. Files associated with the video that prove the size and the time issues can be downloaded by pressing the buttons below.
Excel File that Tests Size and Speed of SUMIF Function with and Without Using Entire Lines Input
Excel File that Tests Size and Speed of LOOKUP Function with and Without Using Entire Lines Input
Power Point Slides that Accompany Project Finance Modelling A-Z Analysis and On-line Course
I am creating these exercises for a course I am teaching so that participants can review the subjects and test their knowledge. The very nice person who arranged the course also asked me to include some modelling behaviours that are disgusting. In the exercise below I hope that you see these practices have been avoided. I have also discussed these practices in more detail on the A-Z page that is linked to this sentence. The only excel function to use in the first example is the LOOKUP function (VLOOKUP and HLOOKUP are illegal). En francais, cette function est RECHERCHER. I have included a sheet with bad practices so you can correct them.
Instead of FAST, SMART or FART you Should Apply Two Rules — Be Able to See Everything with F2; and Finding any Source Variable with CNTL [ and F5
Modelling is a creative process, it is not about typing fast in excel or following some kind of rule. You want to make your model sensible from a . What good does it do to find the source variables with using the mouse and the blue arrows.
High Crimes and Misdemeanors in Project Finance Models (All of Us Have Been Guilty)
All of the financial modelling companies seem to have their blah, blah, blah acronyms and rules. I have no doubt whatsoever that these bureaucratic rules have let to models which are not easy to work with and are very difficult to understand and change. My guiding principle is to put yourself in the shoes of somebody who is reading your model for the first time. You want the user to say “I understand what you are doing and where the numbers are coming from.” For what it is worth, here are my rules. I don’t tell you what to do; I provide a few suggestions on what you should generally not to do. I tell you this because I have made all of the mistakes and I have stole ideas from many other models. After making mistakes, I believe a few excel practices really work. But one of my biggest complaints is paying too much attention to the rules and applying so-called best practice rules. A friend of mine (John Cassidy) who died in 1982 used to keep quoting the line that “foolish consistency is the hobgoblin of a petty mind” and I think this applies to my comments below. There may be exceptions to all of rules I discuss below and concentrating too much on bureaucratic rules is the worst rule to break.


- Obviously, no hard-coded numbers after assumptions in the model. This is a clear crime and an even worse crime is mixing a formula with hard coded numbers like F5 * 1.02. The first can be solved with F5, paste special, constants or with Generic Macros. The second problem is more difficult to find and mark with colours. To see how to use the F5 method with a little macro, go to the short-cut page.
- Not putting driving factors in the left column, fairly obvious. Why in the hell do people not put the driving factors in the left column before the period by period formulas. I want to see what items drive the equation without looking at formulas that have references to other sheets in the model. See the example below if you are worried about putting titles on the driving factors.
- Not making formulas the same across columns, another obvious one. You can make the formulas the same across the columns with TRUE/FALSE or 1/0 flags, or whatever you call them. But don’t go crazy and not allow a starting point for things like inflation indices. Remember, being too bureaucratic about this stuff is about the worst thing you can do.
- Wasting time on meaningful or meaningless colours is one of the most irritating things I have to put up with
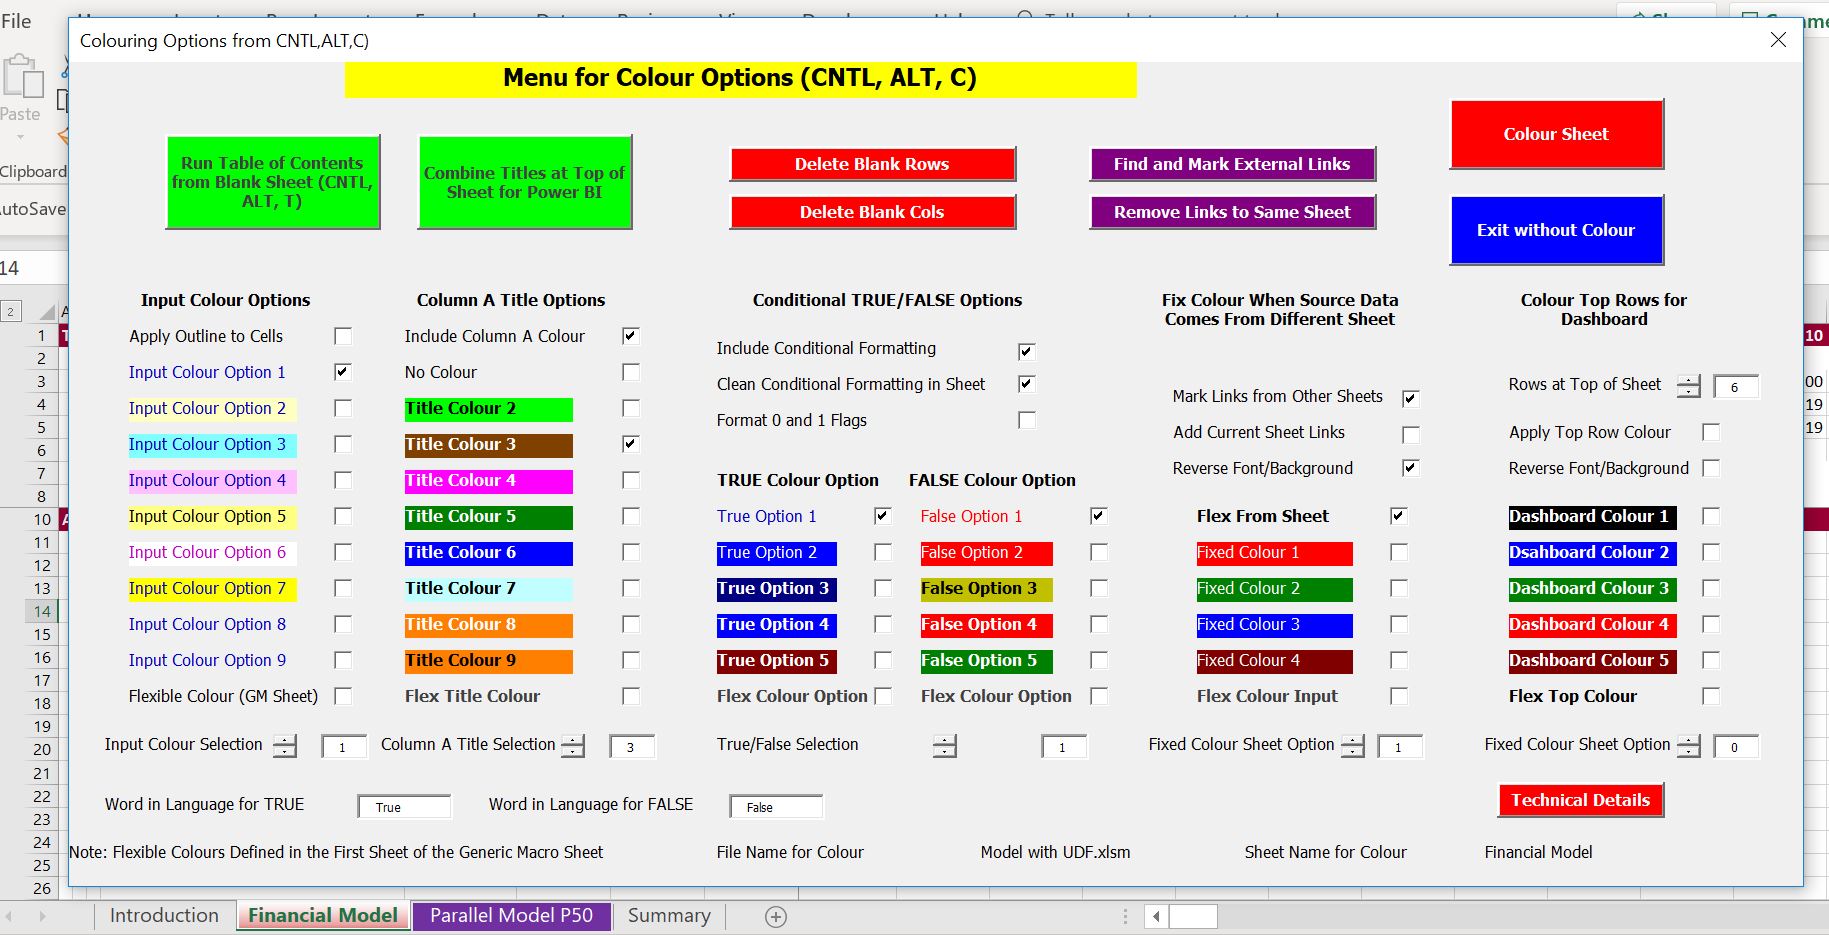 when I watch people make a model in excel. That is why I made the colouring page that allows you to find the location of other sheets and stop wasting time. Go to the link attached to this sentence to see the new stuff in generic macros.
 - Use IF instead of MAX and MIN functions to connect the cash flow with the debt schedule. There is always a direct or indirect connection of the debt schedule with the balance sheet — no cash flow and no debt repayment. The MIN and MAX (never IF statements) should be in the cash flow waterfall and not in the debt schedule.
- The Assumptions should be in the same order and structure as the model and they should make sense. Some models should begin with operational cash flow if it is possible to size the debt from the CFADS with sculpting. In other cases you may start with development costs and capital expenditures if debt is set from a debt to capital ratio.
- Putting too many flags, masks, switches (whatever you want to call them) in a separate page instead of where they are used right next to the calculations. Flags or switches or masks are wonderful. They are digital. They turn things on and off. They are a necessity in a project finance model. It is not necessarily bad to have a separate page of flags, but if you are going to use them, put them right next to the place they are used. Do not multiply some number by a flag in a different page. Why force people to make silly traces with those blue arrows to find things that are driving the model (even if they have a fancy add-in).

- Placing the forecast financial statements at the beginning of the model. Structuring is the biggest deal of FAST and other blah, blah, blah acronyms. Structure comes from my hero, Merton Miller who won a noble prize for suggesting that financing should be separate from operations. You should begin your model with pretax cash flows, after-tax cash flows that have no debt. Then you can move to construction financing with a summary sources and uses, then debt sizing, debt schedules with repayment and interest and then, finally the profit and loss and the cash flow statement (the flow should be natural). You can put the statements at the beginning, but the calculation is made after the other stuff.
- Splitting up pages when you are designing the model instead of letting the model smoothly flow down a single page. I even think you should leave the model on a single page after you are finished and not split it up. Please put yourself in the position of somebody trying to understand the model. Your model should have a natural flow and it is so much easier to follow a model on a single page. Use little columns on the left so you can see the structure of the model.
- Deceiving yourself that you are smart because you make a long and complex formula. Use of formulas that are too long is inexcusable and always avoidable. The key to making models transparent is separating formulas and making them short.
- Please no bullshit excel stuff. Don’t ever merge cells; no silly and useless macros to go to sheets; no useless pages with currency lists; one good graph on debt service and cash flow and not twenty useless graphs or no graphs; no hour by hour data with OFFSET when this is not necessary. These are things that I have gone crazy about in reviewing models. You can see some of the excel stuff that is not impressive at all at the bottom of this page.
- Showing off your excel prowess by applying unnecessary functions. You can do just about everything with three excel functions — LOOKUP, INDEX and SUMIF. LOOKUP is more efficient and easier to use than INDEX, MATCH and OFFSET
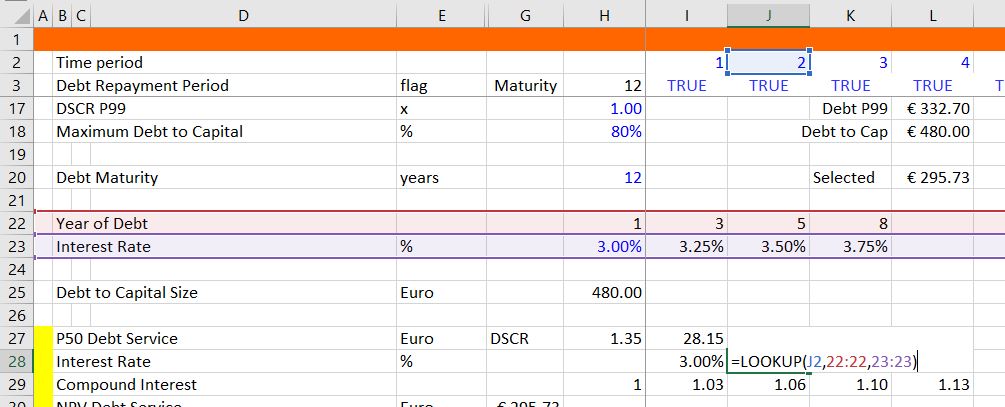 is unnecessary. When you use LOOKUP please click on the entire lines rather than wasting time fixing cells.
 - No formulas in the balance sheet. When you make a model all or the balances for debt, DSRA, net plant and other things should be in various structured sections of the model. The only balance that is not there in your model is the equity balance, which you should compute after the Formulas in the balance sheet rather than links to closing balance
- Don’t go overboard to show off your auditing skills. Use TRUE/FALSE switches for checking the balance sheet, debt balances and circular references, but you do not need to go overboard. I do think it is good to put sums in a column and check things as your are making your model.
- Don’t pollute your fundamental models with multiple scenarios. Put the scenarios in a separate sheet (except P99 or P50) and let the scenario sheet be a mess with the index function and code numbers.
- Don’t make summary sheets complex. A simple rule is that output sheets can be deleted without affecting the model. This is pretty obvious that you do not want to mix outputs and inputs. Put your summary on one page so you do not have to look around. Include IRR’s, DSCR, LLCR, a graph of cash flow versus debt service, a sources and uses summary and key drivers such as capacity factor, cost per kW, levelised O&M cost and the plant capacity. Then you can even call it a dashboard if you need to.
- Don’t use the NPV or XNPV formula when interest rates are changing. Use a compound factor when interest rates are not constant and then compute the present value with the SUMPRODUCT function where you divide the cash flow by the compound factor.
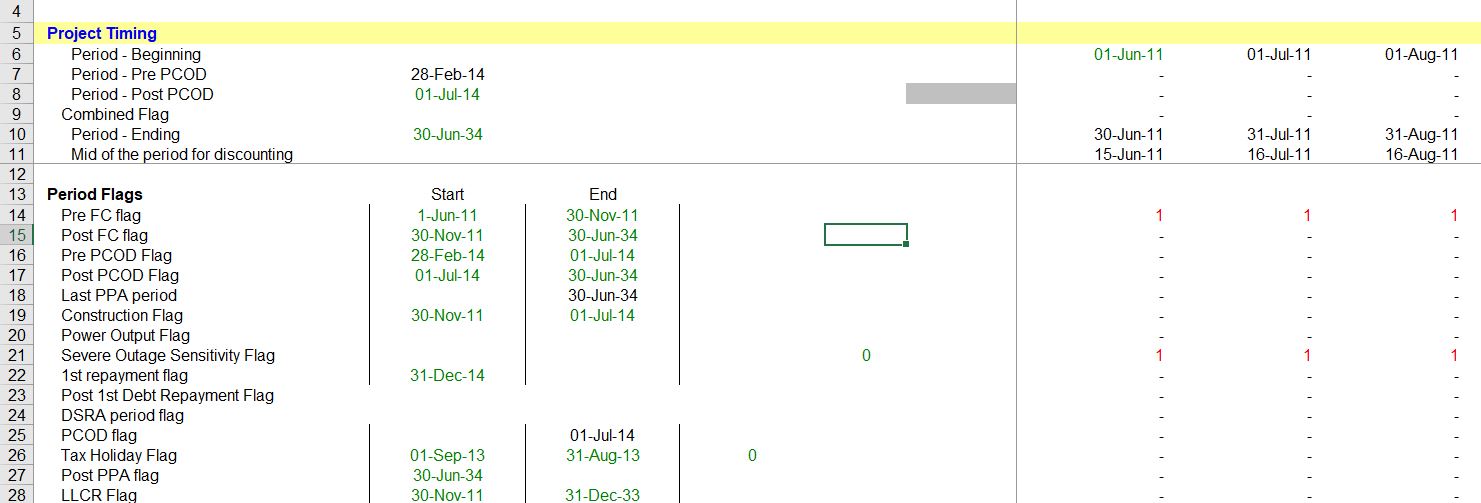
- Putting fourty flags in a separate sheet sucks. You need an construction phase and operating phase at the top of your single sheet. But do not put too many of them at the top of a separate sheet (this will be very controversial for the dushbags who believe they are following some kind of best practice standards like SMART). You can certainly have a page that carefully works through time lines and maybe even have different time lines on different pages. But for the flags associated with debt repayment or contract length should be right next to where you are going to make the calculations.
- Find a good style and don’t listen too much to me. I like the positive number convention. I like the using underlines for key items. I like using thin columns at the left and then reserving a lot of columns before the model starts for drivers.
- Take the side of Anti-Range Namers. The range name controversy could be a subject at an excel party that you may have on a Saturday night. There should not be an argument. Except for macros, and a couple of minor things range name suck. Some companies try to make you put range names in excel cell. This adds a log of time and if you have simple formulas, it adds nothing to the accuracy or transparency of a model.
- Don’t chimp on sub-totals in the cash flow waterfall. Sub-totals are important in cash flow waterfalls so that you can use MIN and MAX functions. Connect the debt schedule with the sources and uses and also the cash flow waterfall. I believe (and I am in a minority) that you should keep the accounts that will be connected to the debt schedule in the same page as the . Why would you make people search for basic and obvious links.
- When using the goal seek tool, use the NPV = 0, rather than an IRR difference equals zero. When, the IRR cannot be computed, the goal seek can go crazy like we all know. As you know when the NPV is zero, the IRR is the discount rate. It is much better to use the NPV rule.
- Don’t compute the project IRR from CFADS. That is a basic mistake in finance theory; instead compute the project IRR before any finance equations are in the model. The project IRR is supposed to measure the IRR that would be realised by investors if there was no debt financing — meaning no IDC, no fees, no tax effects of interest, no DSRA, no L/C fees etc. Make this computation before you make the debt calculations.
- Work on the nightmare blue lines from circular references last. While working on your model, try to avoid circular references by doing things like using EBITDA instead of DSCR and construction expenditures instead of total funding uses.
- Don’t Make a Crazy Complex Set of Inflation Indices. It is really irritating to work through many different inflation indices with daily compounding and waste a lot of time checking the numbers. Just keep the inflation consistent with exchange rates and interest rates and make it simple. I am writing this because I am so pissed off about having to review four long sheets of different inflation indices for many items that are not even consistently computed. This is real fortune telling and worthless modelling.
- If using the mouse with the blue find precedent and find dependent arrows is used to find sources from other sheets is necessary or helpful, then you model sucks. Instead, using ALT, D, M should be good enough.
- Add items instead of using the SUM() formula. In case you have to move things later on, when you use the SUM() function with a lot of items it can cause a problem
.