This page documents a file that allows you to compare massive amounts of data for different countries in an effective and simple manner. You can compare series ranging from GDP per capita to population to debt to GDP to credit spreads in the country. You can change countries that are presented and show the data in terms of absolute amounts, indices or percent changes. In short you can effectively compare a large number of time series variables across countries.
The file below goes to the St. Louis Fed and reads data for different countries. The file includes many variables and countries allowing you to compare GDP per capita and many other variables ranging from population age to banking statistics, exports and inflation rates. The process works by changing URLs from the St. Louis Fed. In this file there are a number of error checks and there is even an error check list because there are so many sheets. As some variables are repeated in the FRED database, there are also provisions to use alternative data sets from the data set.
By downloading the file attached to the button below, you can select amongst many variables ranging from GDP per capital to population to Government Debt to GDP. The discussion below explains how the update this file; add other countries to the database; add other variables to the database; and use the data to make analysis. The most painful part of the process is finding the data. Then, you can use the INDIRECT function, but this can be a very slow process.
.
Introduction to Country Database File
The screenshots below illustrate the types of information you can analyse with the country database file. If you open the workbook and go to the spreadsheet named “Chart of Series by Country” you can play with the graphs. This is the main output of the database. If you go to the spreadsheet named “Database of Series” you can get the data that is recorded in the FRED database.
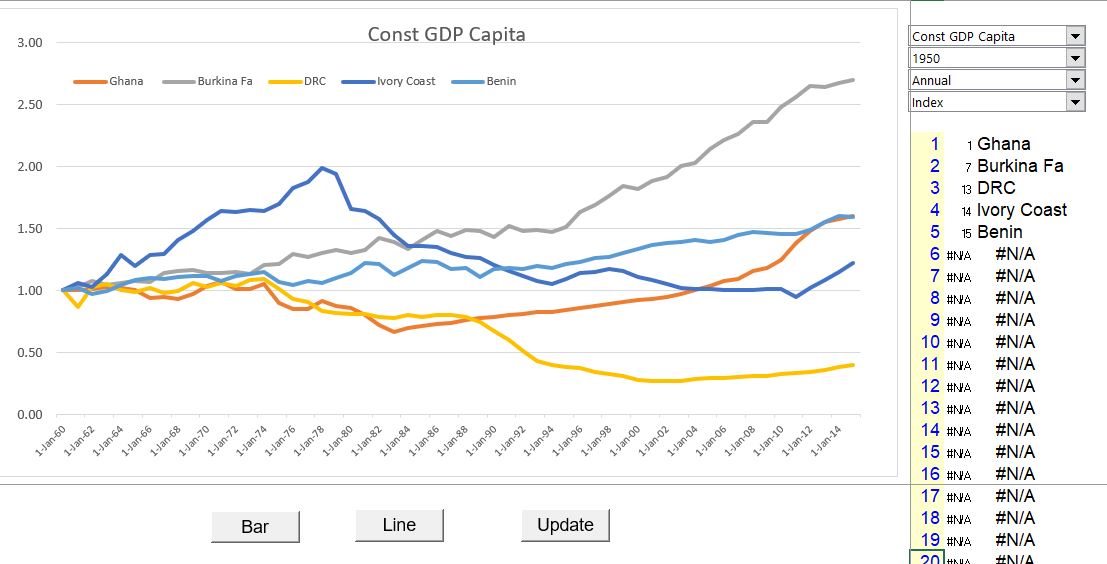
Some of the different ways you can look at the data are illustrated below. The first example shows a few countries from Africa in terms of GDP per Capita (real USD). In this example, I selected the INDEX option and began in1950. From 1950 the Chart shows that Burkina Fasco had the highest growth.
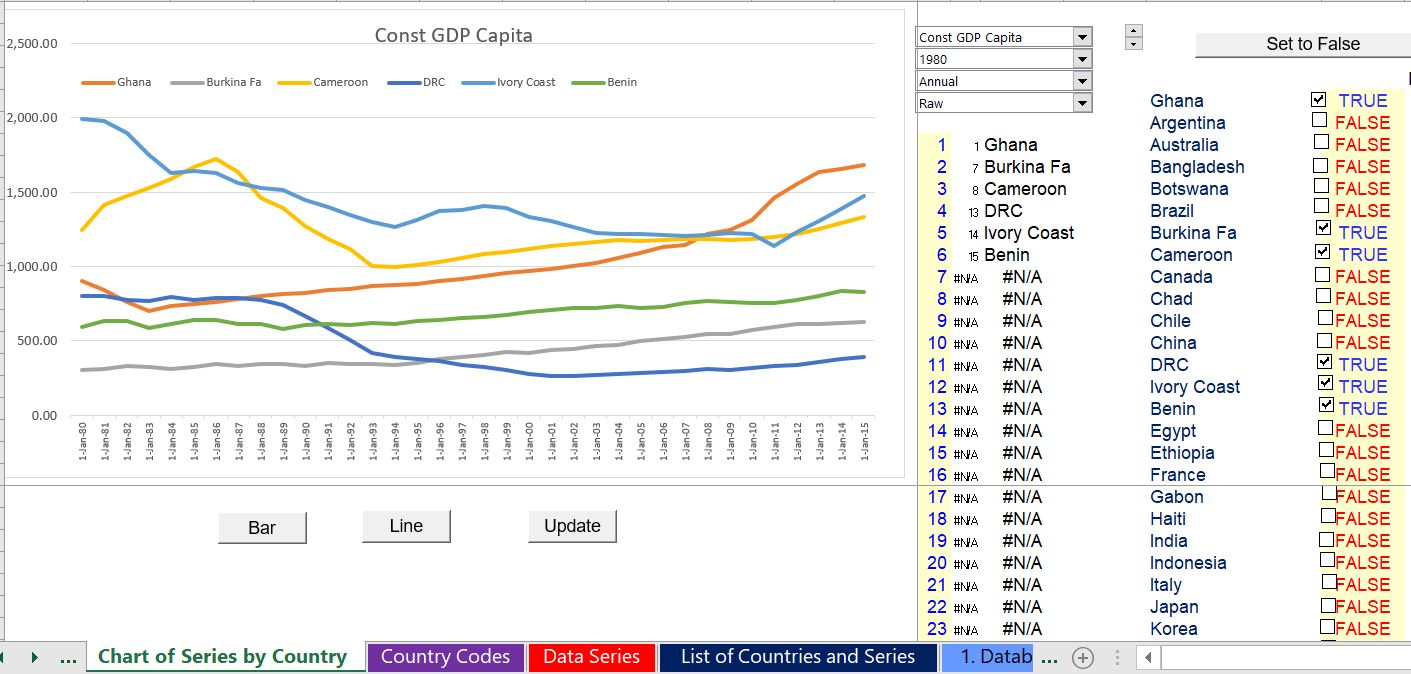
In the next example, I changed the start point to 1980 and show the absolute level of GDP per capita. Also, I added Cameroon. I am always on the sheet named “Chart of Series by Country.” To get the added country on the chart, you need to press the “update” button.
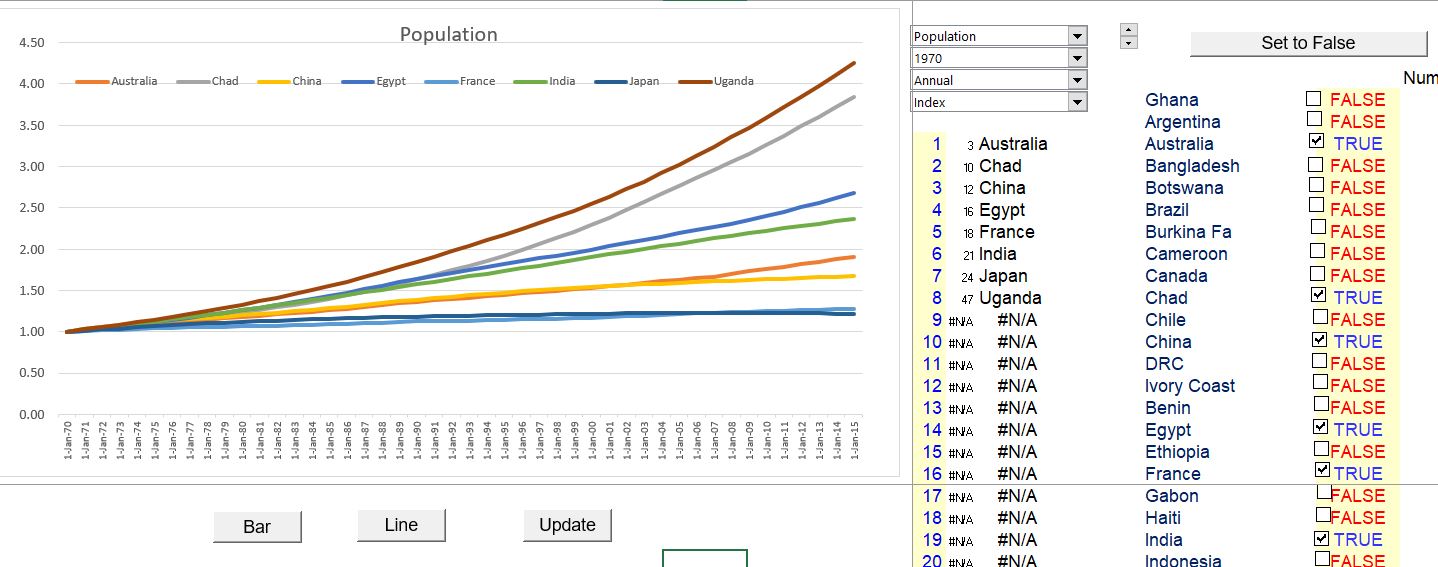
In the next slide, I select different countries and present the growth rate in population since 1970. First, you can press the button for set all to false. Then you can select new countries. I have selected Japan, China, France, Uganda and some other countries. When selecting population you should select the first population option.
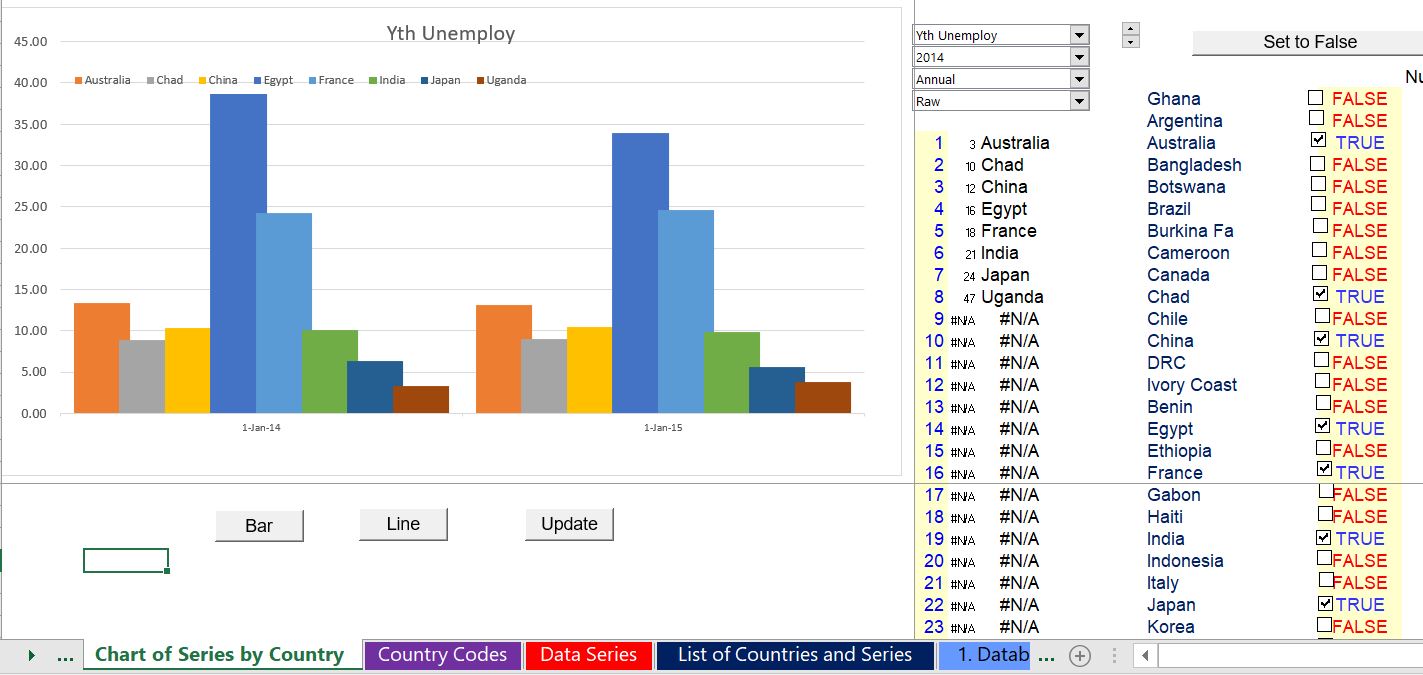
The final example is the case of youth employment. In this case there are fewer years of data. Here, I clicked on the bar chart option.
The video below that describes how to get the data compares presentation in excel and presentation in Power BI.
Reading New Data and Updating the File without Changing Countries or Data Series
Let’s say a year goes by and you want to get new data. To make a new file, you go the the sheet named “URLs” and do the following. First, copy the sheet to a new name in case something goes wrong. Next, you go press the clear data button. This removes all of the individual sheets. Then you press the button to read data and wait a long time (it is good to do this before you go to bed).
Video Explanation of Country Database
The video below that describes how to get the data compares presentation in excel and presentation in Power BI.