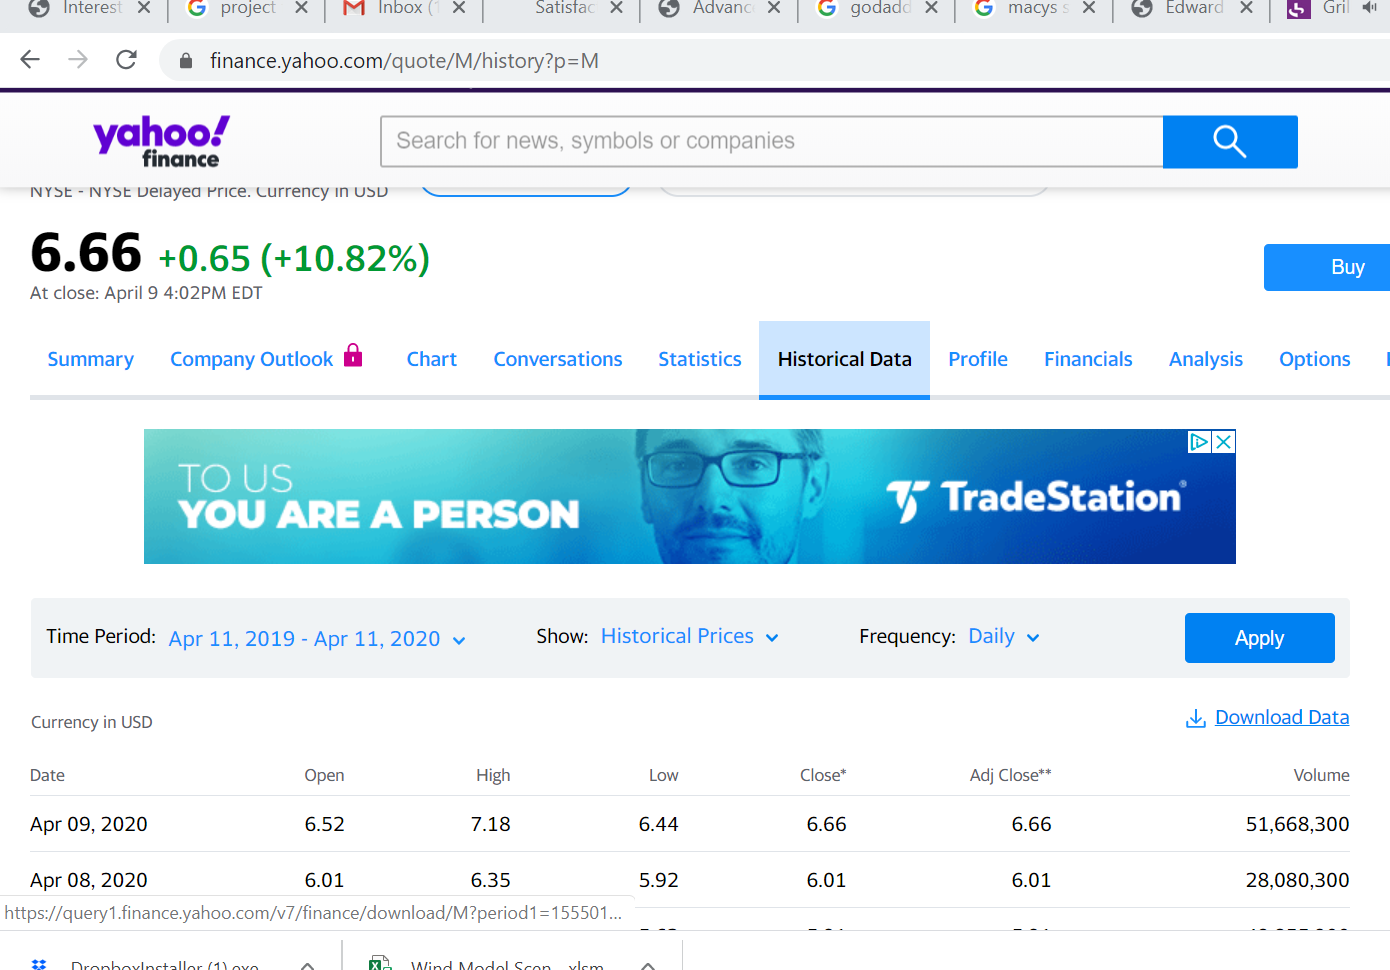
https://query1.finance.yahoo.com/v7/finance/download/M?period1=1555019456&period2=1586641856&interval=1d&events=history
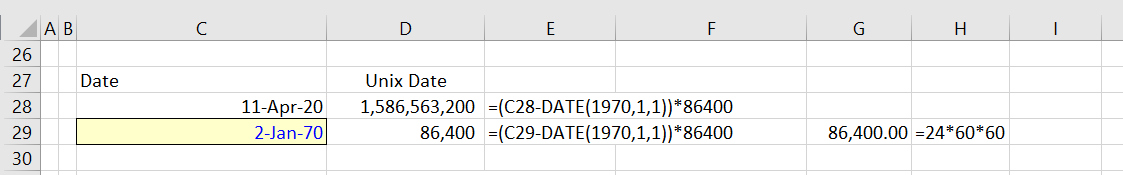
In this URL, the ticker symbol M is shown. The period is expressed in time that is expressed in hours rather than in days. The interval = 1d, means that the stock prices are downloaded for one day. You can also use month (mo) or week (wk). The very long number is the UNIX date that counts the number of seconds since 1 January 1970. To count the number of seconds in a day, you can multiply 24 hours by 60 minutes per hour and by 60 seconds per hour. The screenshot below demonstrates how you can use the number of seconds in a year to compute the UNIX date.
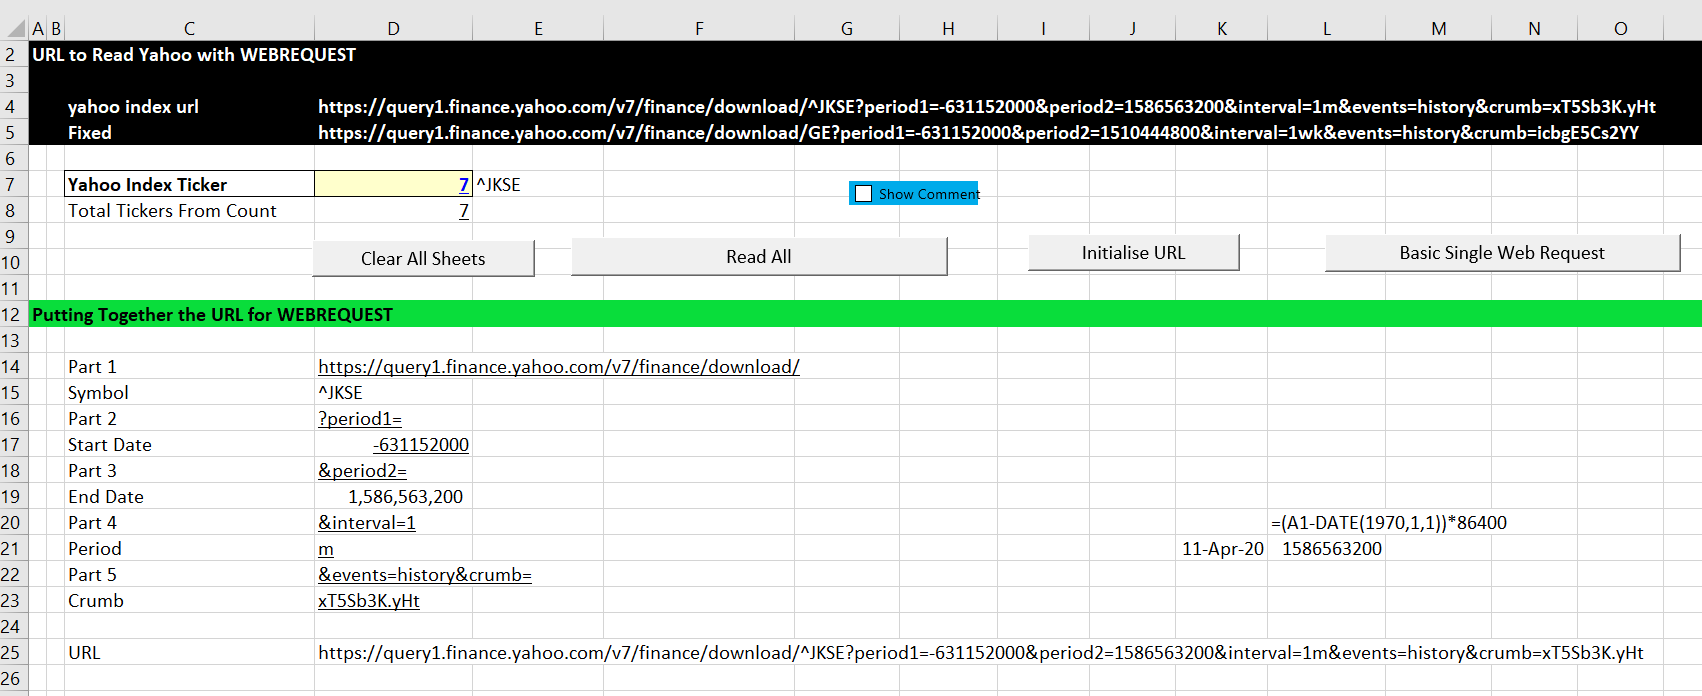
Once you have the date, you can adjust the URL using your own inputs. The most obvious example of a thing to change is the ticker symbol. You can also change the timing and the dates. The manner in which the URL is separated and then put together is illustrated on the screenshot below. You cans change the period from mo, to d to wk on line 21. The ticker for the URL is changed from the list of different indices.
The code below uses the WEBREQEST Method. You can just copy this code and try it yourself. But you may have to go to the references in VBA and click on the webrequest option.
Sub WebRequest_yahoo()

Dim WebRequest As WinHttp.WinHttpRequest ' Need to define the webrequest
Dim OutRow() As String ' Place to put row by row output
Dim matrix(20000, 20000) As String ' Dimension from S&P 500 daily
Dim range_name As String

Application.Calculation = xlCalculationManual

response_wait = Range("response_wait")

Range("cookie_string").Calculate
Cookie = Range("cookie_string")
Range("yahoo_url").Calculate ' calculate the range name -- to get the name

WebRequestURL = Range("yahoo_url") ' Need to define the webrequest

Set WebRequest = New WinHttp.WinHttpRequest ' This is the core of the method -- you need this statement

With WebRequest 'FETCH THE DATA:
.Open "GET", WebRequestURL, False ' Need to define the URL
.setRequestHeader "Cookie", Cookie ' This is a painful part
.send
.waitForResponse (response_wait) ' Test how long to wait -- 10 seconds is a long time
End With

OutRow = Split(WebRequest.ResponseText, vbLf): RowMax = UBound(OutRow) + 1 ' Split a single row when hit vbLF

On Error GoTo end2: ' When cannot find the url

Sheets.Add ' Add a new sheet
ActiveSheet.Move after:=Sheets(Sheets.Count)
' This is for speeding up things
For i = 1 To RowMax ' Put this in the new sheet
matrix(i, 1) = OutRow(i - 1) ' Put into array to read
Next i

range_name = "A1:A" & RowMax

Range(range_name) = matrix ' Put in whole range name
clean_yahoo_stocks ' Runs text to col etc.

DoEvents

Exit Sub

end2:

error_row = error_row + 1

Sheets("Errors").Cells(error_row, 1) = Range("yahoo_url")

End Sub
Summary Sheet
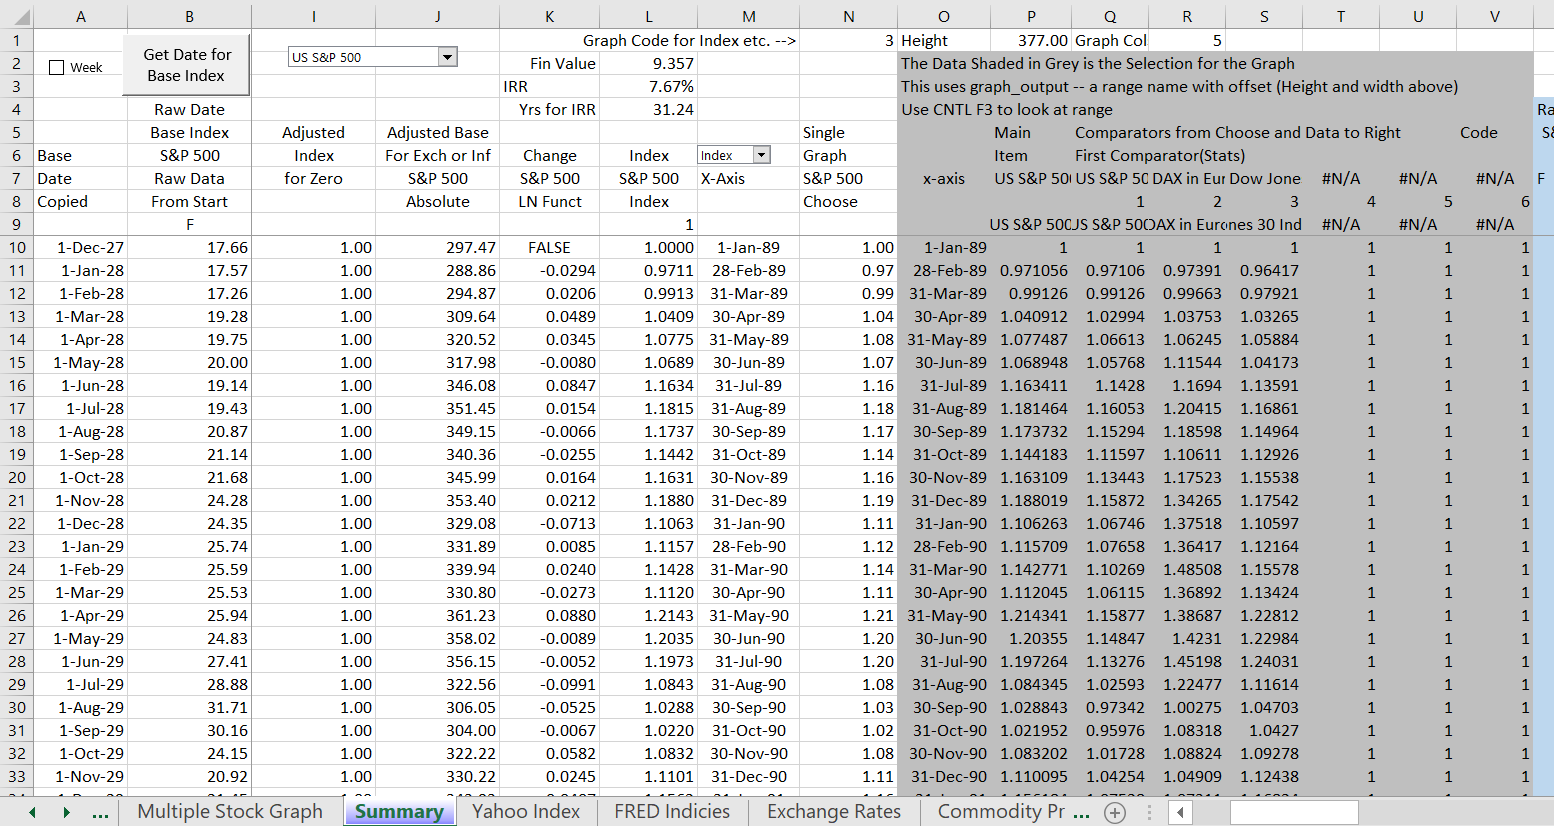
Many of the calculations are made on the calculation sheet. You can go to this sheet and look at different calculations and see how the process works to make adjustments for inflation etc., change dates, compute IRR’s, establish base sheets. You can then make adjustments if you want. The screenshot below demonstrates how the summary sheet adjusts dates and creates and index. The dates all the way at the left are created by the date structuring process described below (you copy dates from the detail index sheet that is read in). The next column shows how you find the base data from using the INDIRECT function. This is all before the dates are adjusted. The next columns to the right adjust the dates and allow you to effectively present the data. One of the painful things to do is to create a date index. The dates are created from the start date and the end date. The end date is computed in the form sheet and may be today’s date. After the date is computed, a lookup function is used (the blue column) to arrange the raw date from column B into the correct dates. Once the data is arranged, the data is adjusted for inflation or exchange rate indices. The inflation and exchange indices come from the far right of the sheet and are adjusted so they are not zero. The final adjusted base data is shown in column J. This data is then transformed to percent changes and and index beginning at 1.0. Depending on your selection, one of these three items is graphed. The percent change is used to compute volatility and beta.
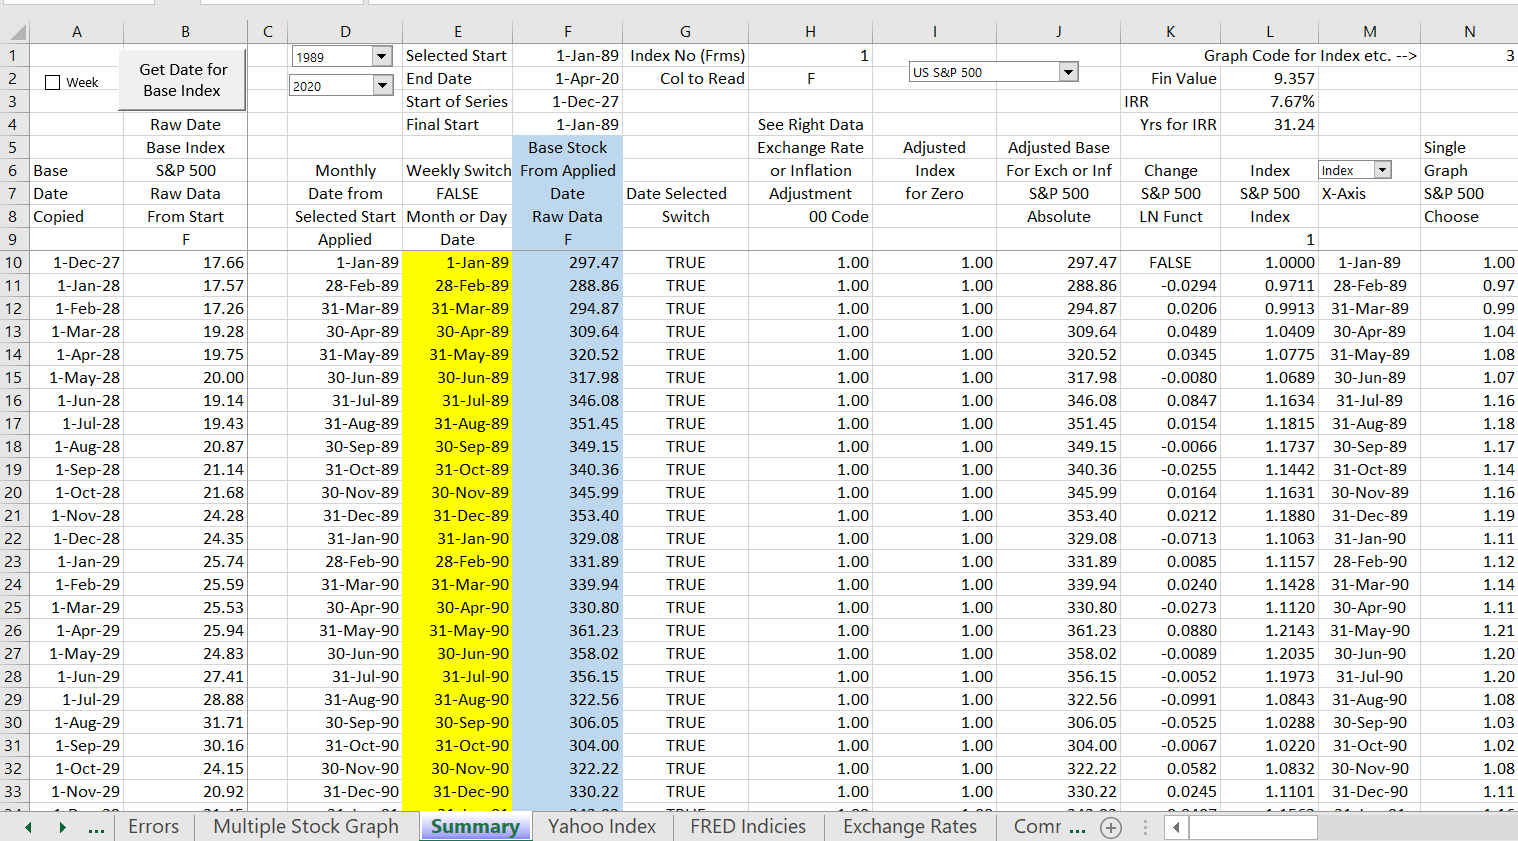
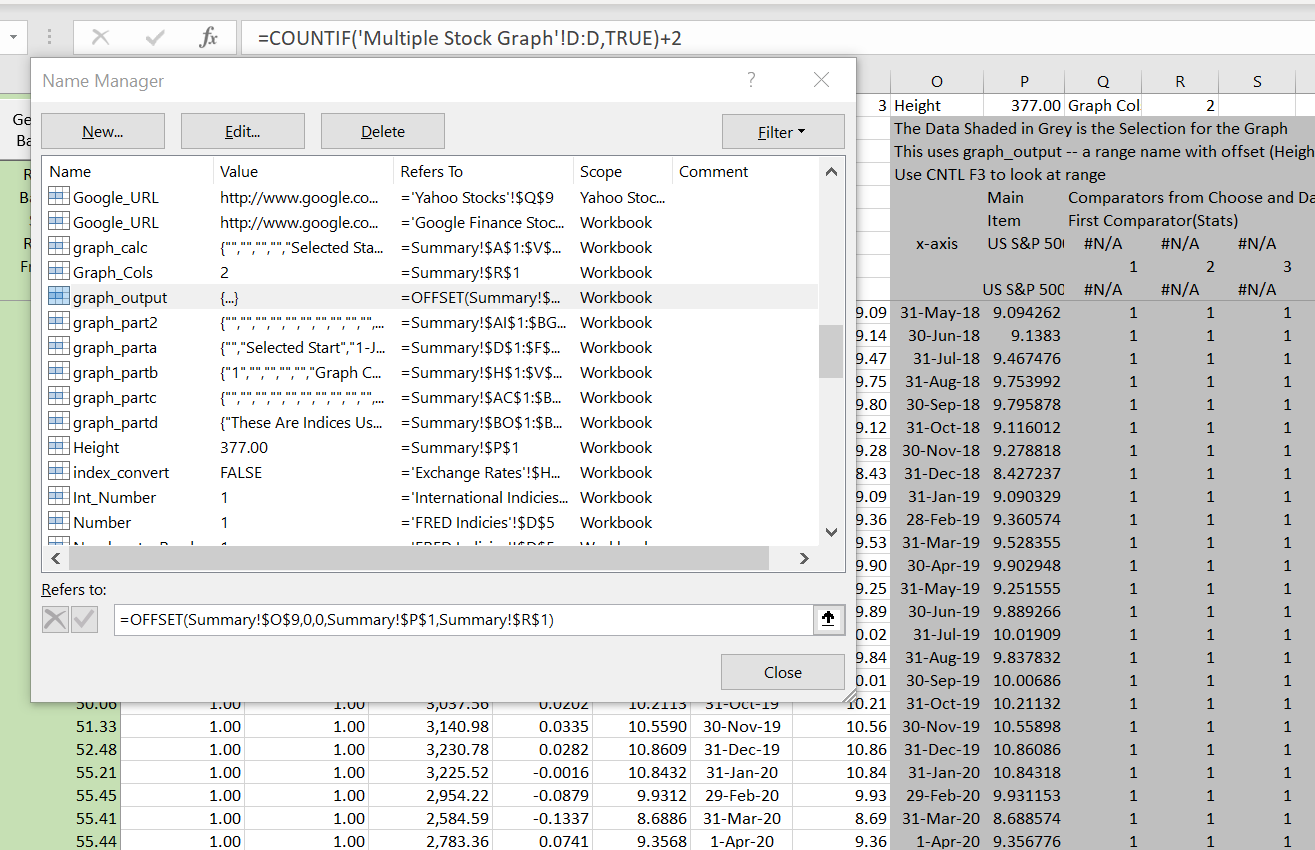
The next part of the summary sheet involves making the graph. The columns for presenting the graph are shown in the screenshot below. The graph is made using the OFFSET method and it is important that the number of rows is correct for use in the range name created with the OFFSET function. The area that is graphed is shown in the gray columns. The height shown at the top in column P (cell P1) is a count of the number of dates +1. This is used in the range name with the OFFSET function. The item in column P for graphing is taken from column N and is the choice of what kind of element to graph (most of the time I use type 1 for the index graph). The items in columns to the right of column P for the other stocks (or commodity prices etc.) are taken from columns to the right that read the raw data and make similar adjustments that are made for the base index.
Structuring the Dates
- The second step is to separate the URL so you can read other stocks. You need to find the URL that works and then make a new URL. The INDEX function is perfect for this as you can make a list of stocks and then pick one.
- The third step is to separate the URL into components that do not have the stock and then to re-combine it with a simple & sign. The stock symbol can come from the INDEX function and the URL should have a range name.
- The fourth step is to create a macro with workbooks.open as shown below. When you operate this macro it puts the data in another file.
- The fifth step is to create a macro that copies and pastes special as values to back to the original sheet. You can also re-name the sheet. Then you should put stuff in the macro that makes the process generic as shown below. Make sure you do not close the file because you will have to adjust the macro as shown below. (Don’t forget the rule – when you make a macro, save the workbook before running it.) You can find this macro in the spreadsheet below.
- The sixth step is and easy step which is to read all of the stocks into separate sheets rather than make one sheet. This is simple because of the index function. All you do is make a little loop that goes around for the same number as items in the index function. Then you make a FOR NEXT loop where you assign the code number used in the INDEX function to the counter in the loop. Then you call the program that reads the individual stock. This is illustrated in the VBA code below.
- The final step is using INDIRECT, MATCH and INDEX to find the data in the various sheets. To do this you need the sheet names so you can look for all of the data. Then you have to put the sheet names together which can be a little painful with “’” when there is a space in a sheet name. The excerpts below illustrate how to use the MATCH and then the INDEX and then show the summary report.
The final output is illustrated below — node the difference in the P/E ratios from the different sources. The excel file associated with all of this is included below the picture. This file has all of the VBA code.
This webpage describes technical details of how to create a database that allows you to present and analyse stock prices. I explain how I have created the comprehensive stock price file. I try to explain how to use the webrequest technique to read in data (contrasted with workbooks.open) and then to restructure the data and put it into different sheets. The reason I use the webrequest method is because a couple of years ago, you could use the workbooks.open method in VBA to create the database. But yahoo.fiance changed its website and it was not possible to read the stock prices on this basis for a long time. On this page I walk through how the process of reading in the stock prices using the WEBREQUEST method and then collecting the data into different sheets and then summarising the data. On this webpage I focus on using yahoo.finance which is really good in the way it computes adjusted stock prices. The adjusted stock prices re-invest dividends and account for stock splits. This allows you to compare stocks that do not pay dividends with stocks that pay dividends and compute total returns.
Reading Stock Prices
When you go to yahoo.finance you can download stock prices (and more imprtantly, adjusted stock prices for dividends and stock splits) into a spreadsheet. To see how the process works, begin with the yahoo.finance webpage where you can download the prices. You can right click on the icon to download the file and then copy the link. The icon is shown on the screenshot below and the resulting URL that you receive from copying the link is shown below the screenshot. The case study I am using is for Macy’s which has a ticker symbol of M. When you right click can copy the link, the resulting URL that is used by for reading in the data is the link shown below the screenshot.