On this web page I demonstrate some techniques using VBA and Python to retrieve data from the internet and put it into excel, which you can call web scraping or you can call hacking. I discuss different ways to get the data into excel ranging from a very simple VBA macro to more complex VBA macros to using python together with VBA. For each of these cases I concentrate on pratical aspects of working with data including comparing different time series, combining series with inflation, gathering historic data, evaluating stock market data, combining stock market data with financial statement data.
When you step back and think about economics or financial data that you want to extract, you want to evaluate things that move around a lot, or you could call this volatile. The most obvious thing that moves around a lot and is studied like crazy are stock prices. Other things that are volatile include interest rates, commodity prices, exchange rates, economic variables like GDP growth and inflation, solar panel prices and other variables that I am sure I have missed. My objective in this part of the website is to give you tools that you can use to generally get the variables for free and also set up the variables in a workbook where you can effectively analyse and present the data. Some of the sources of data include. There are other sources of data that can be helpful to automatically download, but three key sources are:
- The series of databases developed by the Federal Reserve Bank of St. Louis that is commonly referred to as FRED or the Federal Reserve Economic Database. If you have not used this before it is an incredible collection of data. There are alternative ways to extract the data, but what I want to do is compare a lot of data and be able to quickly update the data with flexible graphs.
- The Pink Data sheet from the world bank. Can get the variables from FRED. But it is still wonderfully simple to download the sheet and then do analysis.
- The yahoo.finance data. I was shocked when I first saw this years ago (we used to have to collect hard copies of annual reports). I was even more shocked when I understood the adjusted close price was adjusted for dividends and you can compute the IRR on different stocks. Later I was more shocked to see that the data could be automatically downloaded into excel using a simple macro called workbooks.open. Recently I was saddened when it all started to be more difficult. Now a bit relieved that you can get the data with python.
- The data on prices of solar panels that are included in pvinsights.com. This data is kind of like stock price data but to gather history you have to continually update the data. You can do this with the simple workbooks.open method.
On this page I discuss alternative methods that are pretty simple and then move to more complex methods. In financial analysis we would all like a lot of information and history to study potential movements of variables in the future — stock prices, interest rates, commodity prices, cash flows, macro economic variables and other variables. It is popular these days to discuss data scraping with the python programming language, and to be sure, you can do more things with getting data from internet websites using python than you can with some other methods. But I take the perspective that if you can get data with a simple one line macro — workbooks.open — it is often much better than writing a program where you have to go and find python libraries (like pandas and yfinance) and then figure out how to install the library and dechipher code in the website. I also have the philosophy that when cleaning up data it can be simpler to clean things up with excel functions like XLOOKUP and even MATCH rather than writing a lot of code in a program outside of excel (I do understand if you disagree with this). In order to see what I mean, I have separated the discussion into different ways to get financial data. This data includes an incredible set of free resources from the Federal Reserve Economic Data; stock prices (that can be efficiently adjusted by yahoo finance); financial statement data (that used to be available and is not painful to retrieve), and many other data sets including commodity prices from the world bank, electricity prices from the NORDPOOL website, solar panel prices from PVINSIGHT and many other sources.
.
Part 1 — Simple Method with Workbooks.Open. First Finding a URL and Testing Whether It Will Work
In the 1990’s when I began using excel, a person showed me how to use the workbooks.open method which was wonderful. You could get a webpage into excel or download an excel file on a website and then do your analysis in excel. This method has become less and less effecitve as websites use methods to limit this with API’s (I have read about API’s but I still don’t understand exactly and precisely as to why these are necessary and why the screw everything up with hacking data). When using the World Bank website you may have to go to the website and find the place where the spreadsheet is available for download. This is shown in the screenshot below and the link is in the spreadsheet that is attached to the button below. The link normally lasts for at least a year.
.

If you copy the link to an excel file and right click, you can download the file. You can also assign the url to a range name and then get the file with a macro as illustrated in the screenshot below. The green thing is attached to a macro that will read the file and then put the downloaded file into the workbook.
.

.
In this workbook I like to show different commodity prices with dropdown boxes and have the ability to change the data to real prices. For me, the ability to compare two prices and show the correlations is a big deal. You can also see the correlation between so many of the prices. The graph that I use is shown in the screenshot below which is one of the sheets in the workbook (I provide a link to the workbook below). If I have not updated the data, you can click on the blue button below, download the file and use the properties menu to unblock the file so that you can access the macros. Then, if the data is not up to date, you can press the button to re-download the data.
.
.
.

.
The macro that reads the file with the workbooks.open and then puts the new file into a sheet is shown below. This process allows you to press the button and then update all of the graphs.
.
Sub read_file()

base_book = ActiveWorkbook.Name     ' define the current book

Workbooks.Open (Range("url"))       ' open the monthly file - this is the big statement

temp_book = ActiveWorkbook.Name    ' name of the new workbook that is read and will be closed

 Sheets("Monthly Prices").Select   ' sheet name in the file that is read in
 Cells.Select
 Selection.Copy                    ' copy the whole sheet to the current workbook
 Workbooks(base_book).Activate

 Sheets("Monthly Prices").Select   ' sheet in the base commodity price file
 Range("A1").Select
 ActiveSheet.Paste
 Application.CutCopyMode = False

 Workbooks(temp_book).Close

tot_num = WorksheetFunction.CountA(Range("A8:A8000"))

Range("tot_num") = tot_num          ' total number of months for making graph with offset function

End Sub

.
In other cases there can be more formatting, deleting blank rows and other things. The general approach I use is to record a macro in the copied file before moving the file back to the base file.
If you have a link that you want to read to an excel file or convert the page to an excel file, I try to press the URL to see if it works. The method can be used to put data from the internet page directly into an excel spreadsheet (such as pvinsights) or the data can be read from a spreadsheet that you can download from the internet. So just use ALT F8 to create a macro and then put in this single statement to make sure it works.
When working with databases I find the XLOOKUP, INDIRECT and INDEX helpful (please, MATCH and INDEX are obsolete). The files below include functions that resolve these and other issues. IF you are re-importing a sheet with the same name, you will get #REF’s and when you re-import the file they will not be there. To resolve this problem you can use the INDIRECT function as illustrated below.
.

.
Next, go into the file that is read in and record a macro as illustrated below. Then you can copy (not move) the sheet into your original sheet. By using copy instead of move you can retain the macro and put it into your original sheet. If you use the move, you will lose the macro.
Another file that uses the workbooks.open method is the file that keeps track of solar panel prices. This file puts each date of the analysis in a different sheet. You can open the file below and see how this works. In this case the entire web page is downloaded rather than a single sheet.
.
File with Database of Solar Costs from Scraping the Website PVINSIGHTS and then Re-Formatting
.
The screenshot below shows hot you can use VBA to make the code. In this case, after you open the new sheet, you can make a macro in the new sheet to move it. But use the copy and not the move because otherwise you will not be able to get the macro.
.

.
Once you have code like in the above screenshot, change the word copy to move and put the code after the workbooks.open in the worksheet that reads the files.
.
Method 2: Using HTTP Webrequest Method and FRED
As I mentioned above, FRED has an amazing amount of data that is generally formatted as time series. You can of course go to google and find useful data like on the Surinam GDP. You can also download the data to a spreadsheet as illustrated in the screenshot below. Note that for each time series there the name of a series followed by a code that is shown on the graph. You can copy this code and then use it to automatically download data. In the example below the code number is the pretty long bunch of letters in the brackets.
Gross Domestic Product Per Capita for Suriname (PCAGDPSRA646NWDB)
.

.
But now say that you want to compare the Surinam GDP per capita to the Jamica and Trinidad GDP per capita and say that you want to put the numbers in real terms instead of nominal data. You could download the files to different sheets and then put the sheets together and then use LOOKUP and INDIRECT functions to put things together. But then say that you want to update the graphs for the next quarter. This would be paiful (there may be an app for you to do this but I will show you how to do this yourself).
Formerly you could use workbooks,open together with URL’s that included the code number discussed above. But after I had trouble using the basic workbooks.open for marketwatch and for finance.yahoo, I tried to use my simple technique to hack the FRED data using text files that used to be available. This did not work and put me in a horible mood for the day. I tried various things and wasted time but you could not get multiple data series and stick them in an excel file. The old method using URL’s which is unfortunately obsolete is illustrated in the screenshot below.
.

.
Now I show you how you can get the results and put the data in different sheets using an API key and a different method from the workbooks.open technique. I have copied the code below. The big deal is that you can find a FRED API code really easily as shown in the code. The way I do this is to begin with reading a single series and then moving on to reading multiple series (which is really easy). The file that has the VBA code and illustrates this approach is attached to the button below.
.
.
Sub DownloadFREDData()

    Dim http As Object
    Dim seriesID As String
    Dim apiKey As String
    Dim url As String
    Dim i As Integer
    Dim data As String

    Dim OutRow() As String                               ' This is for putting the output in different rows
    Dim matrix(20000, 10) As String                      ' This is the for the output
    Dim range_name As String
    Dim test As Variant

current_status = Application.Calculation

Application.Calculation = xlCalculationManual

 ' Your FRED API Key. You can register and then google how to get the FRED API Key

 '  https://fredaccount.stlouisfed.org/apikey

    apiKey = "ac86a3b66d5e0aabf973fb048598cd8a"

'
' In the spreadhsheet make sure there is a range name for sheet_name and the code_applied
'

'
'  Step 1 -- Clear out columns from last download and clear the data
'
    sheet_name = [sheet_name]

    On Error GoTo sheet_error:
    Sheets(sheet_name).Select
    GoTo continue1:

sheet_error:
    create_sheet_name

continue1:

    Columns("A:Z").Select
    Selection.Delete Shift:=xlToLeft


    MsgBox " In Sheet(sheet_name) " & sheet_name

'
'  Step 2 -- Get the fred code from the range name [code_applied]
'

    ' FRED series ID you want to download -- this is on the FRED Graphs and can be downloaded

     seriesID = [code_applied].Value  ' Example: SP500 series ID for the S&P 500 index

' Construct the URL to access the data from the FRED API

'
'  Step 3 - Adjust the url for the data -- Just need the series ID in a range name
'
    url = "https://api.stlouisfed.org/fred/series/observations?series_id=" & seriesID & _
          "&api_key=" & apiKey & "&file_type=json"

    ' Create an HTTP request object

    Set http = CreateObject("MSXML2.XMLHTTP")

    ' Send the HTTP GET request

    http.Open "GET", url, False
    http.Send

    responseText = http.responseText   ' This gives you a long string

'    MsgBox responseText

    big_array = responseText

    OutRow = Split(big_array, "}"): RowMax = UBound(OutRow) - 1
                                                            '        MsgBox "Max rows " & RowMax
        For i = 1 To RowMax                                  ' Loop around each line with line feed
           matrix(i, 1) = OutRow(i - 1)                      ' Need two dimensions to make work fast
                                                            '           If i < 30 Then MsgBox matrix(i, 1)
           Cells(i + start_added, 1) = matrix(i, 1)
        Next i

format_sheet  ' This is to format the sheet properly in a separate subroutine below

Set http = Nothing

Application.Calculation = current_status

End Sub

.
There are a couple of associated subroutines that include creating the data and clearing the sheets. You can copy the added code below the above code and you should be able to run the process to download data from FRED. The good news is that you should be able to copy this stuff and not have to do that much work in customising things.
.
Sub create_sheet_name()

   last_sheet = Sheets.Count
'
    Sheets.Add
    sheet_temp_name = ActiveSheet.Name
    Sheets(sheet_temp_name).Move After:=Sheets(last_sheet + 1)
    ActiveSheet.Name = [sheet_name]

End Sub

Sub format_sheet()
'
' Format with text to columns
'

    Columns("A:A").Select
    Selection.TextToColumns Destination:=Range("A1"), DataType:=xlDelimited, _
        TextQualifier:=xlDoubleQuote, ConsecutiveDelimiter:=False, Tab:=True, _
        Semicolon:=False, Comma:=True, Space:=False, Other:=True, OtherChar:= _
        ":", FieldInfo:=Array(Array(1, 1), Array(2, 1), Array(3, 1), Array(4, 1), Array(5, 1), _
        Array(6, 1), Array(7, 1), Array(8, 1), Array(9, 1)), TrailingMinusNumbers:=True

    Columns("C:C").EntireColumn.AutoFit
    Columns("E:E").EntireColumn.AutoFit
    Columns("G:G").EntireColumn.AutoFit
    Columns("I:I").EntireColumn.AutoFit

    Columns("H:H").Select
    Selection.Delete Shift:=xlToLeft
    Columns("A:F").Select
    Selection.Delete Shift:=xlToLeft

'    ActiveSheet.Name = [name_applied].Value
End Sub
Once you have developed code something like above for one series, you can make a loop that goes around each FRED code and re-does the process. All you have to do is use the INDEX function with a code number. The code number like a scenario number selects one of the series. Inside the subroutine you can make a for loop (or a d while or some kind of for EACH loop) and then with each step of the loop you make the code index in the spreadsheet change. This is the key point — make the code number in excel equal to the index of the loop. This part of the process is easy to program and is shown in the code below.
.
Sub FRED_API_All()

For i = 1 To [max_code]

    [code] = i

    DownloadFREDData

Next i

End Sub
.
The final step is to use the INDIRECT function together with the LOOKUP function to gather data together and arrange the data with a common time line. This use of the indirect function is illustrated in the screenshot below. The names at the top use the TRANSPOSE function which are the same as the sheet names. With the sheet names and the time line in column A, the data is extracted. After that you can do whatever you want — create indicies; convert to real terms; compute correlations; may x-y scatter graphs; create frequency distributions and so forth.
.

.
The screenshot below shows how you can use the method to read a lot of data. You can put in a new sheet and a new code from googling FRED. Once you have done this you can arrange the data to your heart’s content.
.

.
After you read in data, I normally look at the sheet with two comparison graphs. This is developed from a sheet named database that extracts the data. With this database sheet, the data is put into other sheets for making the graphs. The graphs are then used it is put into a sheet that uses
.

.
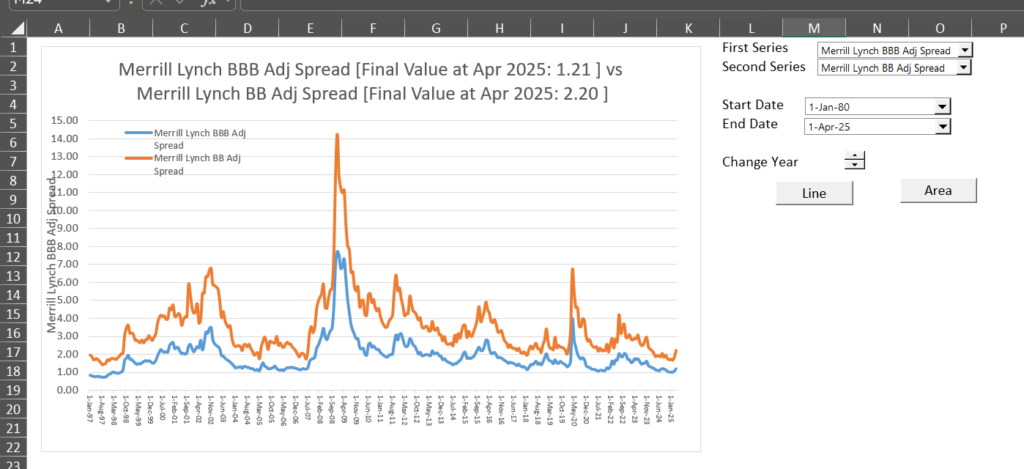
The kind of graph you can make with flexible dates (you may want to take out the 2008-2009 extreme data in the graph below). I like this particular graph because it is very representative of credit spreads you may pay for in project finance.
.
.

.
Method 3: Monte Python and Extracting Data from Finance.Yahoo
.
I used to be able to read yahoo stock data directly into excel by adjusting the URL and then using the workbooks.open method. Using this method I could compare the real growth rate of different indicies, stocks and economic series (this is illustrated in the screenshot below.) With this method I could read a long list of stocks, put the time series data into separate sheets and then extract data into a summary sheet kind of like the above example with FRED data. I could arrange dates, compute betas, evaluate the stock returns, evaluate the volatility of stocks, compare the stocks over time. In the screenshot below you can see a list of stocks and at the bottom the economic series. You can see that different series have different start dates. You can see that you can adjust series by inflation and exchange rates. This picture comes from the time when I could read all of the data with the workbooks.open method. Now I will leave the mechanics to make the graphs but we have to find a way to read in the data. History and illustration of what you can do. Two analyses that I use. The first, illustrated in the graph below extracts stock price data adjusted for splits and dividends, converts the adjusted close price into real terms (I find the adjusted close price an incrediblly important innovation from finance.yahoo along with many other things.
.

.
The old method for reading the data is shown in the screenshot below. In the old days you could put the URL’s together and then read in the URL directly using the HTTP method. It is very sad, but this is no longer possible.
.

.
Now you cannot even download the data by hand without paying extra — as shown below. The screenshot below shows a lock near where you could download and get the URL. So I paid extra which allowed me to get much more financial data and also at least download the files manually (it was not like paying for Bloomberg). Now that I see that you can read the data with Python, I was a bit of a waste but not really. But when you use some AI to see if yahoo data can be read with an API code like the code for FRED, I came accross some API which is difficult to interpret and a lot of discussion about python. So this is the only reason I decided to try and have the pain of learning yet another language.
.

.
I have tried using the power query in excel, but that also seems not possible (even if it was, you want to run macros and I am not sure this is possible). So let’s learn some python. Again, for me, the only reason is to use python is for the ability to read in the stock prices and to a lesser extent, the financial statements. Some of the gant charts and graphing features of python are not at all interesting to me. In my opinion the only reason to learn python is for data hacking.
The last thing I feel like doing is learning another language. I started with FORTRAN a very long time ago, then I began to program in C. Then windows came along and I had to learn C++. After that I started working with excel and programming in VBA. Inbetween I programmed with various tools such as dBase. This is why I am telling you things you do not care about. These languages are fundamentally all the same. You have to define variables, find a method for coding (I used to have to type in a stack of cards). You have to have a way to get the results out (it used to be the green an white computer paper). You have the do some kind of analysis whether sorting, doing statistical analysis, a financial model or something else. So it is painful for me to waste time learing the things for another language especially as I am old and make a lot of mistakes. One thing never changes whether it is FORTRAN or Python. I make spelling mistakes in variables, bugs always occur, I put the brackets or the point in the wrong place. In the end, any programming language is about getting data in or reading data, then doing something with the information and finally writing out the data. It is reading, writing and arithmetic.
It is the last point I want to emphasize. Instead of showing you in an aggorant way how easy things are, I am going to show you all of the mistakes that I made. I consider the ability to type in a bunch of tickers and then download the stock prices into separate sheets and then put all of the stock prices together with a common time line and then compare the adjusted stock prices in real terms with the GDP an effective case study. I care about the outcome and not wasting time with ghantt charts or some kind of summary that you can do in excel. I want the raw data to work with I can do my own analysis in excel.
.
Basic Objectives
The fundamental objective is to take a list of stocks or indicies in a spreadsheet as shown in the screenshot below and then press a button to gather data from finance.yahoo and then put the data back into excel and then eventually work with the data. We need to write a macro to first call a python program. Then we need to put the excel tickers into the python program. Then we need to run the python program and get the data from yahoo. We need to put the data into a dataframe and write out the data from the python program. Finally we can go back to VBA and retrieve the file and append the data to the original file. To work on the program the list of tickers below demonstrates what I am trying to do. I am trying to read the tickers from excel in the screenshot below. Once the data is acquired I want to put the data into separate sheets for each stock.
.

.
Mistakes I made in in Installing Python
This is about the only part where I did not have problems. After you go to google and download python you can go to the RUN command. The you will be in DOS which gives me good and bad memories.

.
Even though I have not used DOS for many years I was surprised how this came back to me. The first thing to do is type in python and make sure something happens. Other DOS comments that are useful include MD; CD; CLS; DIR; WHERE; DEL. It actually felt good to be back to DOS as if you would care about this. Now I even remember CHKDSK when I had to check if my floppy disks were working. You can type dir/p and there will be a pause on each page. Somehow this even came back to me. Other examples are copy c:\sandbox*.* d:\sandbox\
The biggest mistake I made in this section was thinking that it is good to run the run python from DOS instead of getting the Visual Studio which is like the VBA editor in excel. A lot of the examples on the net or using the PY function in excel do not let you save a program. But you eventually want to go to DOS and enter a command something like shown below:
Mistakes I made in Installing Visual Studio Code
It would seem that installing the Visual Studio Code should be really easy. For some reason I had to re-install the program after my first try. Once you get into the program you can make a very simple program (it doesn’t work without the quotation marks as I tried). When you run the program the first time it will ask you about a debugger. I just entered the first one and didn’t worry about it. To test the file, you can select the Run option from the menu at the top. When you run the file, I run it without the debugger — it will tell you where the errors are which seems to be good enough. The Visual Studio Code is something a bit like the VBA editor and I was more comfortable messing around with programs in with the editor. If you are messing around and making errors and then trying something else, you can save separate files.
In the screenshot below I have saved the python program as test1.py. The good news about this is that you can go to the Run thing and then type python This took me a while and I was worried about the debugger.
.

.
In the screenshot below I have saved the python program as test1.py. The good news about this is that you can go to the Run thing and then type python test1.py. Note in the screenshot below that running the program only works from the directory (this is old DOS language for folder) where the Visual Code is located. This means that when running the python program from a VBA program in excel you can (I am not saying should because there are other ways to probably do this) change the directory. When you are in VBA as explained further below, you can use the ChDir command and go to the “python code” in my example. If you have put your Visual Code Editor in another directory (folder) then you can change the directory in VBA in your directory.
.

.
Continuing with the Visual Editor, it was a pain for me to arrange the view so that you can clearly see the program you are writing on the left and the results of the program after you press the Run menu option (without the debug) on the right. In the screenshot below you change the view so that you can see the result of running the program on the right hand side. In the example, I have messed around and changed the appearance and then run the program by pressing F5. I make mistakes just about everytime I run the program. I messed around with the view so I could see the output on the right. The purple stuff on the right shows the line number where I made mistakes.
The big deal is that you can save the files because then the saved files can be run in VBA.

.

.
When you mistake that is a clear mistake you get a curly line as shown in the screenshot below for Line 22. The mistake is that the word false should have a capital letter and be False. This means that you should look at the program and fix the problems with curly lines before running the program. It seems obvious to people who may write programs everyday but it was not obvious to me.
.

.
Mistakes in Installing Libraries with PIP Install
Python seems to be like other languages with loops and printing and things in and writting things out. One of the big differences seems to be the libraries. The library analogy is good (maybe bookstore would be better because you are not borrowing when they are free). If you think about a library, you can check out a book and then get a lot of information. The libraries in Python seem to allow you to make data presentations (that I could not care less about) and they allow to go and hack things from websites. The big deal about my problem is that you can get data from finance.yahoo that you cannot seem to get elsewhere by getting a library book.
So in python you the first thing a program typically has is getting some library (books) into the program. The first library that you can seem to normally need is a library is called Pandas which allows you to read from excel and write to excel. The second library is called yfinance which allows you to get the data. Now whenever I watched a video about python, the instructors did say that you have to go and get the library and they did say that you have to use this thing called PIP. I had no idea about the debug file.

.
Mistakes in the First Part of the Python Program in Defining Files
It was a real pain to define the excel file locations and the then be able to open the file. Mistakes I made included not realising that the output file must be closed but that it must exist. I also did not get the double slashes correct. In the screenshot below I have shown the first part of the python program that defines the files. I have made a screenshot so that you can see the comments more clearly and the different colours for variables. After discussion I list the entire code that you can copy it into your visual code studio or other program.
.

.
Note that I have saved a template file to the sandbox directory which is part of the C drive – this is what people seem to do in the examples (I have not tried working with one drive). In the example below I define the the file that I am reading from (it would be nice to read this file name into python and I am sure this can be done. For now I am putting the file name directly into the python code as shown in the code below. If you have sucessfully installed the Visual Code Editor, you can try to copy the code into your editor and see if it runs. Again, make sure that you have installed the libraries in the correct directory (folder) with the PIP INSTALL language. Please note that if you change the excel file with the tickers you must save the file. I have included a whole bunch of comments with the # sign. Each language has something like this — in FORTRAN it was with the letter C; in VBA it is a single quote ‘.
.
import pandas as pd  # check out from library
import xlsxwriter as writer
bookName = "C:\\sandbox\\Python_Shell.xlsm"   # This is the template input file you should have two slashes
pathName = "C:\\sandbox\\"  # need two slashes for creating a path in python
# outputName = "C:\sandbox\output.xlsx"  # this is for testing, the file is created below

sheetName = "Read Tickers"   # define the sheet name for below

# now read the template file and find the sheet name

workbook_data = pd.read_excel(bookName,header=None,sheet_name=sheetName)

# The row 11 and column 3 is defined in the template excel file. This should be a range name

tickerName = workbook_data.iloc[10,2]   # This should be and can be a range name

print (tickerName)

# Now define the output name for each ticker

outputName = pathName + tickerName + ".xlsx"
print (outputName)

# data = {'col0': [tickerName][10][20],'col1': [tickerName][30][40]}

data = {'col0': [tickerName]}
df = pd.DataFrame(data)
print (df)  # please note that you subtract 1 from the row and the column
df.to_excel(outputName)
IF you want to run the file you can download the file below. This file should be put in the directory sandbox or you should put it in the directory you would like and then change the code above.
Mistake in Getting the Correct Data from Excel
I have worked out reading the data from excel into the python program. But this was difficult for me at first and took hours. In the screenshot you can see how I define the row and column number and because python starts with 0 and 0 in row 1 and column 1, you must subtract 1. When I experimented with this at first I put the cell address in a bunch of cells and used the first sheet to try and read the data. Then I used the iloc function that is part of the pandas library. The excel file is attached to a button at the bottom named python_shell. Then you can make sure that you are reading the correct cell.
.

.
Reading from different sheet names was another issue. In the screenshot below you can see how I have defined the sheet name and then printed the sheet name and the name of the file. It does not look that difficult but for some reason this took me a long time.
.

.
Mistakes in Making a Loop and Getting Data from Finance Yahoo
My idea is not to just get data for one ticker symbol but to get a whole lot. I want to make a loop that goes around many tickers and reads the files. Then I want to put the output in a separate sheet and restart the process. I am very old fashioned and I remember the old VBA when you could only have a variable like a1 or z5. But you could have a for and next loop that is something like for 1 = 1 to 100. At the end of the for loop you would put next i. I have loops like this below which read run the python progame with VBA code. But you apparently cannot make the old fashioned for loops in python. Instead you do not have the next or loop at the bottom and you must indent what is in the loop. In the part of the program that goes around tickers you can see that I have made my old fashoned loop with the statement — for i in range(rows_in_loop): . In this statement the double periods (colon) is necessary. The portion of the program with the loop is illustrated in the screenshot below. You can see how the loop goes around tickers that are defined in the excel program.
.

.
Issues with Retrieving Data from yfinance
The whole reason for using python is that I can access data that is no longer available by using the workbooks.open method or the HTTP method. You must intall the PIP by going to DOS and writing out PIP install yfinance. Remember that you must do this in the directory where the Visual Code Studio is located (sorry about using old DOS terms like directory). The only piece of data that I care about for stocks is the adjusted share price which is the one of the best things about yahoo.finance. With the adjusted share price you can measure IRR and much better see the true progression in value.
I watched a video about getting data from yfinance (the link is below). This was very helpful and I was able to copy the code that is necessary to get the data. The code below does the trick and presents the adjusted closing price as a separate variable. The link to this video is below:
.
df_yahoo = yf.download(tickerName,period="max",auto_adjust=False,interval=time_period)   # Need to first get the data
   df_yahoo.xs(tickerName,axis=1,level='Ticker')  # This puts the data on one line

   adj_close_df = pd.DataFrame()
   adj_close_df = df_yahoo['Adj Close']
.
Mistakes in Understanding what is a Data Frame
I suspect that experts in python will laugh at me for this but it seems that you cannot write out data to an excel file unless it is a defined as a data frame. In the above code a variable is defined to equal a pandas (that is the pd) data frame. Then you define the dataframe as above. It is all not very intuitive to me and of course I made many mistakes and went to many different websites before I wrote the above code. It was necessary to create these data frames in order to write the results out to an excel file. I still do not understand a data frame (still don’t really — seems to be a multi-dimensional array). A data frame seems to be something like a two dimension array (in excel the row is always first and the column second). You can make a data frame in a single cell also. Can make a data frame with one single cell. But after a lot of difficulty I found that this is not necessary as demonstrated with the number of tickers.
.
Mistakes in Writing Out Excel Files in Python
I fought a lot with the program when I was trying to write out the stock prices to different sheets in an excel file. I tried many different things and ran into a brick wall. I kept trying different things. One of the big problems was that I did not realise that you had to have the file closed. You also needed the file to exist if you are appending the file with the letter “a” as shown in the code below. The first part about writing out to excel is that you should write out a data frame (hence the df in the name). Second you can use the ExcelWriter which is part of the pandas library because of the pd before the function name. If there is the mode = ‘a’ the file will be appended (this means that you may have to delete the sheets for the next run). Finally there is the to_excel which calls whe writer and a sheet name. I cannot tell you how many mistakes I made before getting this.
   print (adj_close_df)  # prints some of the data for each stock
   with pd.ExcelWriter(output_file, mode='a', engine='openpyxl', if_sheet_exists='overlay') as writer:
    adj_close_df.to_excel(writer, sheet_name=tickerName)   # This must be indented
.
Running the Python Program using a VBA Program
Once you have written the python code you can try to run the code. First, you should be able to run the program and see it run without any errors. You can call the python program from VBA code with a couple of statements. I don’t usually call other programs from VBA but I found somebody who explained this, which was helpful. Of course I did make a lot of mistakes. One was that you must be in the correct directory. A second was the writing of the statement that runs the python program.
The VBA program with is in the file that is attached to the button below includes a few essential things at the top and the bottom which are shown in the code below.
Function GetYahooDataViaPython(ticker As String, Optional period As String = "1d") As String
    Dim wsh As Object
    Dim pythonExe As String
    Dim scriptPath As String
    Dim command As String
    Dim output As String

    Set wsh = VBA.CreateObject("WScript.Shell")

    ' Update these paths to match your system

    pythonExe = "C:\python.exe"  ' Path to your Python executable

    command = pythonExe

    MsgBox " After command "

    pythonExe = "C:\Python39\python.exe"  ' Path to your Python executable
    scriptPath = "C:\path\to\yfinance_data.py"  ' Path to your Python script

    command = pythonExe & " " & scriptPath & " " & ticker & " " & period
Working with Files in the VBA Program
I have found it easier to do things like close and open files, delete sheets in a worksheet, re-name sheets and other things in VBA. This means that the VBA code can work together with python and make sure the files are ready to go in python. Even though I write VBA code everyday I still make mistakes. The screenshot below shows the pages and buttons you can use to run the VBA program which in turn runs the python code. The VBA together with the Python will walk through each index and put the time series output in a separate sheet in the workbook. With this data you can do a whole bunch of things as explained above.
.

.
Final Python Code
.
The final python code with the reading from excel, the extraction from
import pandas as pd  # check out from library
import xlsxwriter as writer
bookName = "C:\\sandbox\\Python_Shell.xlsm"   # This is the template input file you should have two slashes
pathName = "C:\\sandbox\\"  # need two slashes for creating a path in python
# outputName = "C:\sandbox\output.xlsx"  # this is for testing, the file is created below

sheetName = "Read Tickers"   # define the sheet name for below

# now read the template file and find the sheet name

workbook_data = pd.read_excel(bookName,header=None,sheet_name=sheetName)

# The row 11 and column 3 is defined in the template excel file. This should be a range name

tickerName = workbook_data.iloc[10,2]   # This should be and can be a range name

print (tickerName)

# Now define the output name for each ticker

outputName = pathName + tickerName + ".xlsx"
print (outputName)

# data = {'col0': [tickerName][10][20],'col1': [tickerName][30][40]}

data = {'col0': [tickerName]}
df = pd.DataFrame(data)
print (df)  # please note that you subtract 1 from the row and the column
df.to_excel(outputName)
With interval

.
Putting Things Together in a File to Evaluate Economic Data
In the file attached to the button below, you can downlad stock indicies, stock prices and econcomic data. There are lists of different stocks and then you can run a program to extract the stock prices and indicies from python and the economic data series from FRED.
.
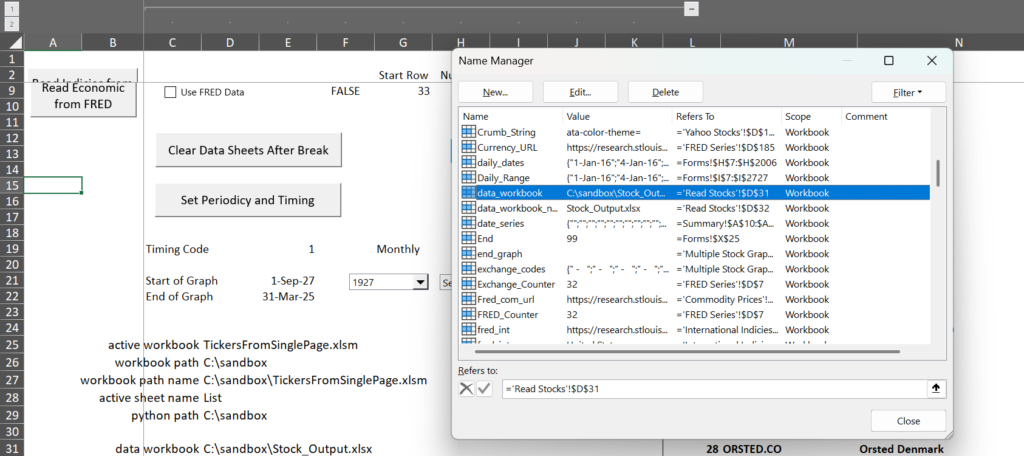
The screenshot below shows the data page for FRED economic variables. The blue area is what is read in using the HTTP method. The data in white at the right is a large list of variables that you can select and link to the blue area. The left most column in the blue is the FRED code. The second column is the sheet name that is used defined when the macro is run. The macro to run the button is just about the same as the macro for the interest rate file above.
.

.
The code that goes to FRED and gets the data an puts the data into a sheet is attached to the button shown in the screenshot above. This code is similar to the code discussed above for the interest rate file. In order to compare stocks and bonds I have created an index from the interest rates. In this way you can compare the IRR on stocks and bonds along with the volatility and even the beta.
.
Step by Step Process to Run the Program and Put Data into Excel
If you want to run this it is not as easy as just opening excel and playing with the data. This is because you must have python installed and you you must be able to run the python program. So, assuming that you have not installed python, the explanation below walks through how to get the program running.
Step 1: Install Python
I do not think it matters where you install python like it matters where you install the visual studio code. It is not necessary to install the video studio code if you are only going to run the program. But if you want to mess around you can install the visual studio code and then run PIP Install [library name] in the same directory.
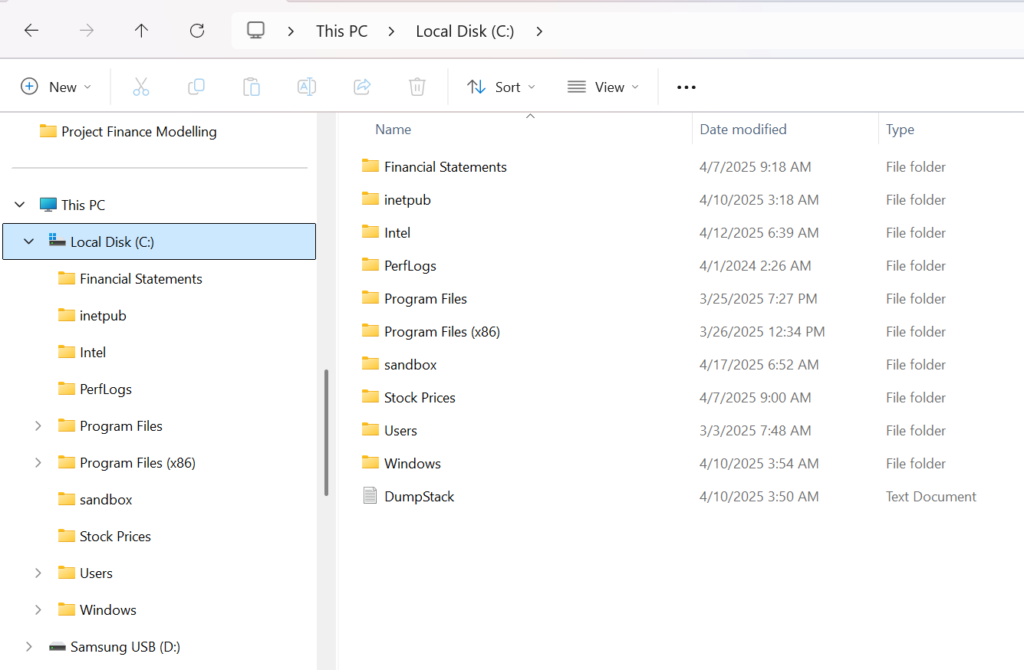
Step 2: Create a Directory (Folder) to Hold the Excel Files
When you download other excel files it does not matter where you put them. For this analysis if you will not get updated or new data, it does not matter where you put the files. But if you want to make sure things work without adjustment you should make a new folder in the C: drive directly under the C: drive so that the python code looks at the correct directory. In a button below I have put a zipped file that includes all of the excel files and the python code that is in the sandbox directory.
.

.
.
If you put the python files (discussed below) into another directory, then you should go find the path name in the excel file and also go to the python programs and change the directory in the python code. You could make python read the directory name but this would mean that you would have to answer the question as to where is the python file every time you run the program.
Step 3: Download the Excel File and Put it in a Directory (Folder) that You Can Adjust
When you download other excel files you can put them in different places but you will have to adjust the python code that refers to the sandbox directory and you will have to adjust the path name in the excel file. Maybe the best thing to do is make a directory for sandbox and then put the zipped files there. After that you can move things around and change directories.
Step 4: Open the Excel File and Experiment
Once you have the file, try to delete the sheets after the break sheet and then download other dates, other timing (daily weekly monthly) and different ticker symbols. If it is not working for you I am interested and you can send me an email at edwardbodmer@gmail.com and I will send you a zipped file with my working analysis. I have not managed to put the entire sandbox directory here, if you want that send me an email. The various excel files and python programs to download are attached to the buttons below.
.
.
.
Python Code for Retrieving Tickers from Analysis yfinance to Acquire Stock Data (put in C:/Sandbox)
.
Running Python
.

.

.

.

.
.

.
Postscript — Too Many Requests
After running the yfinance and trying different things to get the message below. I emphasize that I have no problem whatsoever with paying a little money to whoever made the download possible. I am not trying to promote bad stuff. I do pay for unlocking yahoo finance and I think it is worth it because you can get many years of historical financial statements. Note that I have taken the yfinance stuff and tried to download one single stock so you can work with it. No transfer to excel; no do loop; no reading from excel …
.

.
When I searched for how to pay and the error, an I found the following solution. I have absolutely no idea what this does and it is a problem for me with the world. But the shocking thing is that it works. You do have to install the curl_cffi (whatever that is). Then you can add the code.

.

.
When you add this to your simplified program like the following, I was completely shocked that it worked. The python program below includes the adjustment for the limit on the number of tickers.
import pandas as pd  # check out from library - this is for reading in the ticker and the data frame
import xlsxwriter as writer # this is for writing out to the excel
import yfinance as yf # his is for getting data
import os  # I needed this for the output; without it I could not write
from datetime import datetime, timedelta # you can use this if you want to select particular dates
from curl_cffi import requests

session = requests.Session(impersonate="chrome")  # I think this does some kind of thing so you have new sessions with new cookies

tickerName = "ED" # this can be any ticker name
ticker = yf.Ticker(tickerName, session=session)    # This puts some kind of cookie so you do not run out of tickers

bookName = "C:\\sandbox\\Stock and Economic Analysis.xlsm"   # This is the template input file you should have two slashes

print ("The Excel File is From " + bookName)
# input("Press Enter to continue...")   # This is for testing

# This is the output file that goes into the sandbox directory
workbookName = 'stock_output.xlsx'  # If you use xls it does not work. This file name is called in the VBA Code

pathName = r"C:\\sandbox\\"  # need two slashes for creating a path in python
# outputName = "C:\sandbox\output.xlsx"  # this is for testing, the file is created below

end_date = datetime.today()   # I don't use this but if you want to download specific datae you could

output_file = os.path.join(pathName, workbookName)  # Use this to put together the output file

print (output_file)
input (" The Adjusted Closing Prices Will be Sent to the Output File ... ")

# f = open(output_file,"r")
# f = open("D:\\myfiles\welcome.txt", "r")

print (output_file)
# input (" Printing Output File ... ")
# adj_close_df.to_excel(output_file,sheet_name=tickerName)

sheetName = "Yahoo Index"   # define the sheet name for below

print (" Sheet Name: in " + bookName + " is " + sheetName + " Now Reading Tickers into Python")

# now read the template file and find the sheet name

workbook_data = pd.read_excel(bookName,header=None,sheet_name=sheetName)

# Read in the total rows from the spreadsheet in row 6 and column D -- D6

row_number = 6   # will subtract 1 because python starts at zero
col_number = 4   # this is for column D

total_rows = workbook_data.iloc[row_number - 1,col_number-1]   # This should be and can be a range name

print ("Sheet Name" + sheetName + " Total Tickers " + str(total_rows))
# input(" Press any key to continue ... ") # This is for testing

row_number = 4   # will subtract 1 because python starts at zero
col_number = 4   # this is for column D

time_period = workbook_data.iloc[row_number - 1,col_number-1]   # This should be and can be a range name
print ("Sheet Name" + sheetName + " Time Period Code " + time_period)
# input(" Press any key to continue ... ") # This is for testing

# This next part puts the some output for the file name in the first sheet

# data = {'col0': ['Output File'],'col1': [output_file],'col2' : [str(total_rows)]}  # this was to try and understand data frames
# df = pd.DataFrame(data)
# print (df)  # please note that you subtract 1 from the row and the column

#df.to_excel(output_file,index=False)

# How in the hell did you know that you are supposed to indent in a loop

start_row = 10  # This is the start of the list - Implies that you should not Insert Lines
col_number = 4   # this is for column D

# index = true puts in the dates in the first column
# You can use 1mo, 1wk, 1d or minutes in the download below
# You must make sure that the output file is NOT open in excel

rows_in_loop = total_rows - 0

for i in range(rows_in_loop):   # this is like for i = 1 to rows_in_loop in VBA
   row_count = start_row + i
   print ("Reading for Ticker Number " + str(row_count))
   tickerName = workbook_data.iloc[row_count - 1,col_number-1]   # This should be and can be a range name from the excel file. I will try to learn it
   print ("Getting Data for " + str(tickerName))
   df_yahoo = yf.download(tickerName,period="max",auto_adjust=False,interval=time_period)   # Need to first get the data
   df_yahoo.xs(tickerName,axis=1,level='Ticker')  # This puts the data on one line

   adj_close_df = pd.DataFrame() # define a data frame. I do not find this intuitive at all
   adj_close_df = df_yahoo['Adj Close']
   print (adj_close_df)  # prints some of the data for each stock
   with pd.ExcelWriter(output_file, mode='a', engine='openpyxl', if_sheet_exists='overlay') as writer:
    adj_close_df.to_excel(writer, sheet_name=tickerName)   # This must be indented


# index = true puts in the dates in the first column

print ("C'est Terminer")
print ("Das ist Fertig")
print ("Esta Terminado")
.
Converting Python Code to Excel File
.
Some of the stuff I am writing here is so that I can remember what to do.
You can copy all of the python code and then you can install python to run the program. But if you do not have python installed, this may be a pain. So, alternatively you can convert the python to an executable file and then modify the VBA code to run that file.
To do this you should first get something called the pyinstaller with the pip install as shown below.
pip install pyinstaller
Next, you can run the installer which will create a file. To run the installer, you must know the name of your python file as illustrated in the example below.
.

.
C:\Users\User\python code>python -m PyInstaller StockTickersM.py
C:\Users\User\python code>python -m PyInstaller IndexTickersM.py
After running this you can overwrite the file.
.
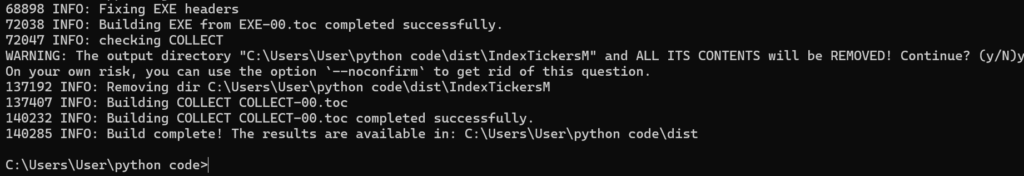
When you are finished, with this command, you will get a message as to where the file is, as shown in the excerpt below.
.
.

.
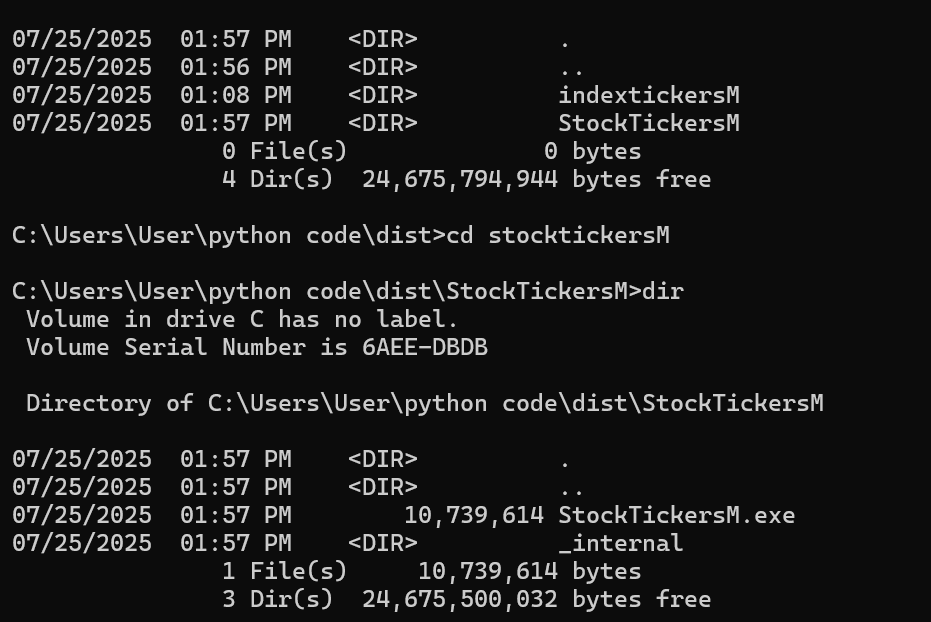
You can go and find the file and see if it works as illustrated below.
.
.
Adjusting the Name of the Files when you Copy to Your Computer
.
First, you put the files into a directory
.
.