This page reviews financial statement analysis that is essential for corporate modelling. Accounting issues necessary for evaluating financial analysis are discussed including depreciation and deferred taxes and accounting for financial derivatives. More tricky issues associated with the valuation of derivatives and how they correspond to valuation theory is addressed. The implications of financial statement analysis for credit analysis and credit analysis are also addressed. After teaching a course on financial analysts to people who have no financial background, I put together some power point slides. These slides begin with fundamental You can download slides that work through financial analysis by pressing on the button below.
[wonderplugin_video iframe=”https://www.youtube.com/watch?v=-1KXpfObH9g” videowidth=600 videoheight=400 keepaspectratio=1 videocss=”position:relative;display:block;background-color:#000;overflow:hidden;max-width:100%;margin:0 auto;” playbutton=”https://edbodmer.com/wp-content/plugins/wonderplugin-video-embed/engine/playvideo-64-64-0.png”]
Computing Return on Invested Capital
One of the ways I suggest performing financial statement analysis is to compute invested capital associated with earning EBITDA or NOPAT (net operating profit after tax). You can compute invested capital by splitting up the balance sheet into assets and liabilities related to EBITDA and operations versus assets and liabilities related to financing and other activities that are not directly related to earning EBITDA. Because the balance sheet balances you should be able to compute the invested capital from other the direct assets or the financing of assets net of other activities.
You can allocate assets and invested capital by putting +1 and -1 in columns next to the balance sheet as illustrated in the screenshot below. One column is titled “Assets and Liabilities Associated with EBIT” while the second is titled “Net Financial and Other Assets and Liabilities Not Associated with EBIT”. For assets, you can work through each category and use your judgement to determine which is related to operations. For those assets related to operations, use +1. For the assets not related to operations put a -1. Note that you should not put the +1 and -1 in the subtotal or the grand total lines.
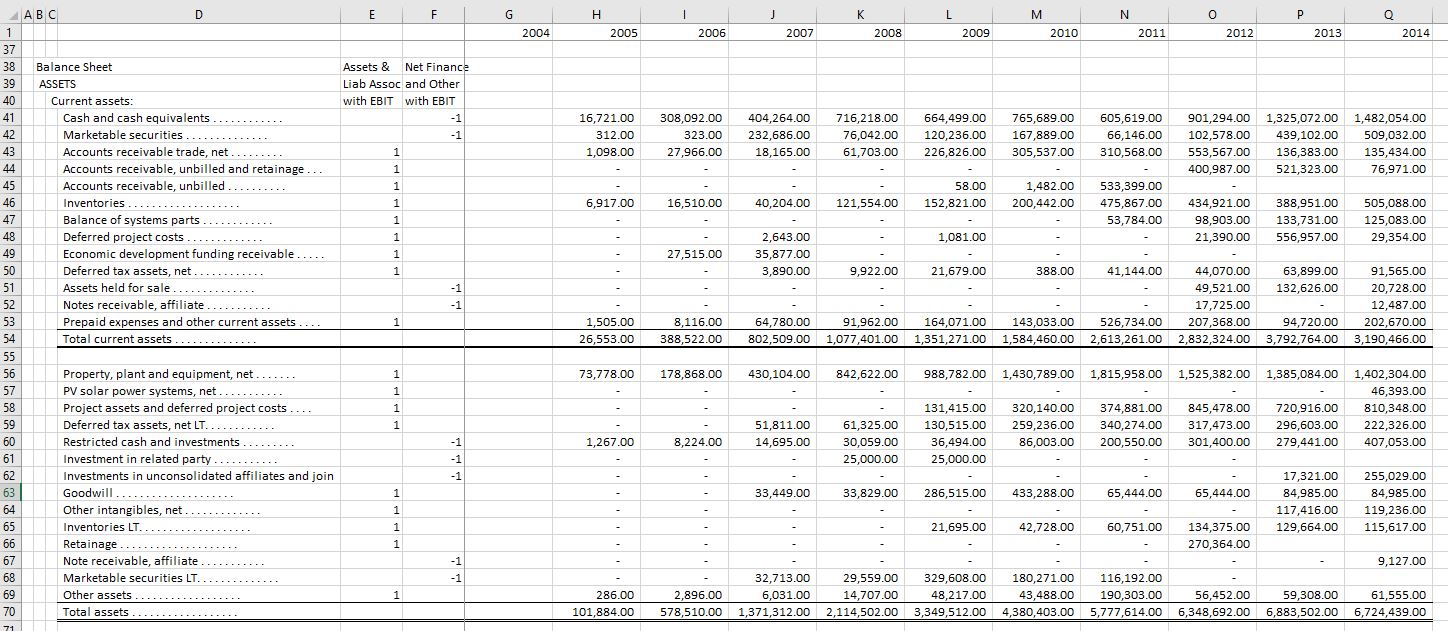
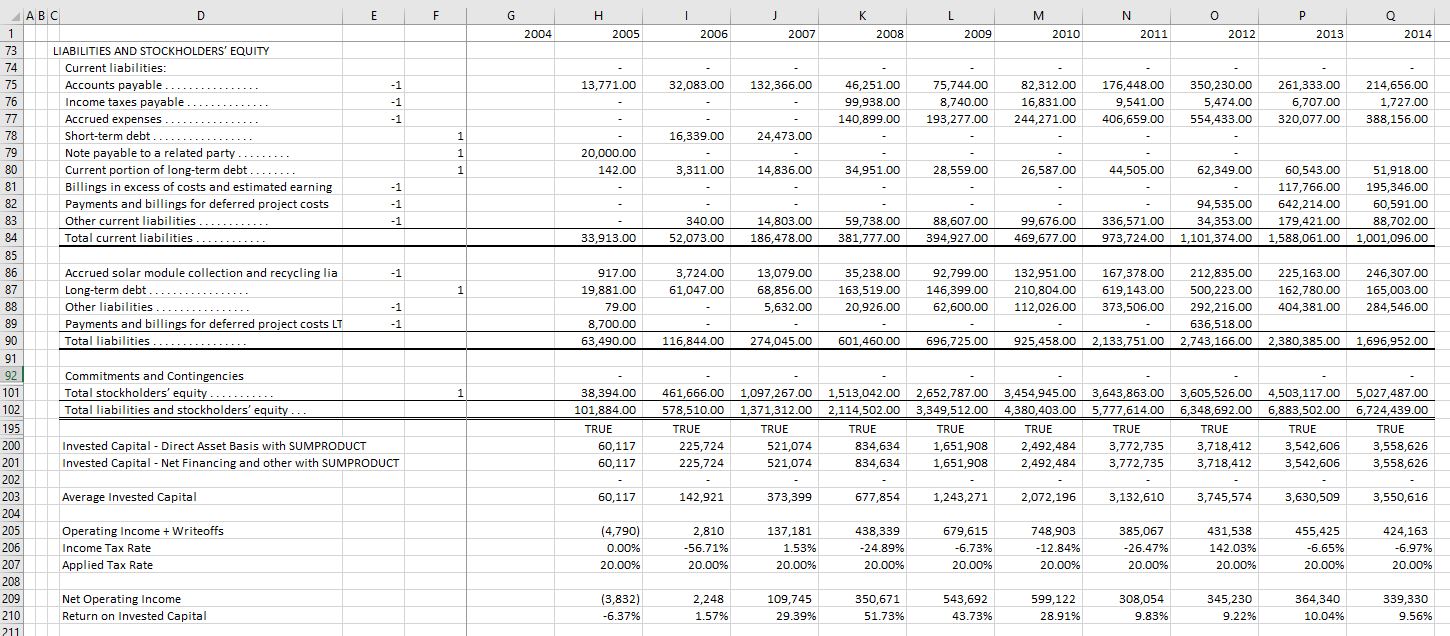
After entering the assets, you do something similar with liabilities and capital. For this, you can put in a -1 for liabilities such as accounts payable associated with operations.
Alternatively, you can look at the page named “2004-2014 Financial Statements” where I have made a similar calculation. When you use the SUMPRODUCT function, do not forget to press the F4 function on the +1 and -1. Also, in the SUMPRODUCT, you must have the same number of rows for the +1 and -1 column as the column for the balance sheet.
Videos that Describe Financial Statement Analysis
This video works through financial statement analysis beginning extremely simple examples. Some more advanced issues associated with deferred taxes and other items are discussed. The general objective of the video is to demonstrate what selected financial ratios really measure.
[wonderplugin_video iframe=”https://www.youtube.com/watch?v=XtVEwJqZ8D4&t=226s” videowidth=600 videoheight=400 keepaspectratio=1 videocss=”position:relative;display:block;background-color:#000;overflow:hidden;max-width:100%;margin:0 auto;” playbutton=”https://edbodmer.com/wp-content/plugins/wonderplugin-video-embed/engine/playvideo-64-64-0.png”]
The second video moves to more advanced financial statement analysis including the accounting for accumulated other comprehensive income as well as differences between hedge accounting and recording changes in the value of financial instruments on the balance sheet.
[wonderplugin_video iframe=”https://www.youtube.com/watch?v=Z64SGNXDOyA” videowidth=600 videoheight=400 keepaspectratio=1 videocss=”position:relative;display:block;background-color:#000;overflow:hidden;max-width:100%;margin:0 auto;” playbutton=”https://edbodmer.com/wp-content/plugins/wonderplugin-video-embed/engine/playvideo-64-64-0.png”]