This page illustrates some modelling issues that can arise when preparing an analysis of an airport. Some of the issues addressed include: (1) incorporating history with different timing (e.g. quarterly and monthly history); (2) using budget and historic data as basis for forecast; (3) correcting model with scenarios; (4) evaluating and modelling issues associated with cash flow waterfall and defaults; (5) computing financial ratios for airport analysis. Depending on the airport, there may be more corporate finance concepts than project finance concepts. The buttons below contain some examples of airport models including an example of a forecast of airport traffic. The first button has a financial model demonstrating the incorporation of history.
Airport Financial Model that Includes Selected Exercises where You Compute Some Financial Ratios
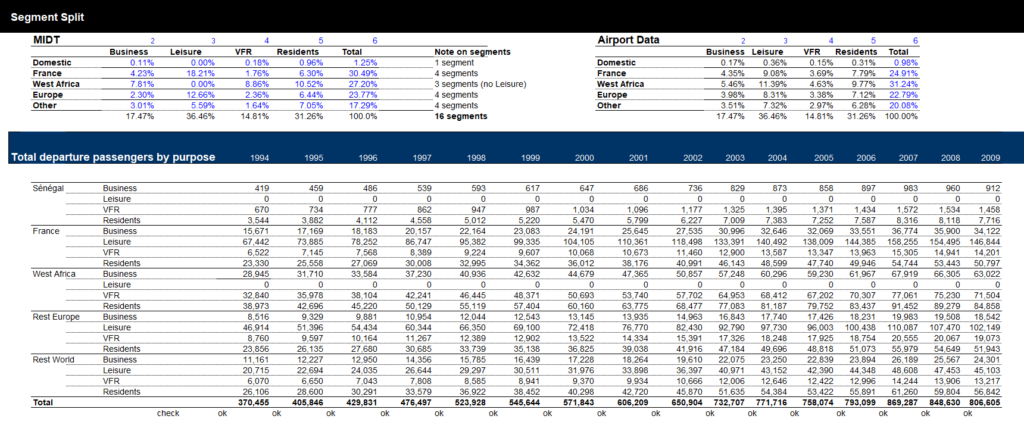
I will use a case study that demonstrates how you can evaluate an airport analysis. I start with historic traffic — note how it can be categorised according to different types of traffic. You can get fancy and make the forecasts with income and price elasticity, but the first thing to do is to compare the forecasts you get to the actuals. An example of a volume forecast is attached to the button below. The forecast is developed from this history and later you can compare the forecast to the history.
There are several reasons why most airports globally remain financially solid and have ratings in the ‘A’ and ‘BBB’ categories, despite these risks.
- Competition is more limited as the capital-intensive nature of airports, combined with the regulatory hurdles of a public utility-like industry, creates strong barriers to entry.
- These barriers include the cost of land acquisition and air space requirements, significant environmental hurdles and opposition from the population affected by land acquisition and noise.
- Airports generally operate under a cost-recovery model that can help keep cash flows relatively stable.
- While the airline industry continues to go through its profitable and unprofitable cycles, airports do have a strong debt repayment history and Fitch expects this to continue.
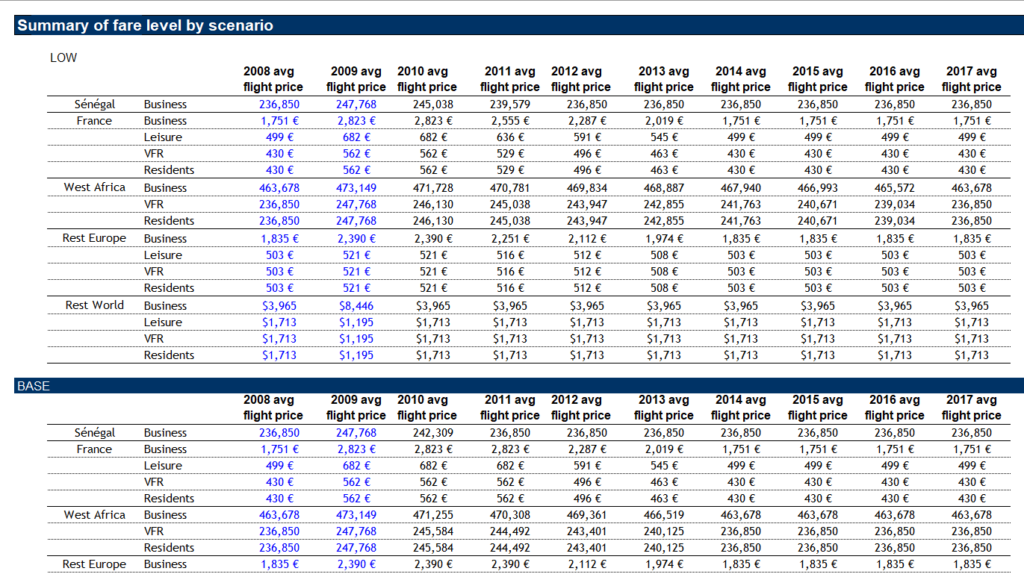
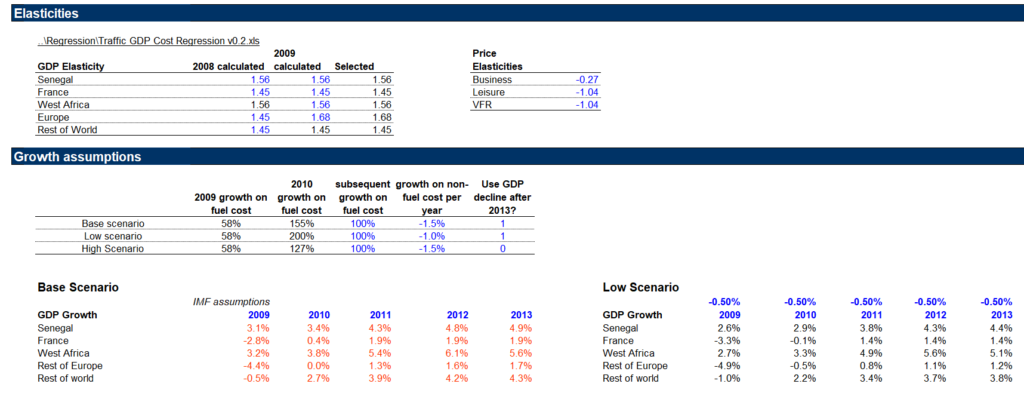
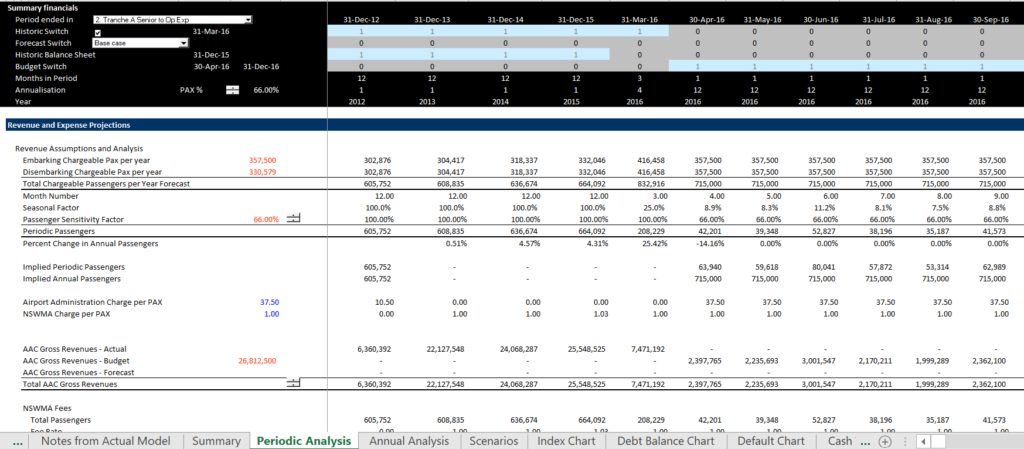
The next screenshot demonstrates the projected cost of flights which are used with an elasticity parameter to make a forecast of demand. The second screenshot below illustrates the parameters.
If it is not done, the first thing you should do is to create a graph of the actual and the forecast.
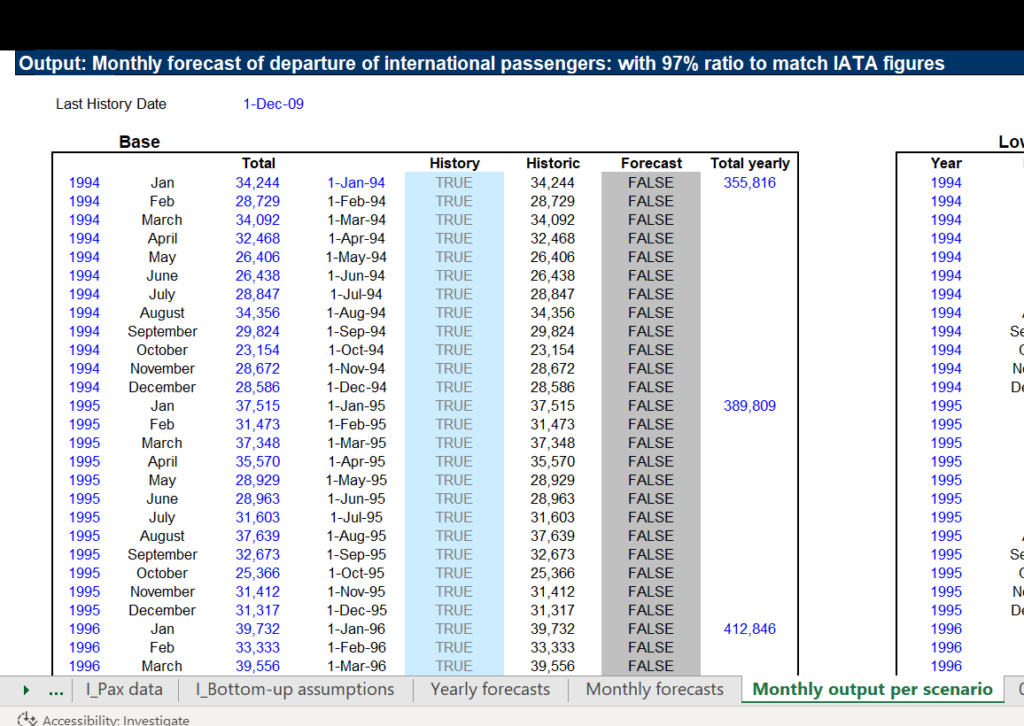
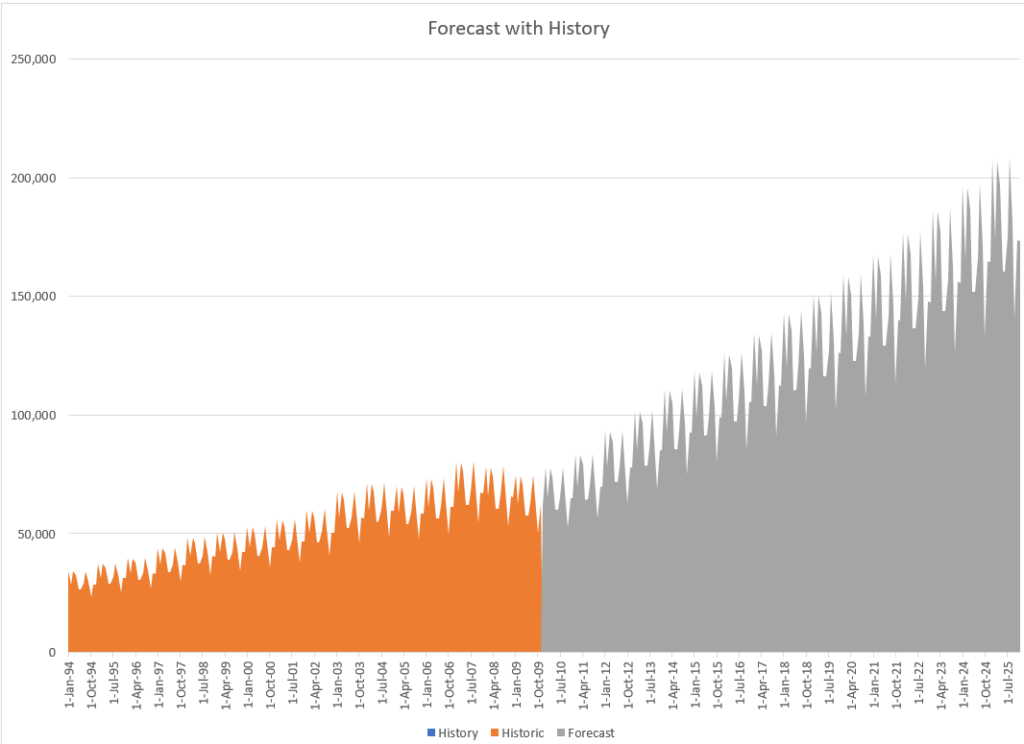
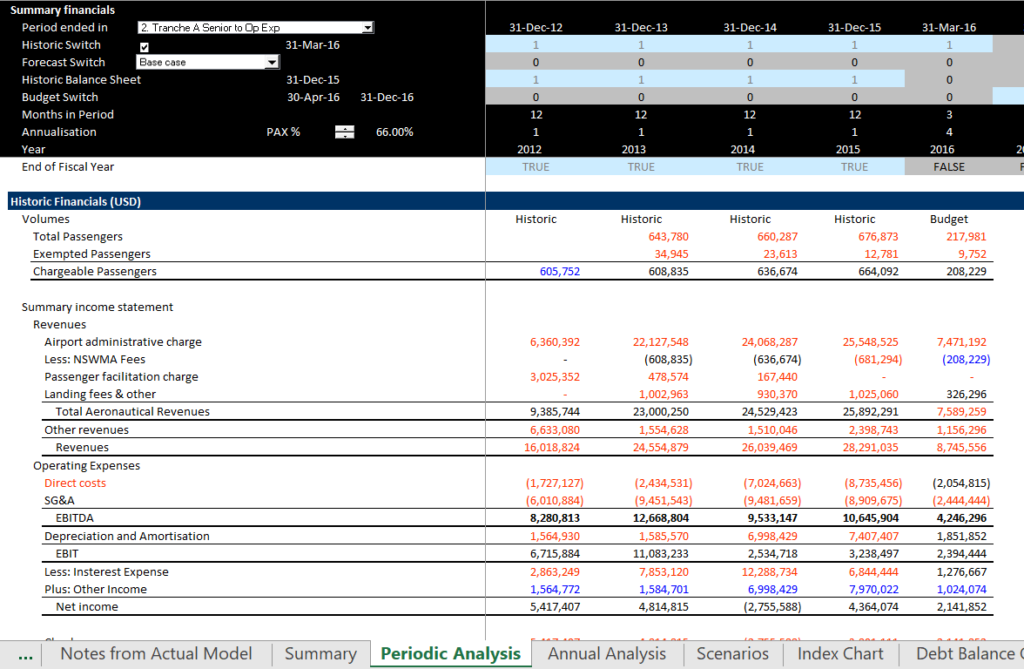
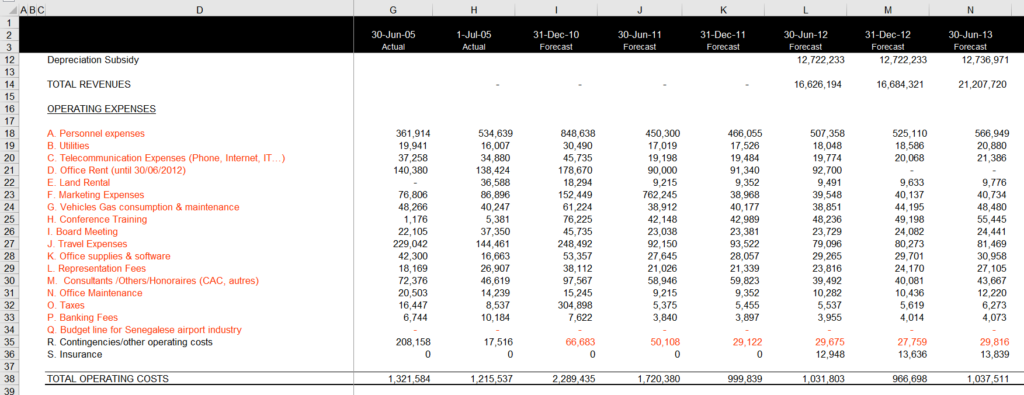
Like any corporate model, begin with history. You should include history in all of the evaluation of assumptions and include history in the financial reports. Do not worry about the periodicity. You can be completely flexible and then refer to the months in period.
Strong
- Large and robust metropolitan/regional air service area, in a region with a mature economy, with an O&D enplanement base of 5 million or more Lower traffic volatility with historical and prospective peak-to-trough decline of around 5%
- Connecting traffic of up to 20% for domestic airports and higher for international gateways
- Single carrier concentration of 30% or less with extensive nonstop and international service offerings
- Relatively equal mix of business and leisure traffic
- Minimal competition from other airports/modes of transport
Moderate
- Midsize air service area with solid economic underpinnings and an O&D enplanement base of 2 million−5 million, or an airport in a region with a developing-stage economy
- Moderate traffic volatility with historical and prospective peak-to-trough decline of around 10%–15%
- Connecting traffic of 20%−60% or supporting a primary connecting operation, or a major carrier base of operations
- Single carrier concentration of 30%−60% with broad service offerings
- Leisure traffic exceeds business traffic
- Some competition from larger airports with more extensive service, or other modes of transport
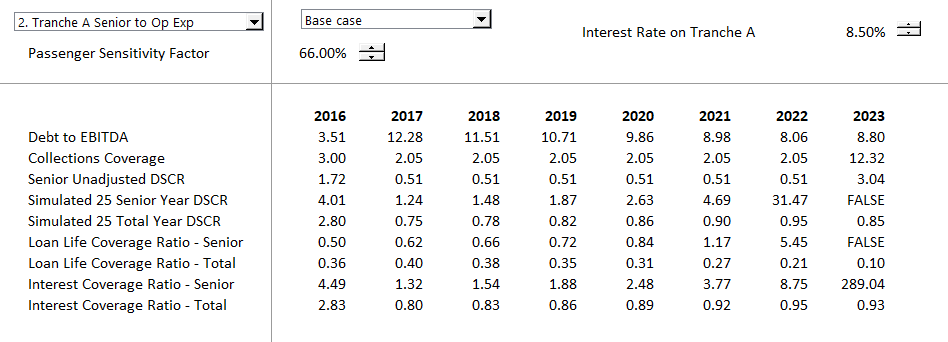
- Examples of financial ratios you may include in an airport model are shown in the table below.
Weak
- Small air service area with an O&D enplanement base of 2 million or less
- Elevated traffic volatility with historical and prospective peak-to-trough decline of over 20%
- Connecting traffic of 60% or more.
- Single carrier concentration of more than 60% or limited service offerings
- Meaningful competition from other airports/modes of transport
Excel File with with Example of Financial Model Including Economic Analysis and Financing Modules
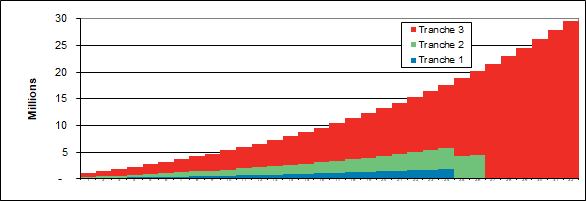
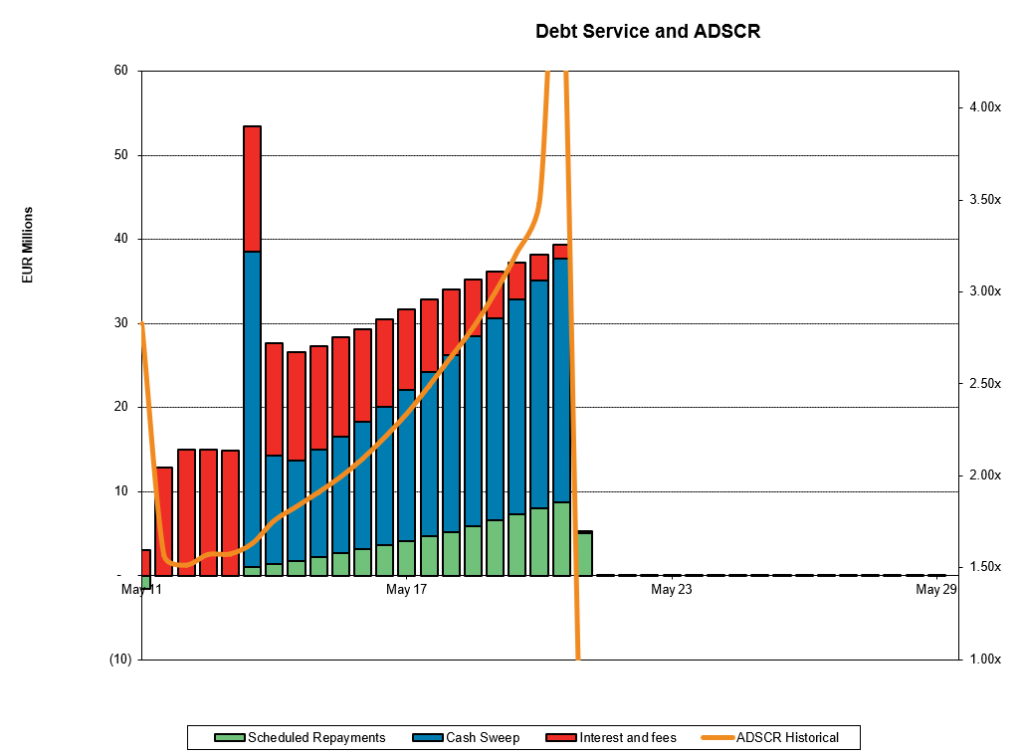
The repayment structure is for the debt is illustrated below. Note that Tranche 3 has the longest tenure and the debt repayment increases over time in an extreme manner.
Repayment with cash sweep — DSCR does not make much sense. First, there is a lot of cash flow after the period. Second there is no way to compute PLCR because you do not know the end of the life.
https://edbodmer.com/wp-content/uploads/2018/09/Dakar-Risk-Matrix.pdf
https://edbodmer.com/wp-content/uploads/2018/09/Airport Model Example.xlsm
https://www.fitchratings.com/site/infrastructure
https://www.fitchratings.com/site/dam/investors/Peer-Review-of-EMEA-Airports.pdf