This webpage demonstrates how to make a cost and benefit analysis of different strategies that can affect the reliability of electricity.
Examples of Situations where you Need to Compute Reliability
There are many situations in which you may want to compute the value of reliability in electricity. Some examples include:
- The amount of capacity needed to provide consumers with reasonable reliability
- Cost of reliability versus value of reliability
- Can evaluate the loss of load probability and put a cost on the time that load is not served
- Other examples
What kind of capacity should be built to assure that an off-shore platform will have sufficient reliability
- Measure the cost of an outage as the cost of lost margin from the platform
- Random or Forced Outage
- Scheduled Maintenance Outage
Definition of Outage for Electricity Plant
Submit schedule for approval from off-taker
- Coordination with other plants
- Calculation of optimal maintenance period
- Requirements for maintenance outage
- Penalties can be imposed for maintenance during peak periods
- Problems with Preventative Maintenance
- Poor Operations
- Cost of outage is the cost of and outage multiplied by the probability that the outage occurs.
- The value of an outage can be compared to the cost of avoiding the outage
- Strategies to reduce the outage cost could be building redundant plant or building smaller plants
- The cost of an outage can be measured by using Monte Carlo Simulation.
- In Monte Carlo Simulation, you use a random number to assign when the outage occurs and then run the analysis over and over again and accumulate the total amount of outages and cost.
Example of Reliability Analysis
The illustration below demonstrates how to make a Monte Carlo simulation to compute outage costs. A random number from 0 to 1 is put into the spreadsheet. When the random number is lower than the forced rate, the plant is assumed to be out. When the random number is above the forced outage rate, the plant is assumed to be available. This process is illustrated below.
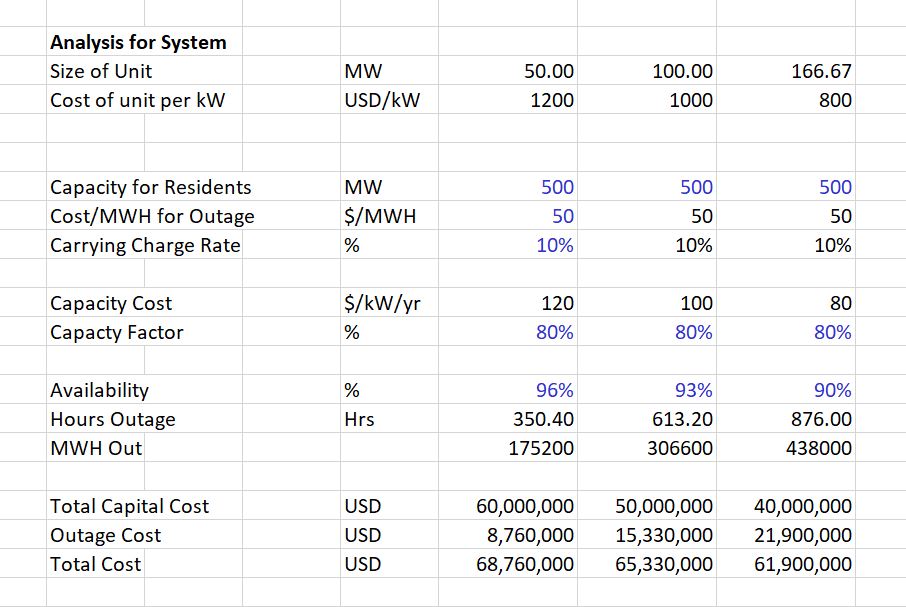
Inputs for different strategies. More reliability with smaller plants but the cost may be higher.
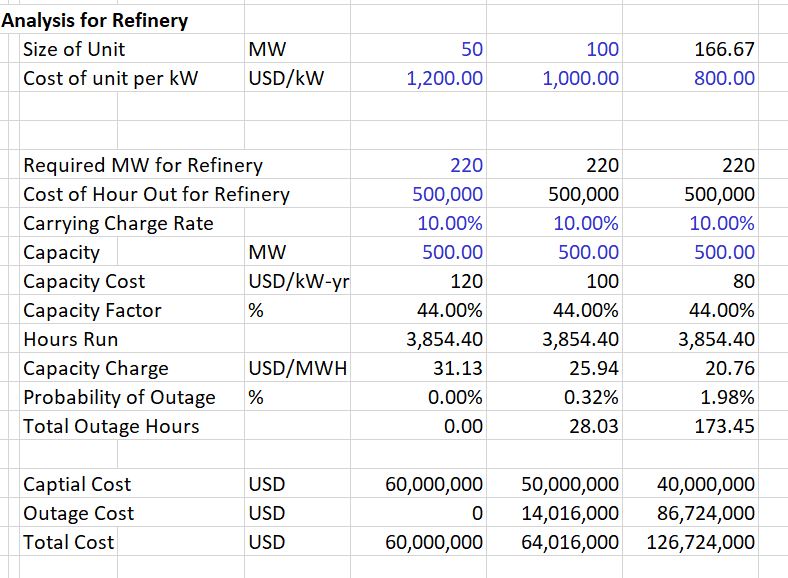
This page demonstrates the results of different strategies with the trade off between cost and value of reliability.
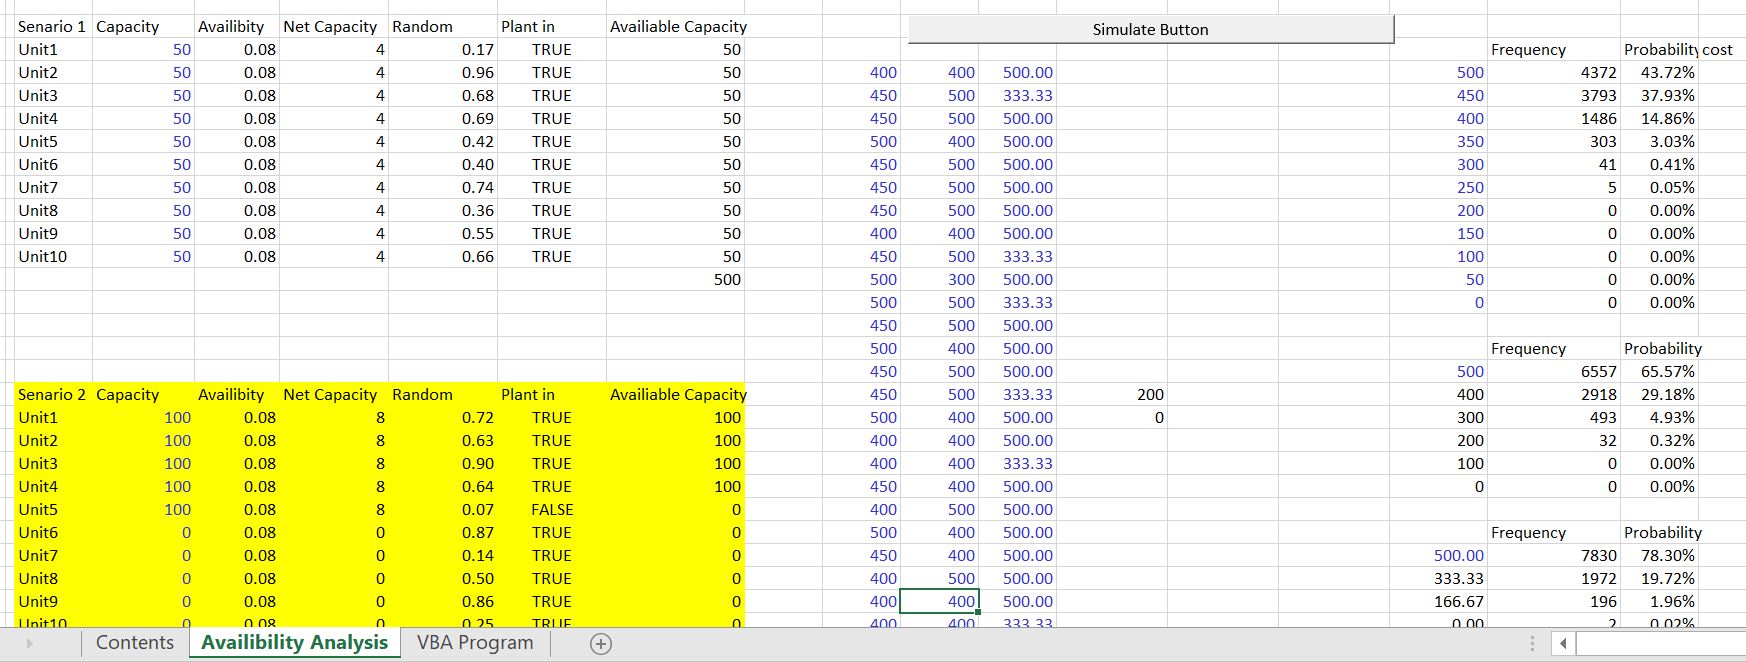
Sub simulate()

' simulate Macro

Number = InputBox("number of simulation")

For i = 1 To Number

     Cells(i + 16, 11) = Range("i26")

    Cells(i + 16, 12) = Range("i42")

    Cells(i + 16, 13) = Range("i58")

Next i

'

End Sub
Volatility, Monte Carlo Simulation and Shape of the Supply Curve
A key idea of this section is that the economics of different strategies depend importantly on the shape of the supply curve. For example, the economics of nuclear power is much higher if the gas price is high. Alternative supply curve shapes are illustrated below. With the steep supply curve, small changes in capacity and in demand and in other factors have a big effect on the marginal and total cost of electricity. In the case with flat supply curves all of these factors including the addition of solar and changes in demand have a much smaller effect.
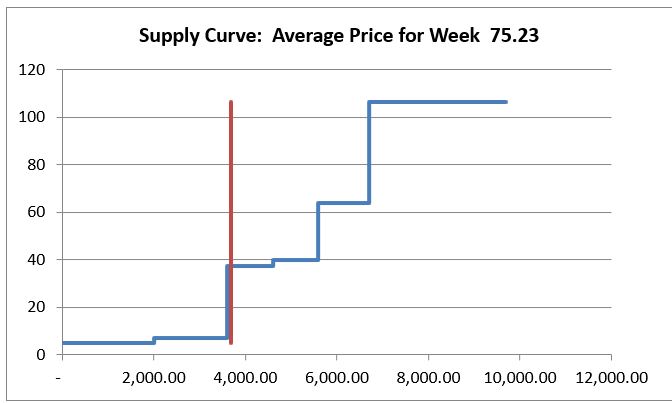
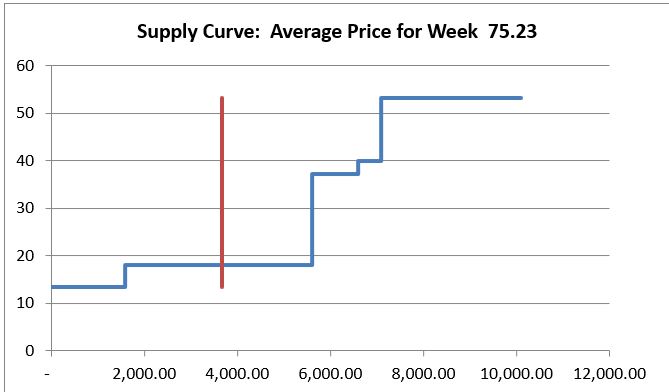
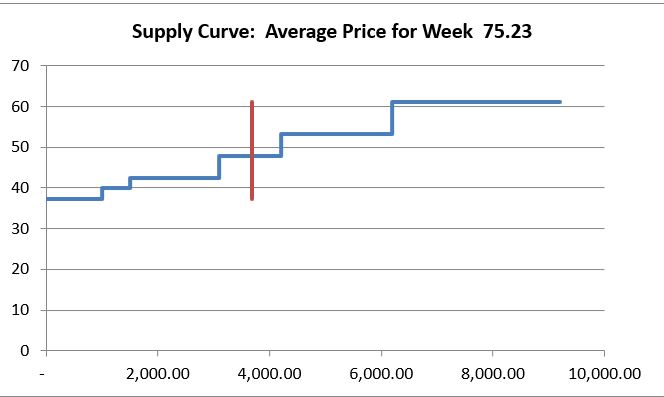
A file that demonstrates how different supply curves have a different effect on marginal costs and total costs is available for download below. This file includes a lot of simulation where equations are developed that include Monte Carlo for outages, Monte Carlo for demand, and Monte Carlo for gas prices. This file demonstrates that the difference in value for different strategies is much less for the flat curve than for the steep curve.
Excel File with Monte Carlo Simulation of Various Items in the Demand and Supply Curve