I have found it difficult to find historic data on the costs of solar modules (a general theme of my work is that you should evaluate history). This page describes a database of solar panel costs that derives data from the PVINSIGHTS website which publishes data on the current price solar panels manufatured from polysilcon and from thin film technology. You can use the code in the database to continually update the data and evaluate current prices by downloading the latest prices. Unlike other databases where I demonstrate how to download prices, in this file the older data is maintained so that you can see the history. If you want the latest download, you can contact me and ask for the resource library. The solar panel price database demonstrates a dramatic decline in the cost of solar modules. The solar price database also demonstrates how you can scrape data and create a time series database by re-uploading data at periodic times. The solar cost database that you can update is available for download by clicking on the button below. After opening the excel file you can click on a couple of buttons and update the database as describe below. Because of the manner in which downloads from different dates are retained, you have to also re-format the database. If you need a database with some of the data filled in, send me an e-mail at edwardbodmer@gmail.com and go to Chapter 1 and then to the databases. Note that when you use pvinsights you will probably have to provide a password.
I try to update this file on the website. But if you don’t have the latest version, send me an email at edwardbodmer@gmail.com and ask for the resources. This file is in Chapter 1 and then in the database section. It is named ReadPVInsights.xlsm. I have put a lot of graphs in the database and illustrated how you can make a flexible graph. Some of the graphs are shown below the button that is attached to the file. The way you can operate the file is shown below the graphs. The main thing to do is just to press the button that is called “Get PV Insights” from the Database sheet.
.
File with Database of Solar Costs from Scraping the Website PVINSIGHTS and then Re-Formatting
.
.
.
.
.
.
.
.
There are a lot of solar pages related to the files and the methods described below.
- The featured solar model page that is linked to this sentence includes completed finance models.
- There is also a file that allows you to automatically download panel prices and the price of silicon used in manufacturing the panels which is linked to this sentence.
- There is a webpage that works through resource issues including the performance ratio and how to find the best data on solar energy that hits a panel.
- There is a webpage that describes computation of the P50 versus P90, P99 etc. with some examples.
- There is a webpage that describes the arcane tax equity aspects of financing tax equity in the U.S.
- There is a page that works through how to consolidate multiple roof-top installations into a aggregate file.
Using and Updating the Solar Cost Database
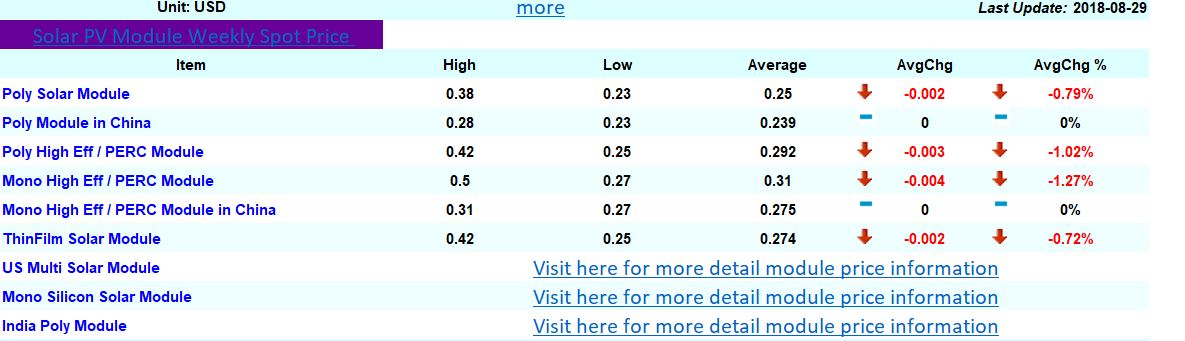
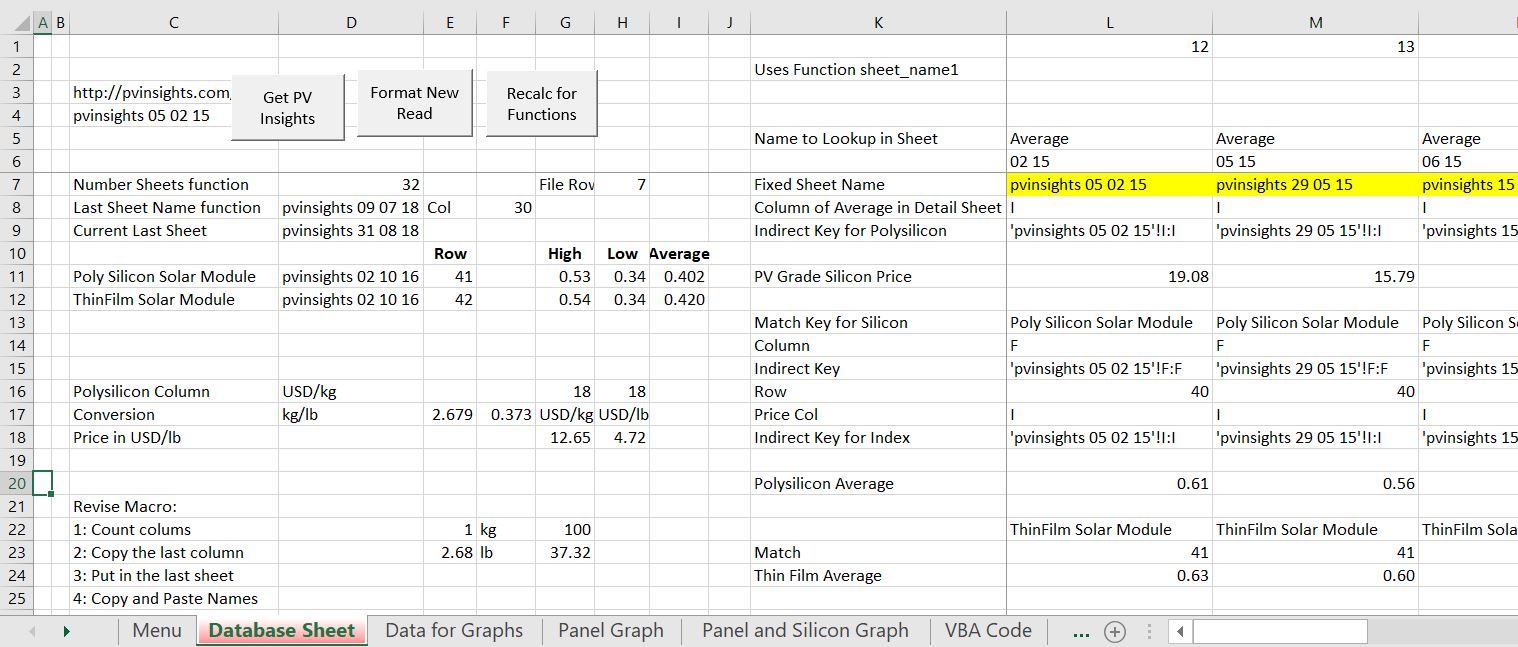
If you want to use the file to upload trends in solar data you can follow the instructions below. These instructions walk through downloading data to formatting data to using the graphs. To illustrate how the process works, I start with the end of the file. The sheets at the end of the file include the downloaded data from PVINSIGHTS at different dates — note that the date is part of the sheet name. The format of the PVINSIGHTS presentation has changed over time (for example the name Chinese poly silicon was changed) meaning finding the data from each sheet and recording the data in a summary sheet has changed. The format of PVINSIGHTS panel prices that you can find in the spreadsheet is shown in the screenshot below.
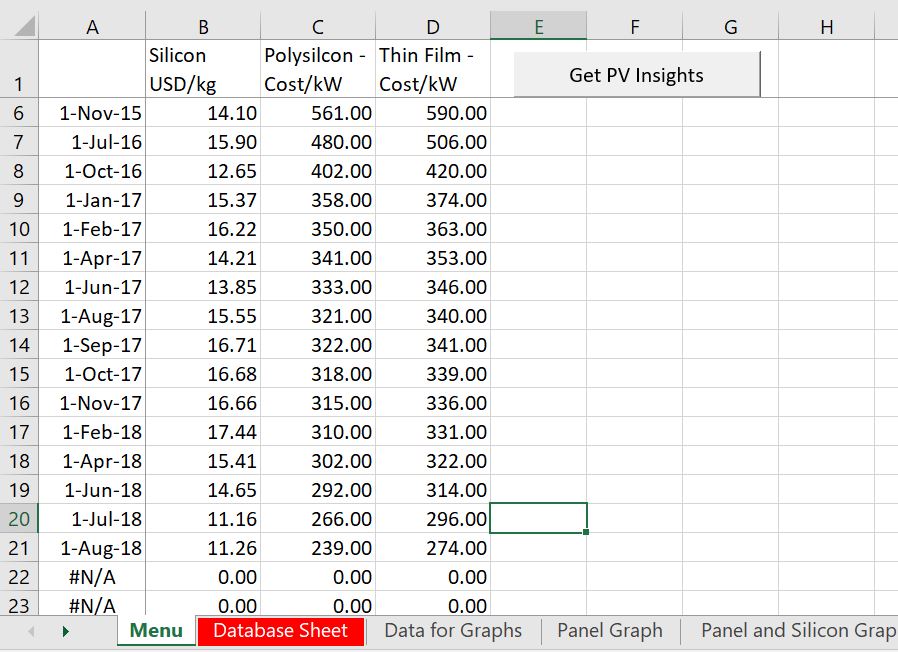
To get the data, you go to the page named menu and press the menu button. The macro attached to this button uses the WORKBOOKS.OPEN function and puts the downloaded data in a new sheet. The new sheet is re-named using the date that you download the file. The screenshot demonstrates where you can press the button to read new data.
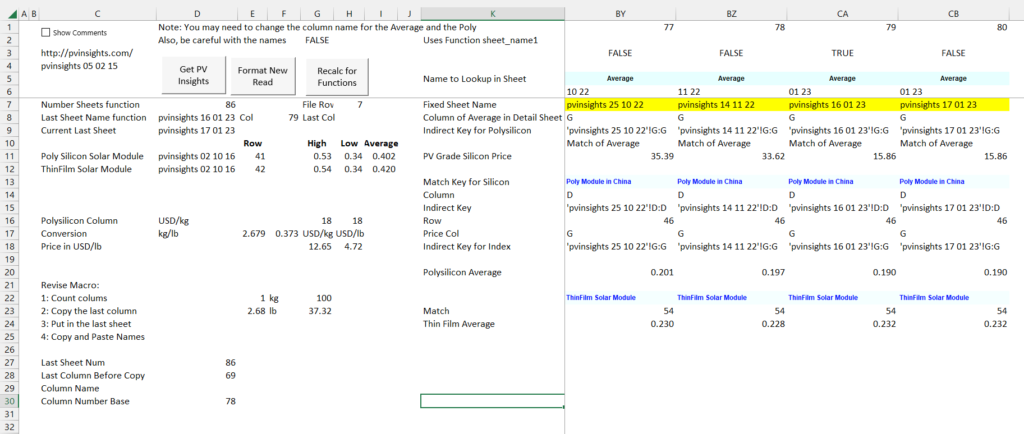
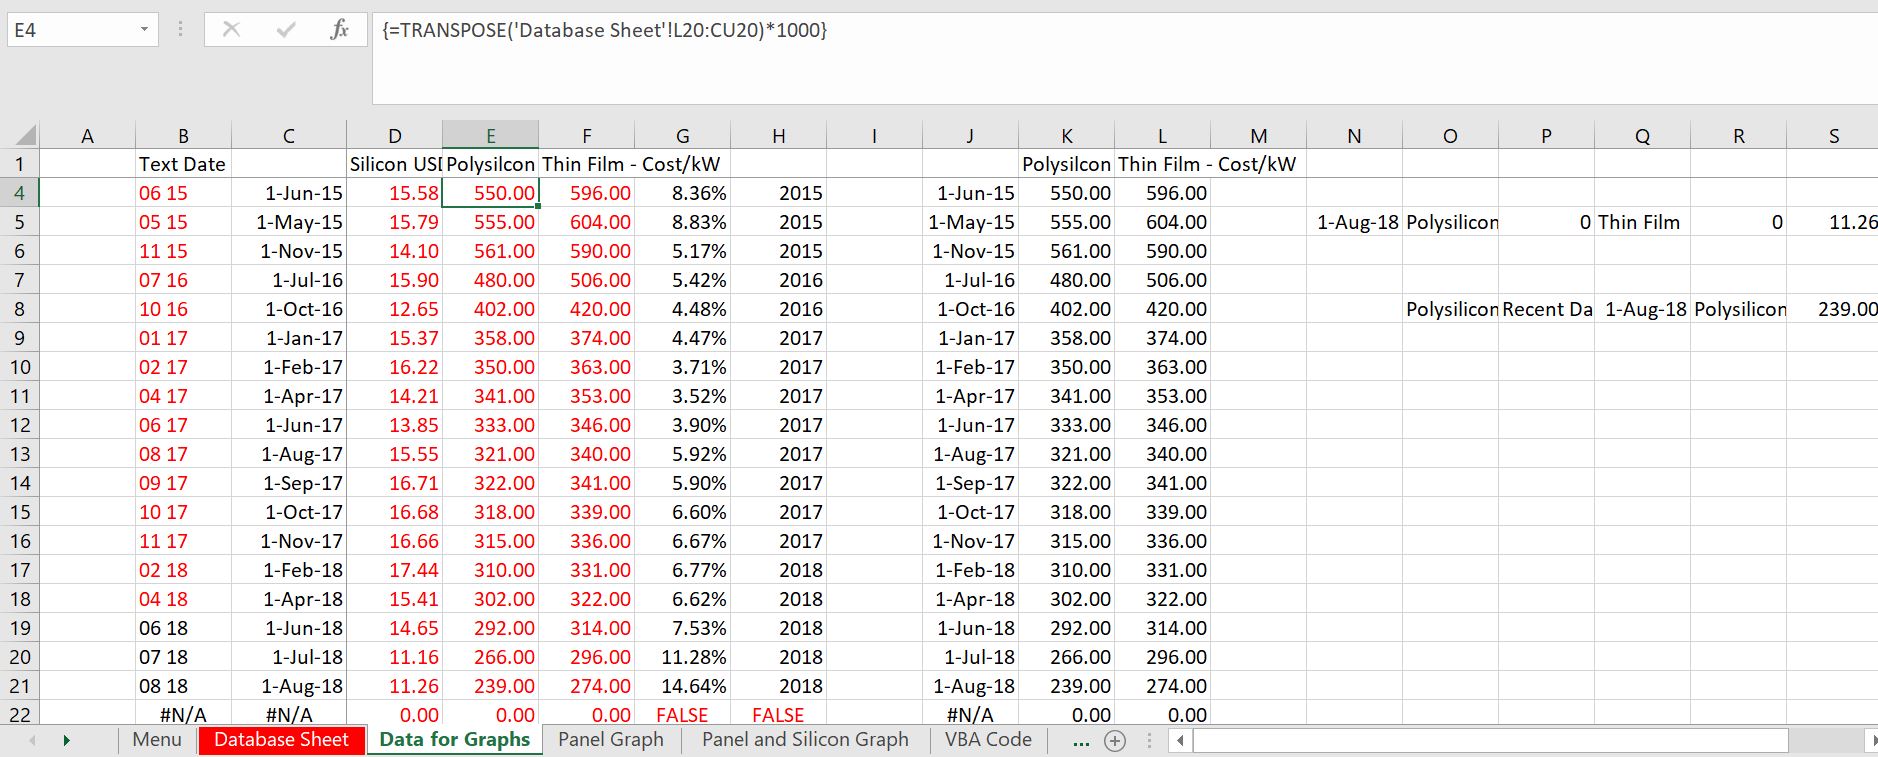
You are not finished after reading the data. You must add a column to re-format the data and then copy the sheet name so that you can use the INDIRECT function. The INDIRECT function needs the sheet name and the MATCH function needs the name in the sheet to look for — the poly silicon modules cost and the thin-film cost. To do this in an automated way, you can go to the database sheet and press the button for re-formatting the sheet.
After re-formatting the data you can look at the graphs and the summary. The summary just uses the TRANSPOSE function and puts in #N/A for data future dates. The #N/A is used for the x-axis of the graphs.
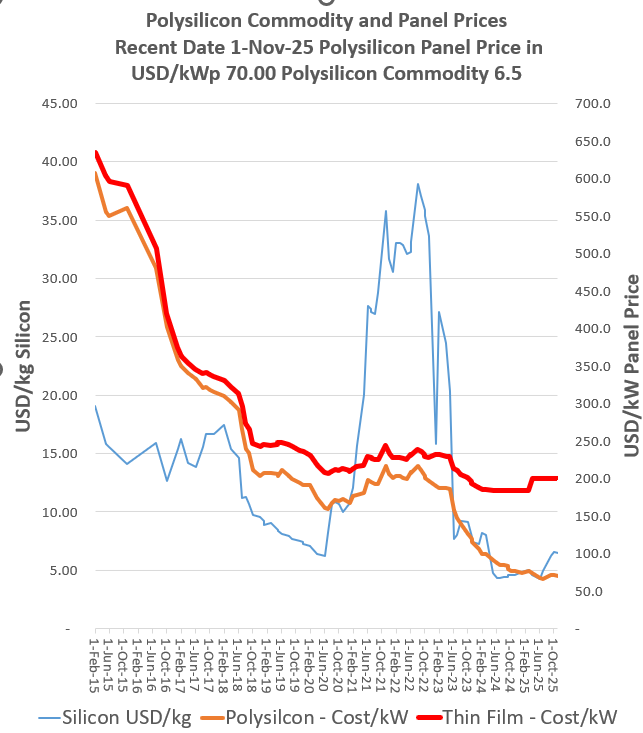
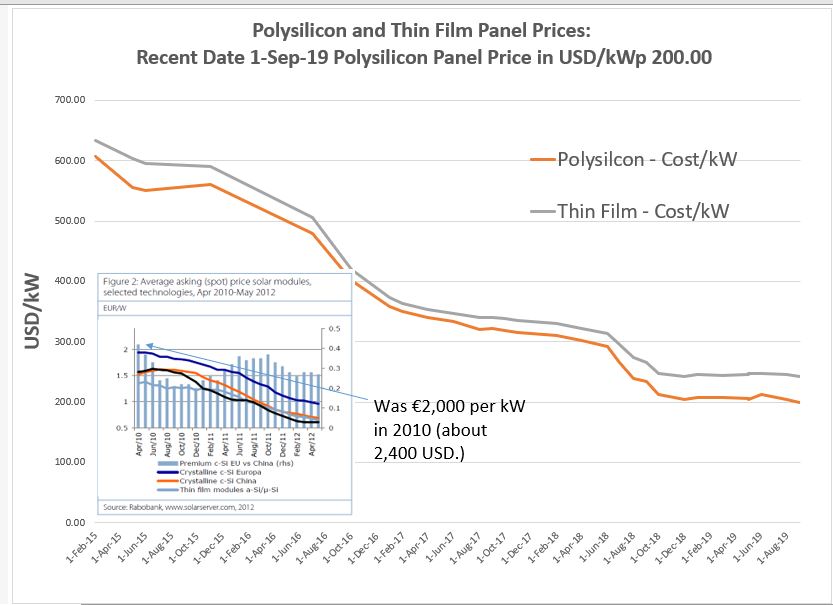
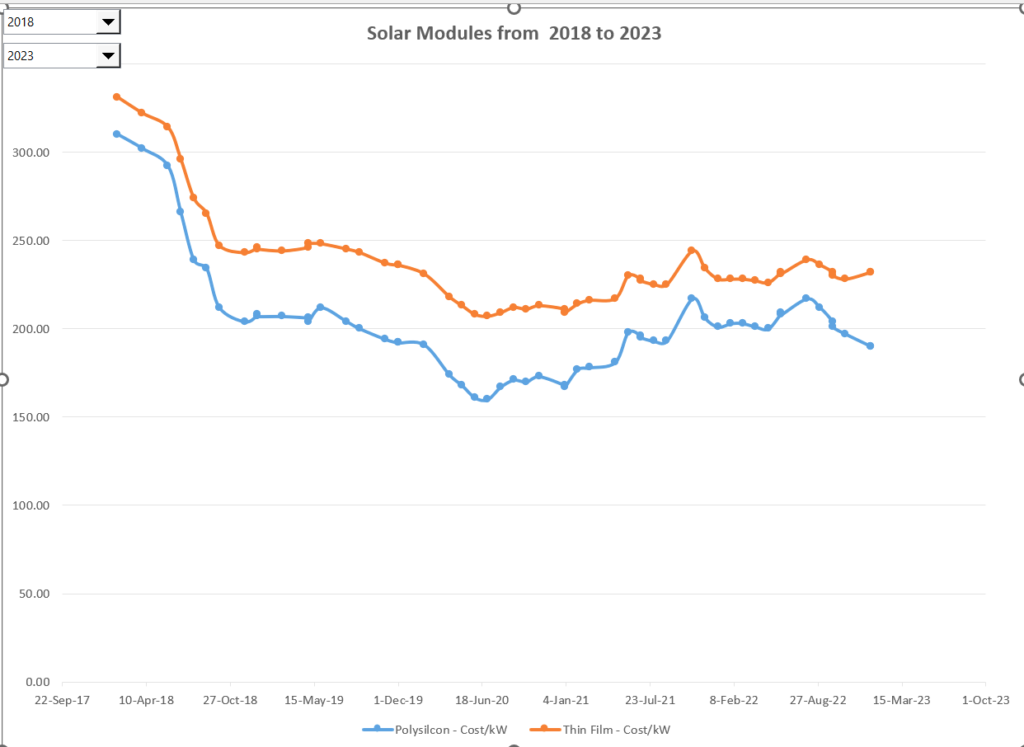
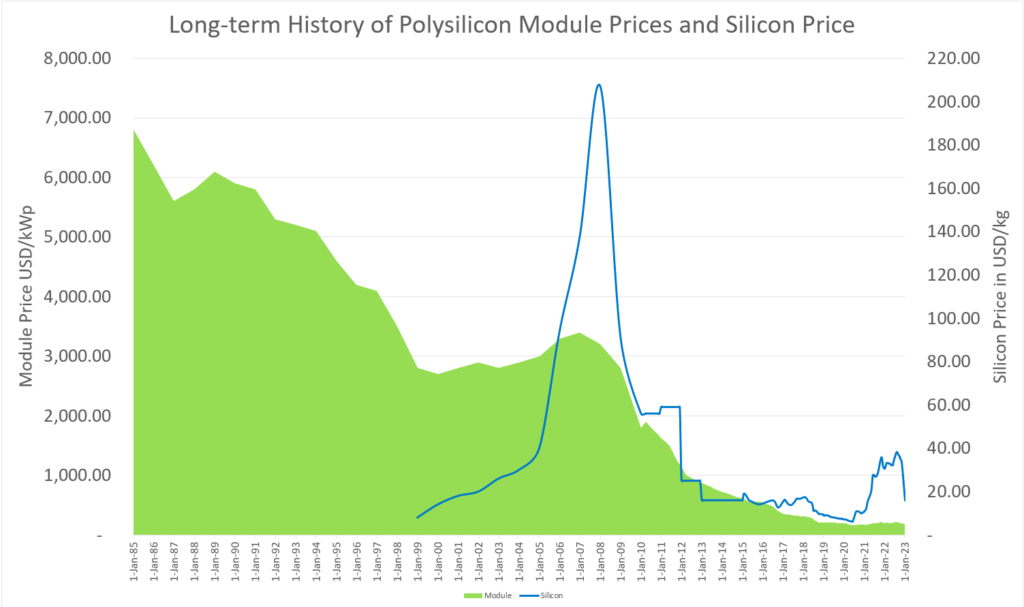
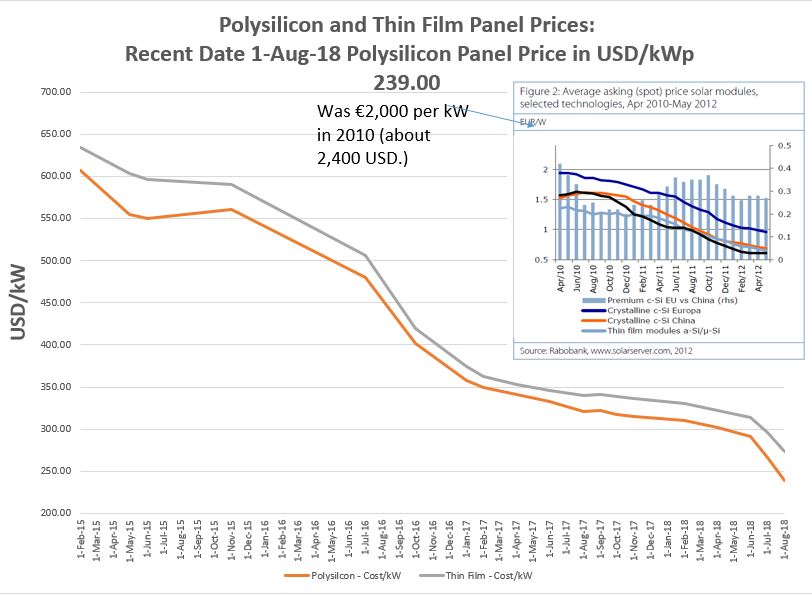
Finally, you can look at the graphs. The graphs of module prices and module prices along with silicon prices are illustrated below. The first graph demonstrates just how dramatic the reduction in price for solar modules has been. In the year of the graph for 2010, the
Technical VBA Code for Reading PVINSIGHTS
The VBA code for reading the data is below.
.
.
Sub read_file() ' Reads PVinsight

base_status = Application.Calculation
Application.Calculation = xlCalculationSemiautomatic

Application.DisplayAlerts = False

base_book = ActiveWorkbook.Name ' Define current workbook as ususal
base_sheet = ActiveSheet.Name
base_cell = ActiveCell.Address

num_sheet = Sheets.Count

Workbooks.Open (Range("url")) ' Read PV Insights

temp_book = ActiveWorkbook.Name ' name of new book read
sheet_name = ActiveSheet.Name ' name of sheet name

date_time = Now() ' Get Current Date
date_time1 = WorksheetFunction.text(date_time, "dd mm yy") ' Put Date in Format
sheet_name = sheet_name & " " & date_time1 ' Combine Sheet Name with date
ActiveSheet.Name = sheet_name ' Re-name Sheet

On Error Resume Next
Sheets(sheet_name).Move After:=Workbooks(base_book).Sheets(num_sheet) ' Move Sheet to this workbook

Workbooks(base_book).Activate
Workbooks(temp_book).Close ' Close the Workbook read

Format_New_Read

Application.Calculation = xlCalculationSemiautomatic

End Sub
Technical VBA Code for Re-formatting the Data
The VBA code for re-formatting the data is below.
.
Sub Format_New_Read()
'
' Macro1 Macro
'

Application.Calculate
Application.CalculateFullRebuild


Select Case Range("last_col") ' Get the column letter for the last column read

Case 10: col_name = "J"
Case 11: col_name = "K"
Case 12: col_name = "L"
Case 13: col_name = "M"
Case 14: col_name = "N"
Case 15: col_name = "O"
Case 16: col_name = "P"
Case 17: col_name = "Q"


End Select

range_name = col_name & ":" & col_name 'Make entire col

'
Columns(range_name).Select
Selection.Copy
Cells(1, Range("last_col") + 1).Select
ActiveSheet.Paste
Application.CutCopyMode = False

'
Range("last_sheet_name").Select

Application.CutCopyMode = False
Selection.Copy

Cells(Range("File_row"), Range("last_col") + 1).Select

Selection.PasteSpecial Paste:=xlPasteValues, Operation:=xlNone, SkipBlanks _
:=False, Transpose:=False
End Sub


.
.
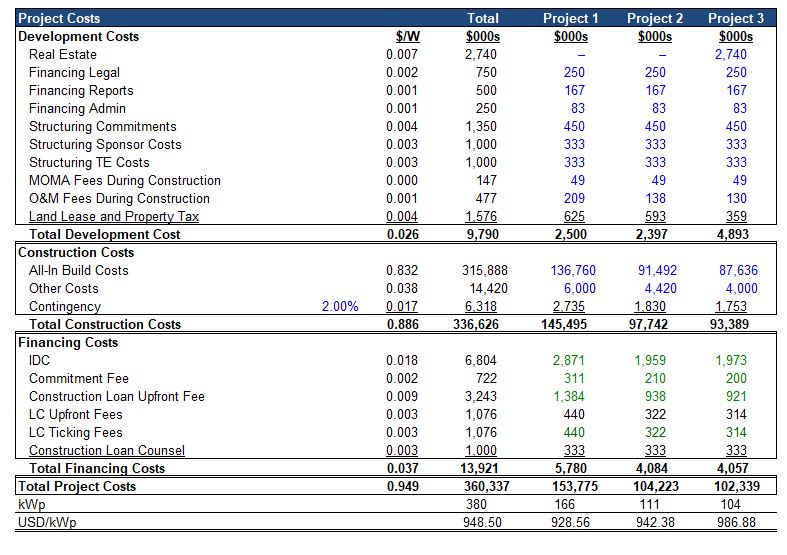
Difference between Panel Price and Total Cost
I have put together a few solar estimates below