This webpage provides some ideas on how you could review a large project finance model that you receive from somebody else. Project finance model review can be very painful and in this page I give you some suggestions on how to reduce the pain. I struggle with coming up with a universal and structured way to review a model, so I have presented a case study. Some of my suggestions for model review include: (1) adding some basic formatting to a model; (2) creating a simple graph of cash flow and debt service; (3) computing the pretax project IRR from EBITDA, Working Capital Changes and Capital Expenditures; (4) Using the INDEX function along with a spinner box to make multiple graphs for long sheets that have hundreds of rows and where it is difficult to evaluate assumptions; and (5) make a systematic review is suggested through segregating cash flows into different components and computing a series of IRR’s, the first of which is an overall debt IRR. Other methods including creating selected graphs, adding simple sensitivity and evaluating the effect of different assumptions. The final method of verifying the model is to create a parallel model and evaluate items that can cause circular references. I will be making a page on project finance model history where I compare models from the 1990’s, the 2000’s, and the 2010’s. For the most part this history reveals a sad story. Models have become very cumbersome, very difficult to interpret and scary to change.
The review of a model depends on your objectives. Objectives could be credit analysis and understanding of risks; negotiation of debt terms; financial advisory on structuring; understanding of the details of a transaction (such as an EBL structure, where where the capitalised interest ends up, what is deducted in computing taxes, how CFADS is computed), evaluation of the PPA or other contracts or re-structuring of a model to make it flexible.
Case Study of Reviewing and Restructuring an Actual Model
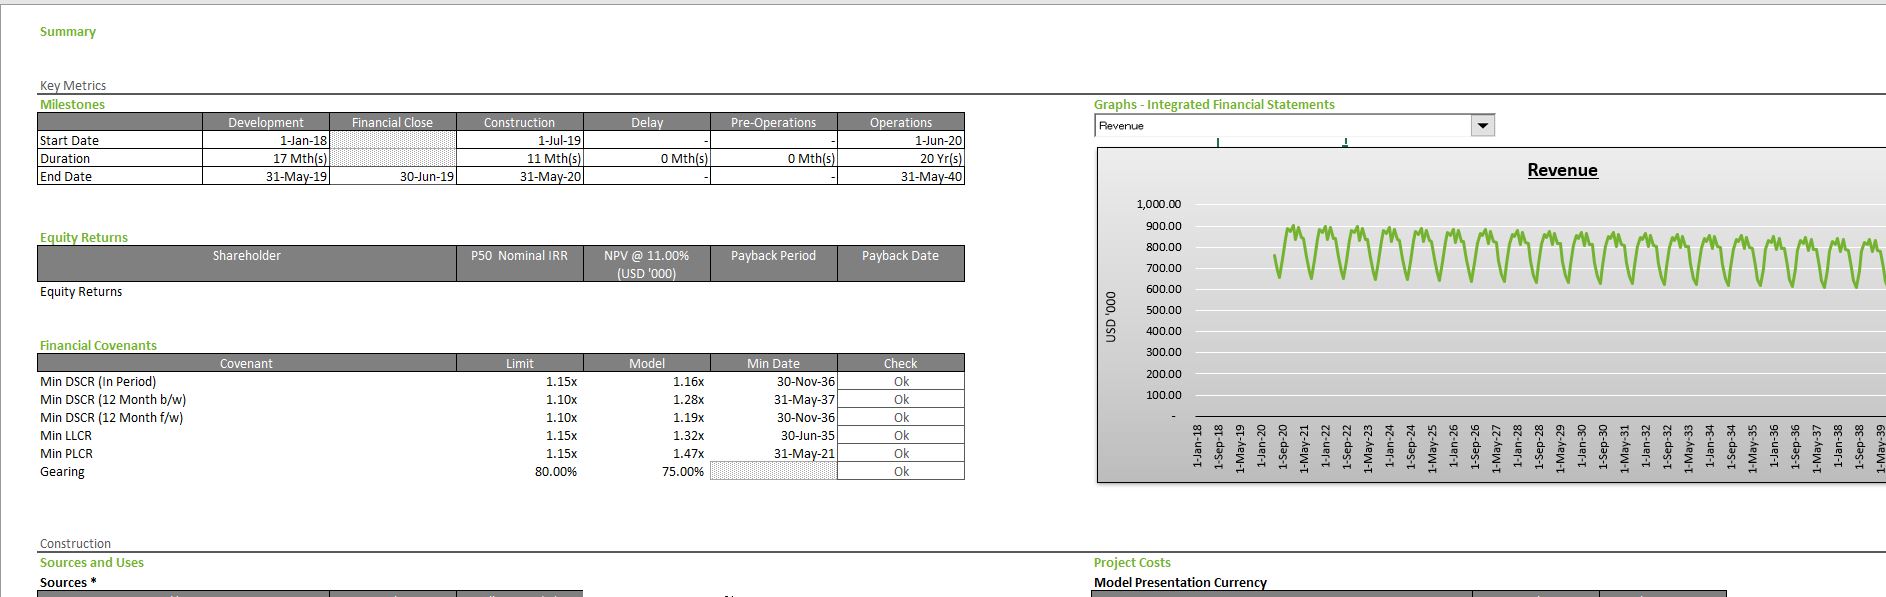
In the next few paragraphs, I will walk through how I have reviewed a model. My first step is to implement the generic macros, remove the merged cells, put key titles in a thin column A and take out the surplus data that is often in the right hand cells. I put more of the re-formatting below this paragraph and you can go to the generic macro page to review how to get a format that will not be irritating for you. After re-formatting, I looked for the most useful graph, that is the CFADS and debt service graph. It is unbelievable, but the sophisticated model that I reviewed had a size of more than 9MB had many graphs, but not the key CFADS and Debt Service graph. If the model does not have this graph, you should make it at the start. So, when I see graphs like the ones below I just get mad and delete them (even though I used to do this a lot). In the case of my review, I look for the CFADS and Debt Service and go to the bottom of the page and set-up the two lines. After that, I use the NA() trick along with the IF trick that if you put in a test, and the number is not equal to zero, the answer is TRUE. If the number is equal to zero, then the result of the IF test is false.
So say you have the series of data below in the model you are reviewing (where the zeros are for the construction or pre-COD period):
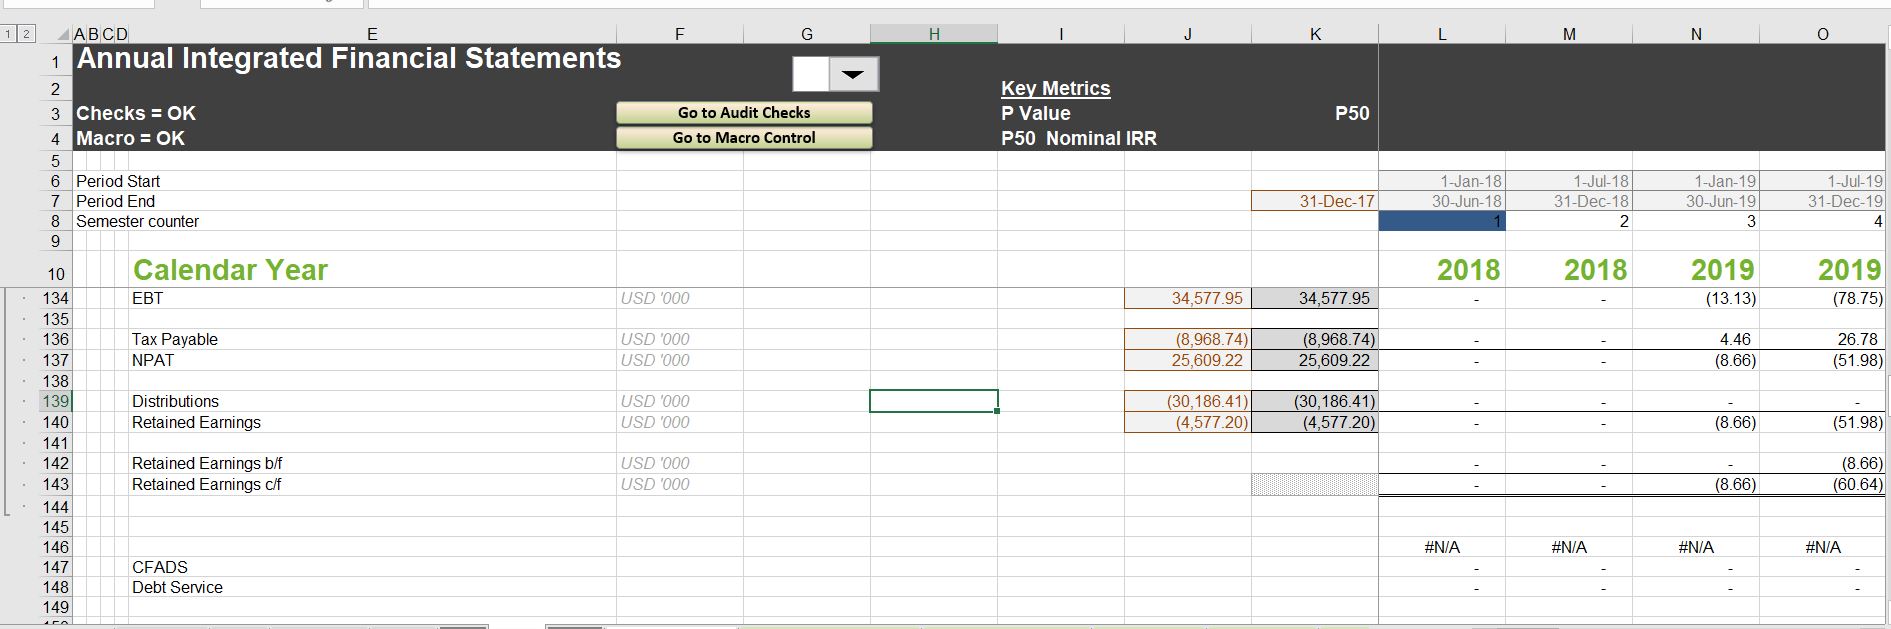
CFADS 0 0 0 100 120 130 90 80
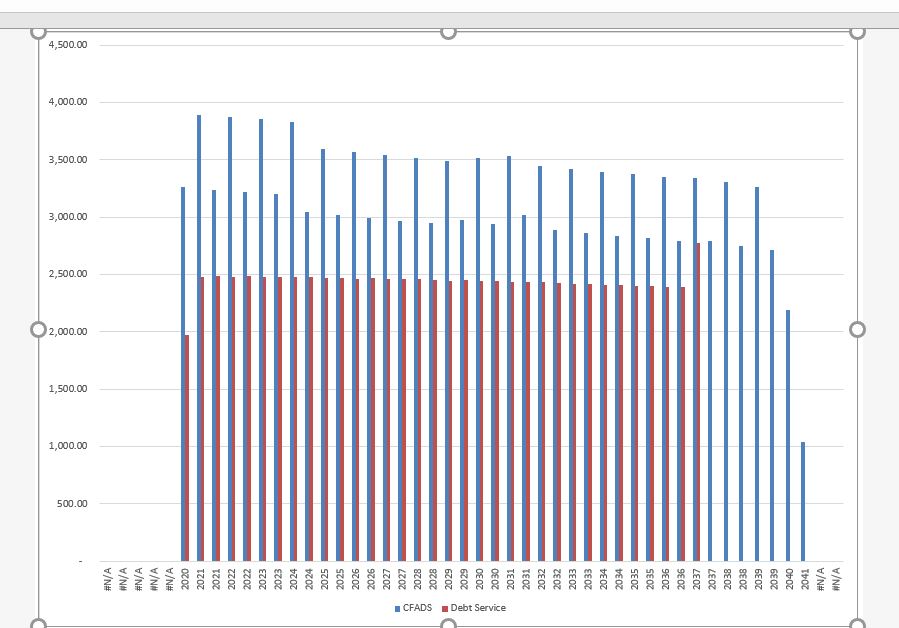
You can make a graph from this if you use an IF(CFADS,DATE,NA()) which would give you the DATE when the CFADS is positive and would give you the #NA when the CFADS is zero. An example of this kind of formula is shown in the excerpt below that is demonstrated on row 145. The CFADS and Debt Service graph that results is also shown from the ALT, F1. You can also see that sculpting has not been used and there is a funny repayment at the end. Further, you can see there is a grace period at the beginning.
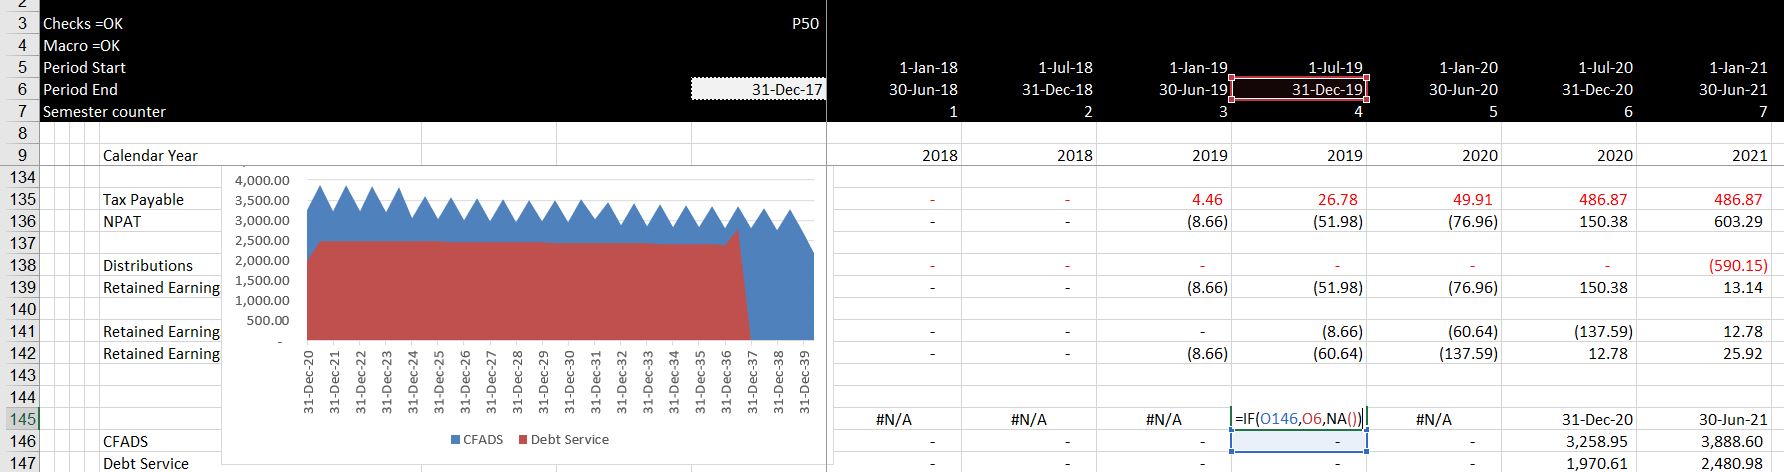
The screenshot below illustrates what may happen after you select the area and make a graph. It is a big deal to format the x-axis row with SHIFT, CNTL 3 (CNTL, #). Then you do not even have to change the x-axis to a date axis. Once you have a graph like the one shown below, you can change the chart type to an area graph. If there are still NA’s, then you should right click on the x-axis and change the chart type to a date axis.
Reviewing Long Formulas
Long formulas in models are horrible. They are worse if multiple cells refer to other sheets. I have said many times that I have two rules as to what should happen:
- You should be able to press the F2 key and see how formulas are calculated
- You should be able to use CNTL [ and F5 to find the source of what drives any equation
- Of course the equations should be simple and separated
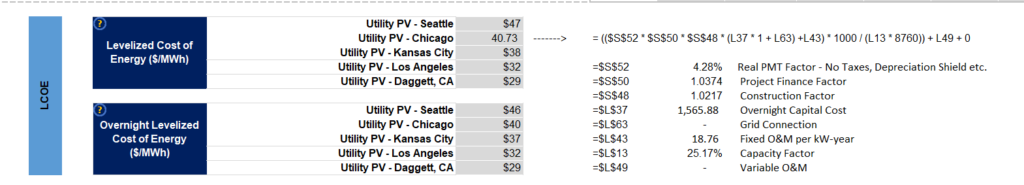
If the model that you are reviewing has a long formula, one thing you can do is use the FORMULATEXT function. Then you can separate long formula and describe what is going on. This is illustrates in the screenshot below
The review of a model depends on your objectives. Objectives could be credit analysis and understanding of risks; negotiation of debt terms; financial advisory on structuring; understanding of the details of a transaction (such as an EBL structure, where where the capitalised interest ends up, what is deducted in computing taxes, how CFADS is computed), evaluation of the PPA or other contracts or re-structuring of a model to make it flexible.
To do this sort of documentation, you can use the following steps:
- First, use the FORMULATEXT for the long formula
- Next, put the different formula factors in separate places to find the values. In the example above, the 4.28% that comes from =s52.
- You can then put use the FORMULATEXT again to demonstrate (to yourself) that you have taken the correct value
- You can then use CNTL [ and F5 to find the name of the variable
- Note that if you have a keyboard in some languages, finding CNTL [ may be difficult. You can use the generic macros with ALT, u to use instead of the CNLT [.
Compute the Pre-tax Project IRR
Once you have the CFADS and cash flow line, I suggest that you compute the pre-tax project IRR to see what is going on. I hope the model has EBITDA, but not all do. You should remember the definition of free cash flow, namely EBITDA minus CAPEXP, minus Working Capital Changes and minus taxes. You should be able to find all of these in the financial statements of a model These should not distorted by all of the massive detail about multiple debt issues, ECA financing, sculpting, local taxes, FX gains and so forth. If this IRR is very high or very low, you should ask questions and follow the Goldilocks principle. I have illustrated calculation of the project pre-tax IRR in the screenshot below. You should also compare the project IRR to the pre-tax debt IRR which is discussed in the paragraph below. Note that if there is no negative cash flow in the first year, you can use a very small negative number. Note also that I did not include any development fees that do not require cash outflow.
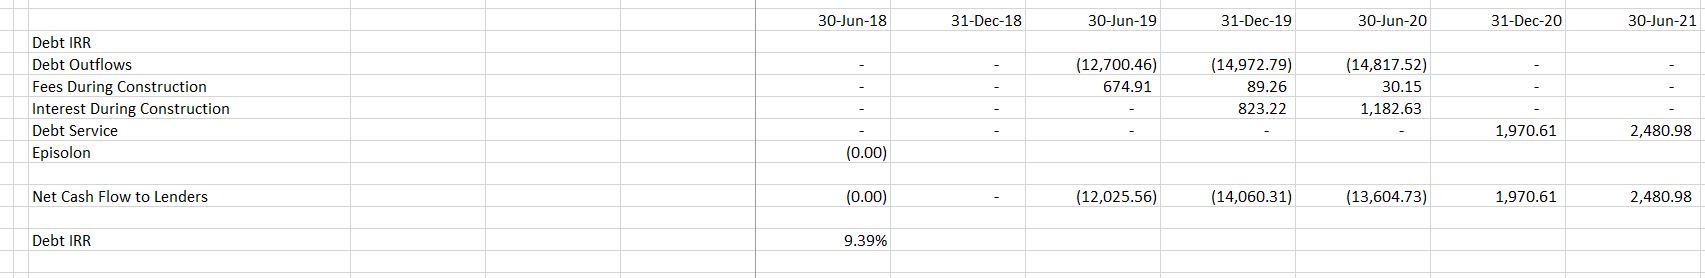
Compute the Pre-tax Debt IRR
There can be a whole bunch of complex debt items and debt cash flow. I suggest you put this all together by computing the debt IRR. To do this you can pretend you are in the position of a lender. Then, the cash flow you lend is a negative cash flow and the debt service you receive is a positive cash flow. But there are also many other fees and things like interest during construction. The fees and paid interest during construction are inflows to the investor. The screenshot below shows how you can put all of this together and evaluate the IRR. One reason it is good to compute the pre-tax project IRR is that you can evaluate this against the pre-tax debt IRR. The screenshot below illustrates the debt IRR components.
Examining Details of a Model
Reading the LOOKUP Function and Finding Data with CNTL, [ and F5
In a well designed, structured and artistic model you be able to find stuff easily and you should hardly need to use the blue arrows with the precedents and dependents. Use the sum column, the CNTL [ and F5 and lookup interpretation to find data. I used to think the sum column was a waste of time and I don’t think you need hundreds of verification checks. But to be able to check the funding of debt and make things easier to manage can be very useful. When you are re-structuring a model, you can start with the Revenues, Expenses and EBITDA and make sure you are consistent. For this, the sum column is extremely useful.
Finding data with lookup
Examples of Absurd Formulas
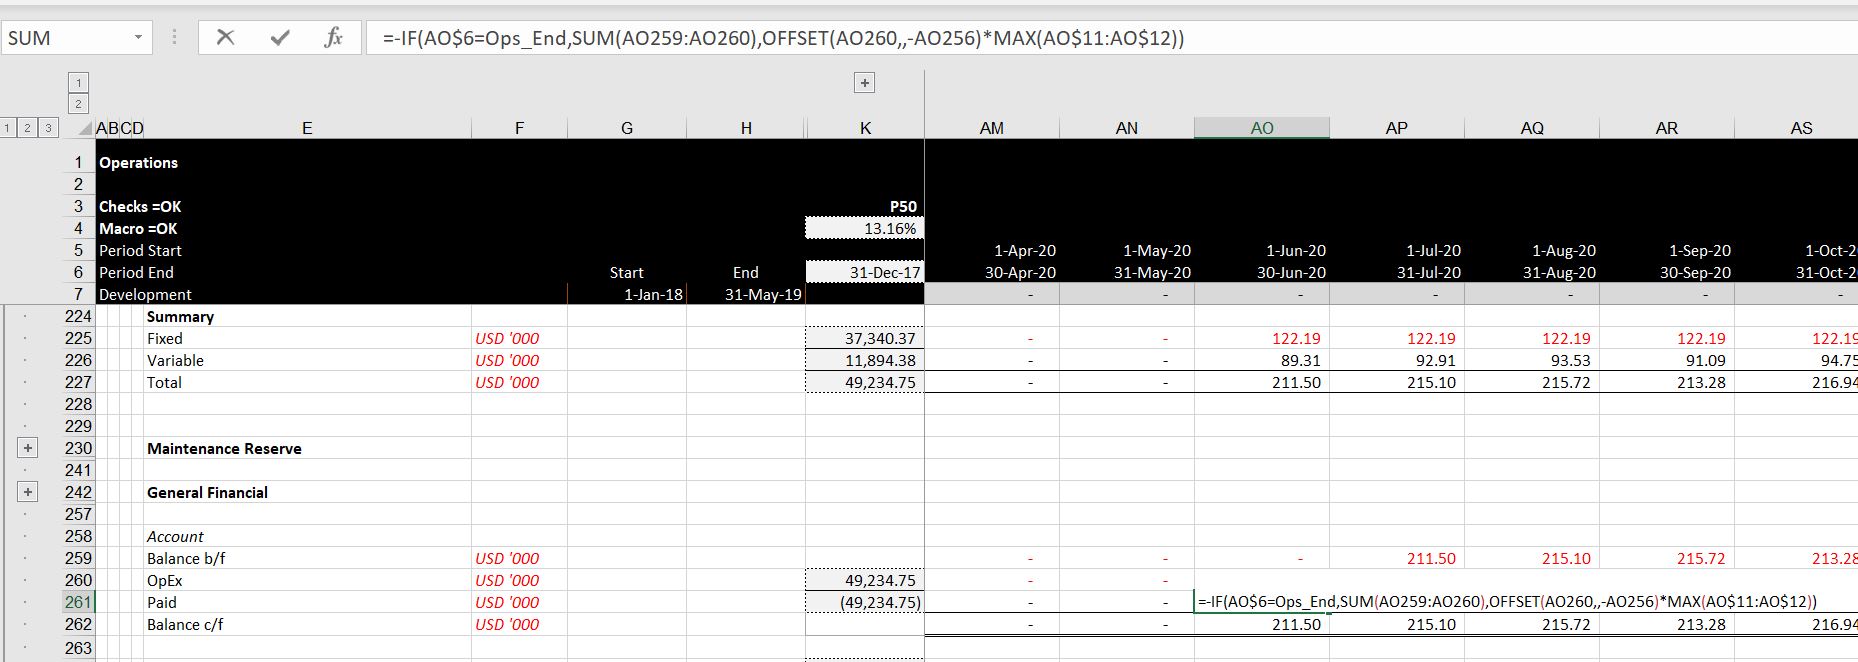
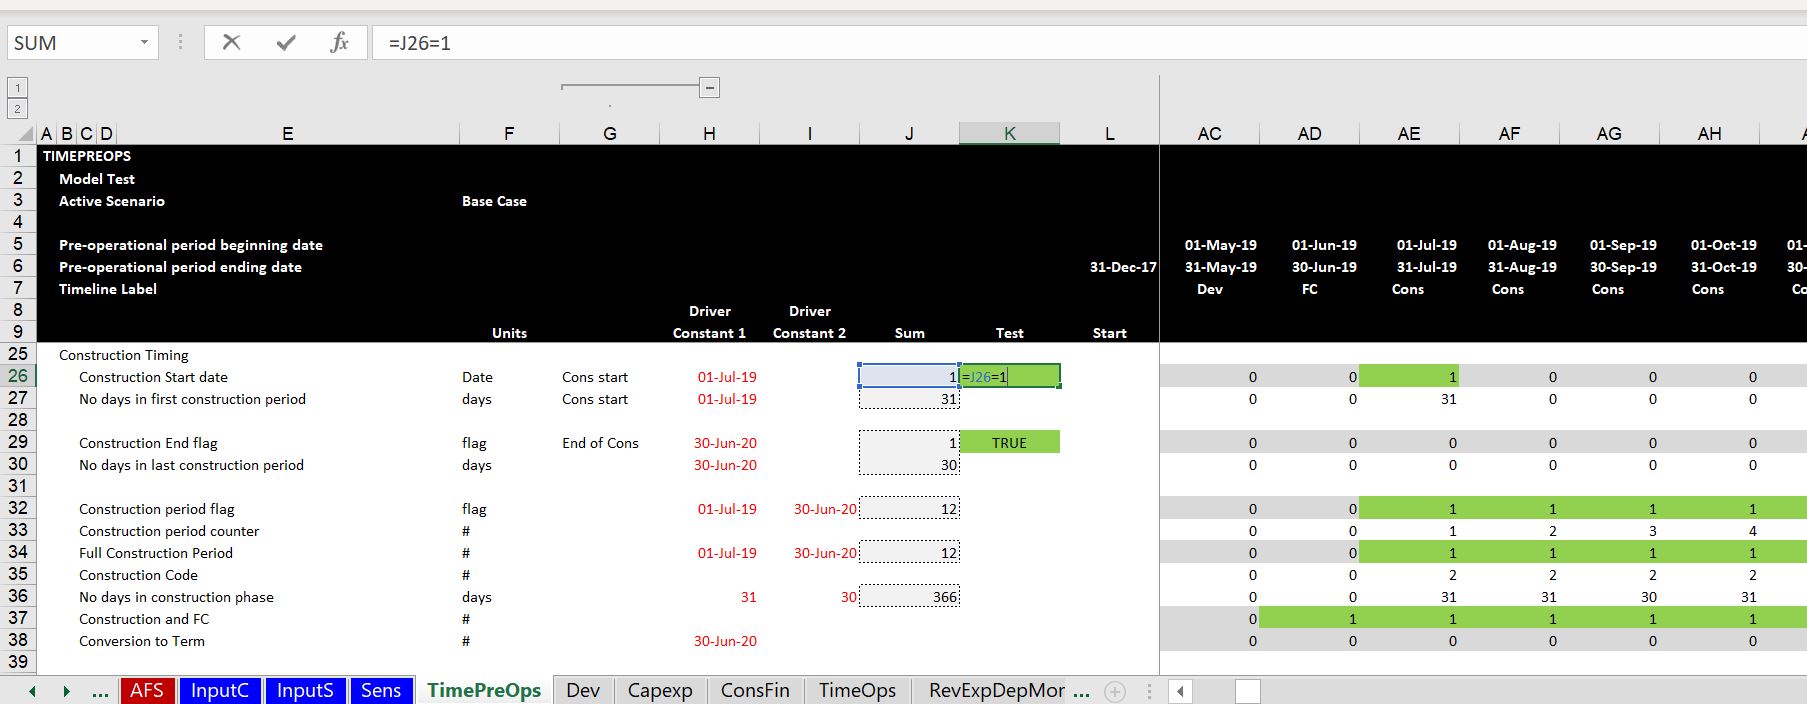
Working Capital — Should be Simple
Crazy test = should be simple formula
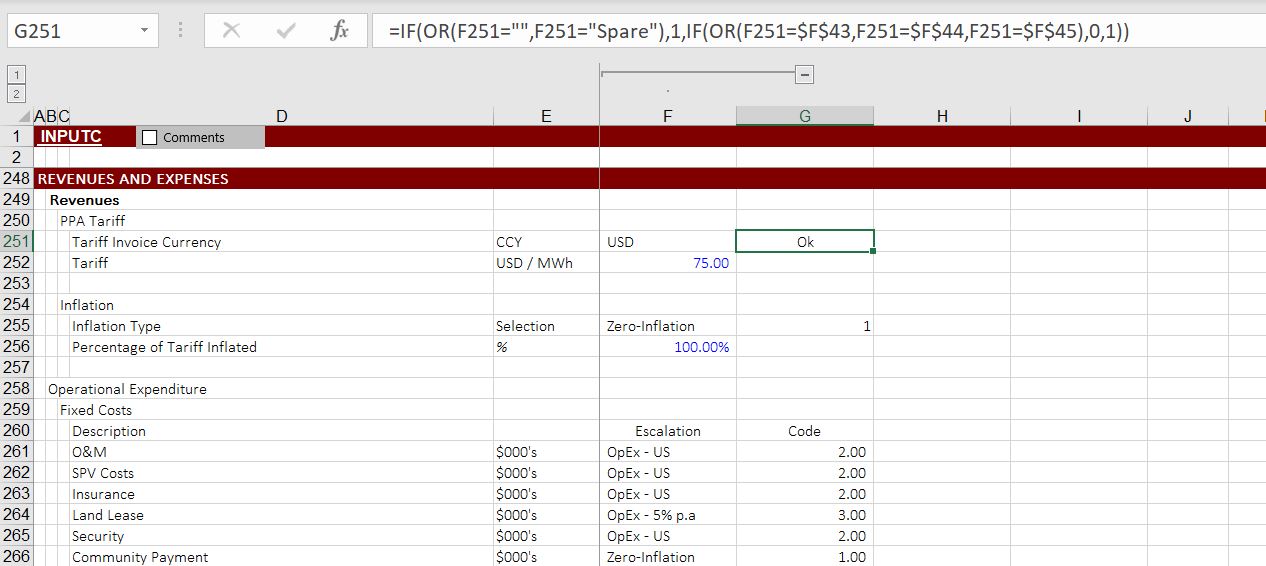
Example of test
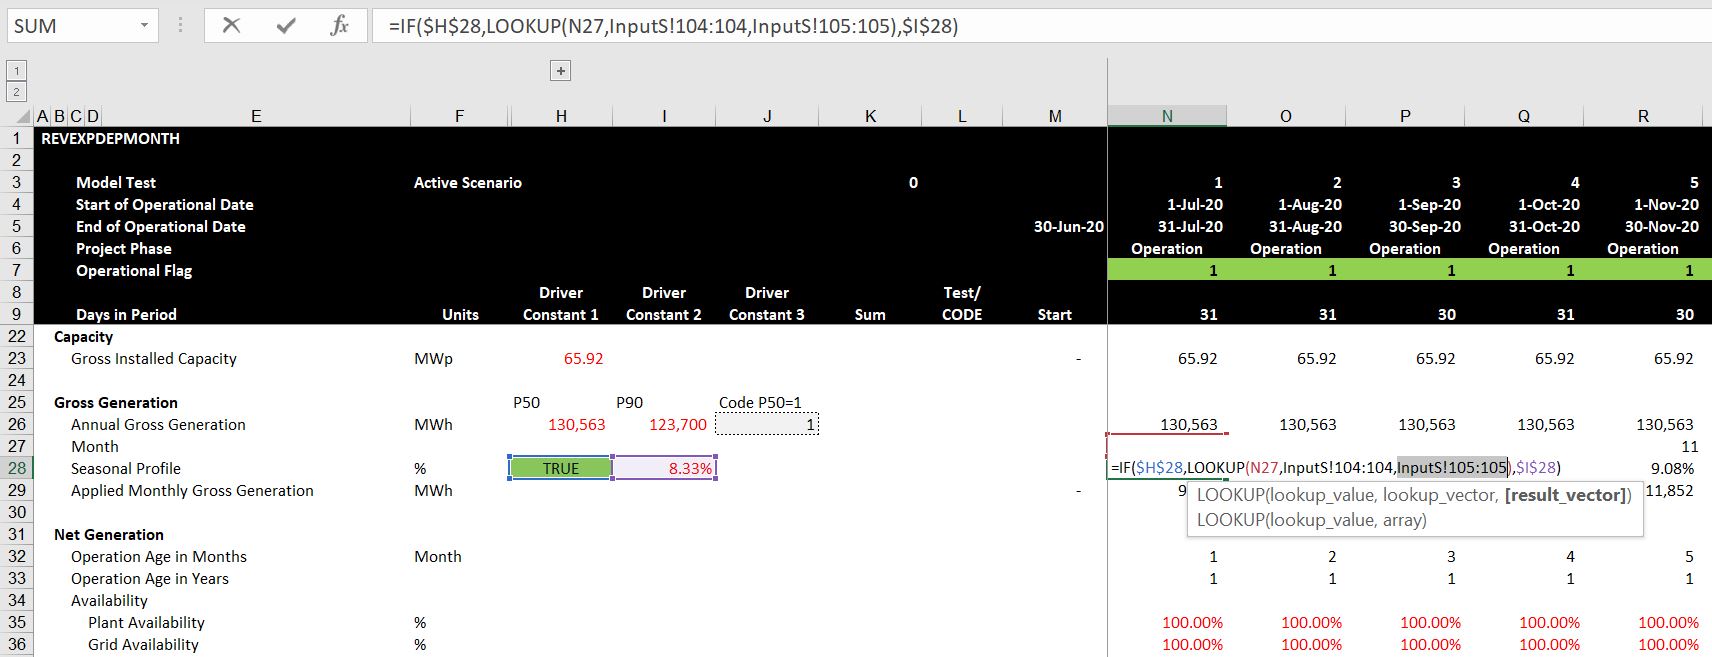
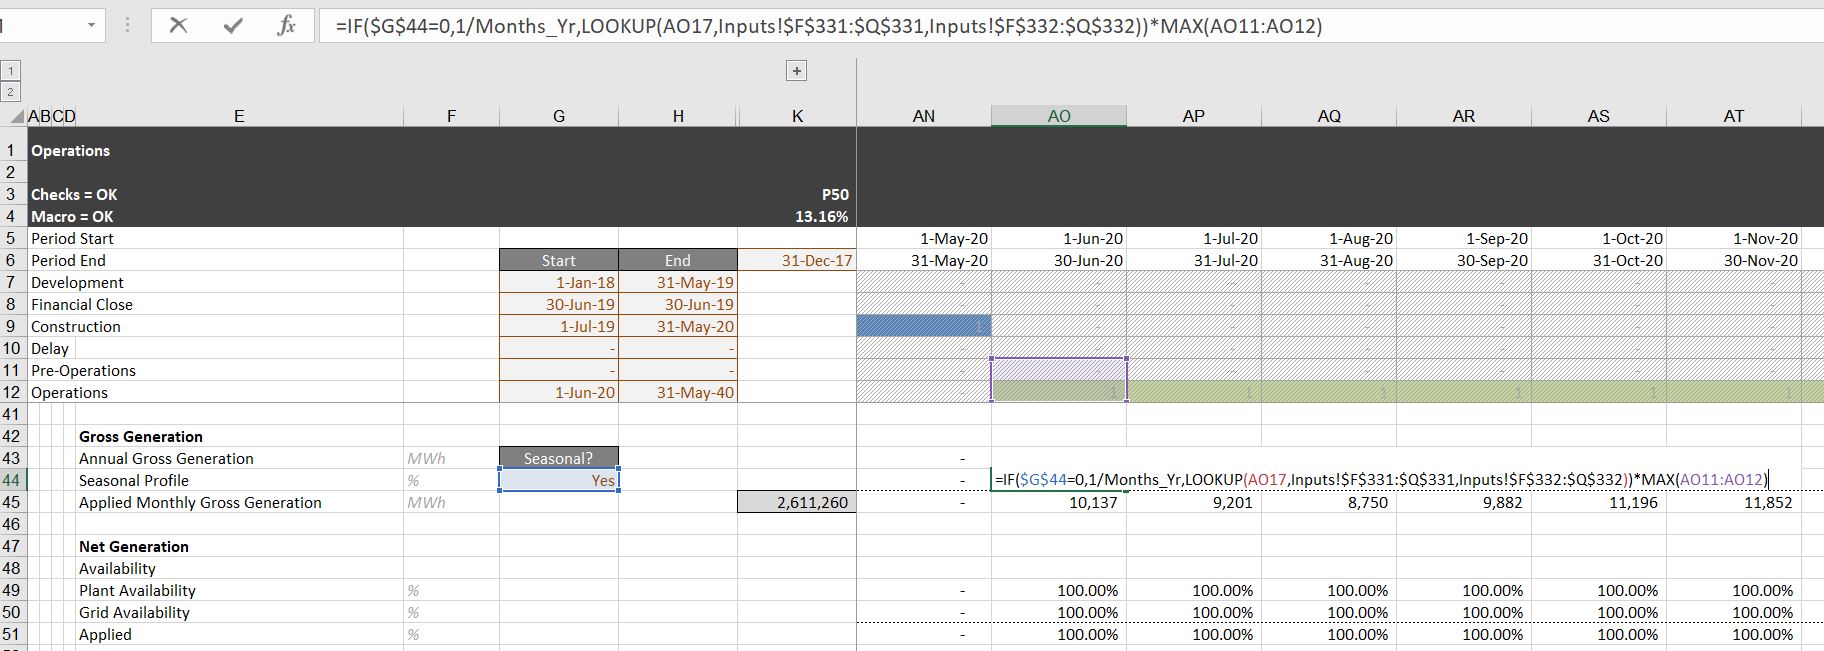
Horrible Seasonal Formula
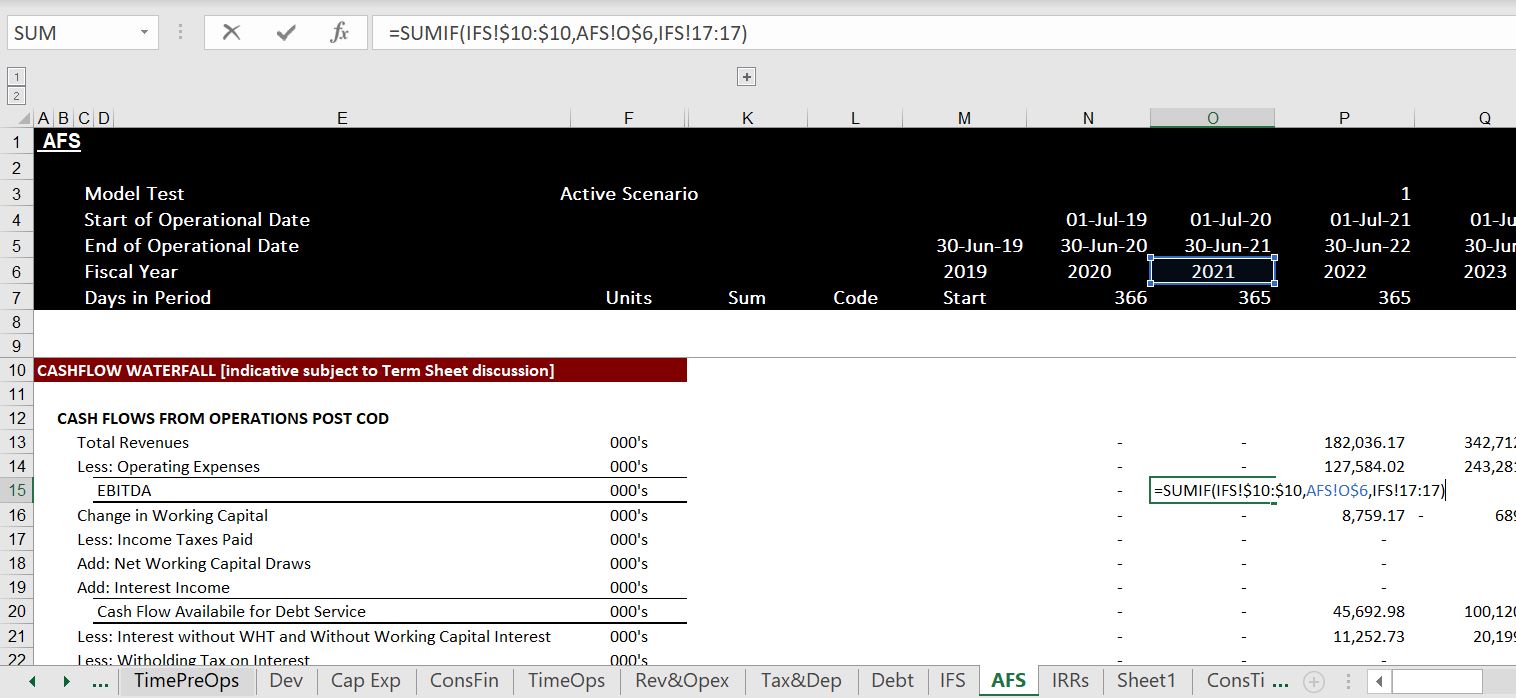
Don’t mess up the EBITDA with stuff
Fixing Irritating Model Format with Generic Macros
When opening a model and looking for cash flow and debt service, I found the following. As I have said many times, I am not a model artist and I did not take classes in model artistry, but this really sucks and it makes a model difficult to touch. So I suggest that you use the generic macros file to try and change things. You can find more instructions in the generic macros menu section by following the link attached to this sentence.
Wasting time in formatting. Just use TRUE and FALSE
Overview of Model Verification
Alternative Strategies to Model Review
- Five Different Strategies
- Accept Models and Prepare Sensitivities
- Work through large models and understand sensitivities, cash flows and financial ratios from detailed model
- Create Simple Models with Key Assumptions that produce similar results as large models
- Split-up Cash Flows in Separate Page with Key Graphs and Summary
- Implement Parallel Model Concept
- Using models as case studies to understand project finance
Strategy 1: Accepting Models and Playing with Scenarios
- Auditing of Models and Structural Accuracy of Models
- Advantages and Disadvantages
- Play with Scenarios in Actual Models
- Creating your own sensitivity analysis
- Creating your own scenarios with scenario reporter
- Evaluating Models for Benchmarking
- Compute the drivers
- Where to find benchmarks
- Understanding why costs are higher
- Benchmarking O&M Costs
- Benchmarking Capacity Factors
Strategy 2: Working Through Details of Actual Model
- Advantages and Disadvantages
- First Understand Structure of Model (Should be Similar to Our Structure)
- Look for Key Equations for EBITDA, Taxes, Capital Expenditures and Debt
- Understand how GCF Facility is Included and Work Through Equations in Detail
- Case Exercise with Actual Model
Strategy 3: Create Simpler Model
- Advantages and Disadvantages
- Structure of Simple Model with Fixed Debt, Annual Flows and Tricks to Avoid Circular References
- Comparing Key Figures with Large Cumbersome Model to Your Model Like EBITDA, CFADS and Dividends
- Adding Different GCF Structures to Simpler Model
- Example of Simplifying Case Exercise with Actual Model
- Evaluating cost of debt
- Database on credit spreads
- Theory of credit spreads and probability of default
- Implied probability of default in long-term debt
Strategy 4: Dissect Cash Flows in Separate Page
- Advantages and Disadvantages
- Putting Pre-tax Cash Flow, Taxes, After-tax Cash Flow, Debt Cash Flow including GFC, Equity Bridge Cash Flow, Tax Shield Cash Flow in a Separate Sheet
- Reconciling Cash Flows in Model
- Computing IRR’s on Separate Cash Flow
- Presenting Cash Flows with CFADS and Debt Service Graph as well as Cash Flow Waterfall
- Example of Cash Flow Dissection Method with Actual Model
- Evaluating equity IRR and political risk
- Realistic sources of political risk
- Probability of nationalisation
- Loss if nationalise
- Mitigation of political risk
Strategy 5: Implement Parallel Model
- Advantages and Disadvantages
- Notion of Parallel Model with VBA Code and UDF
- Using Parallel Model in Simple Case
- Incorporation of CGF Facilities in Parallel Model
- Fixing Circular References with Parallel Model Concept
- Example of Parallel Method with Actual Model
Example of Model for Model Review and Interpretation with Evaluation for Credit Analysis