You can download selected on-shore and off-shore wind project finance models on the page below. As with featured project finance models on other pages (e.g. solar models), the wind project finance models include resolution of circular references with user defined functions. Unique aspects of the wind models shown on this page include detailed operation and maintenance analysis; use of P90, P99 etc. to size debt; incorporation of power curves in financial models; and other features related to the cost of wind farms.
The first featured wind project finance model discussed below is an on-shore wind example that includes detailed structuring options with subordinated debt, sculpting and other features. The model includes different wind production scenarios and detailed operating expense calculations (I began by evaluating other models and it has some redundancy and bad equations). The second wind model allows you to evaluated different turbines with alternative power curves. It includes a merchant tail and illustrates how to incorporate different timing and sensitivity assumptions in your project finance analysis. The third wind model for an off-shore park illustrates how to incorporate valuation in project finance models where the risk of a project changes over time.
Wind Model with Detailed Costs and Bidding
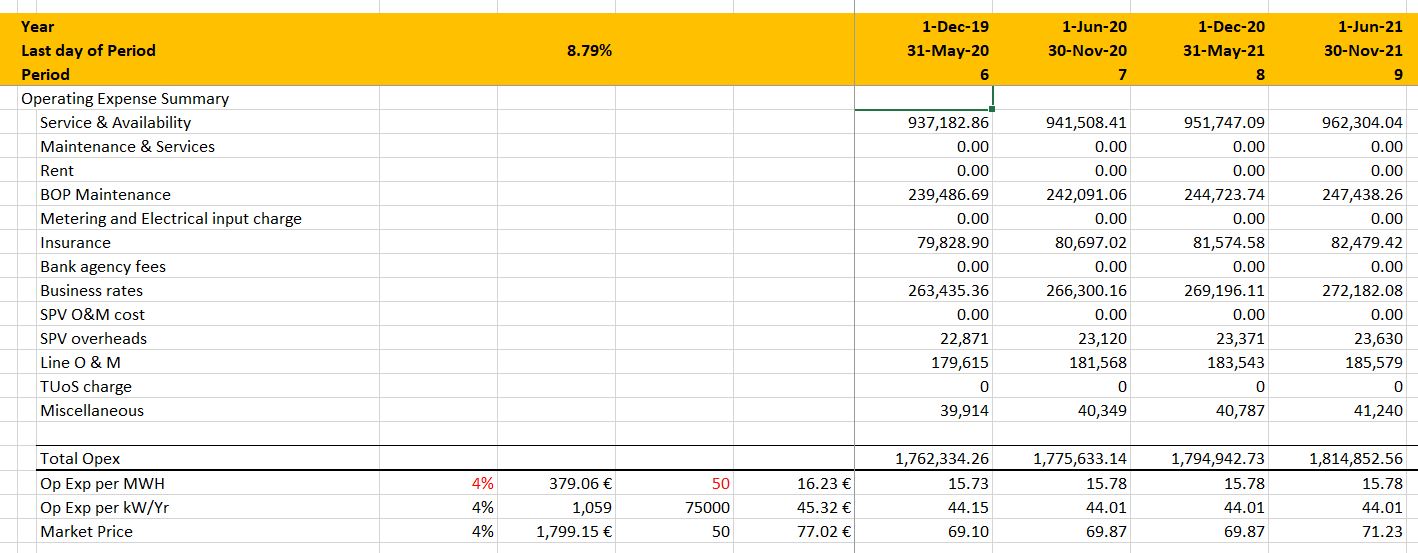
The first model that you can download has some costs that are out of date (they are high). But you can use the model to evaluate the type of operating expenses and capital expenditures that are incurred and also issues associated with transmission constraints. For this example, the P99 case is 28% below the P50 case. An excerpt from the EBITDA page that presents the operating expense categories and adds up the operating expenses is shown below.
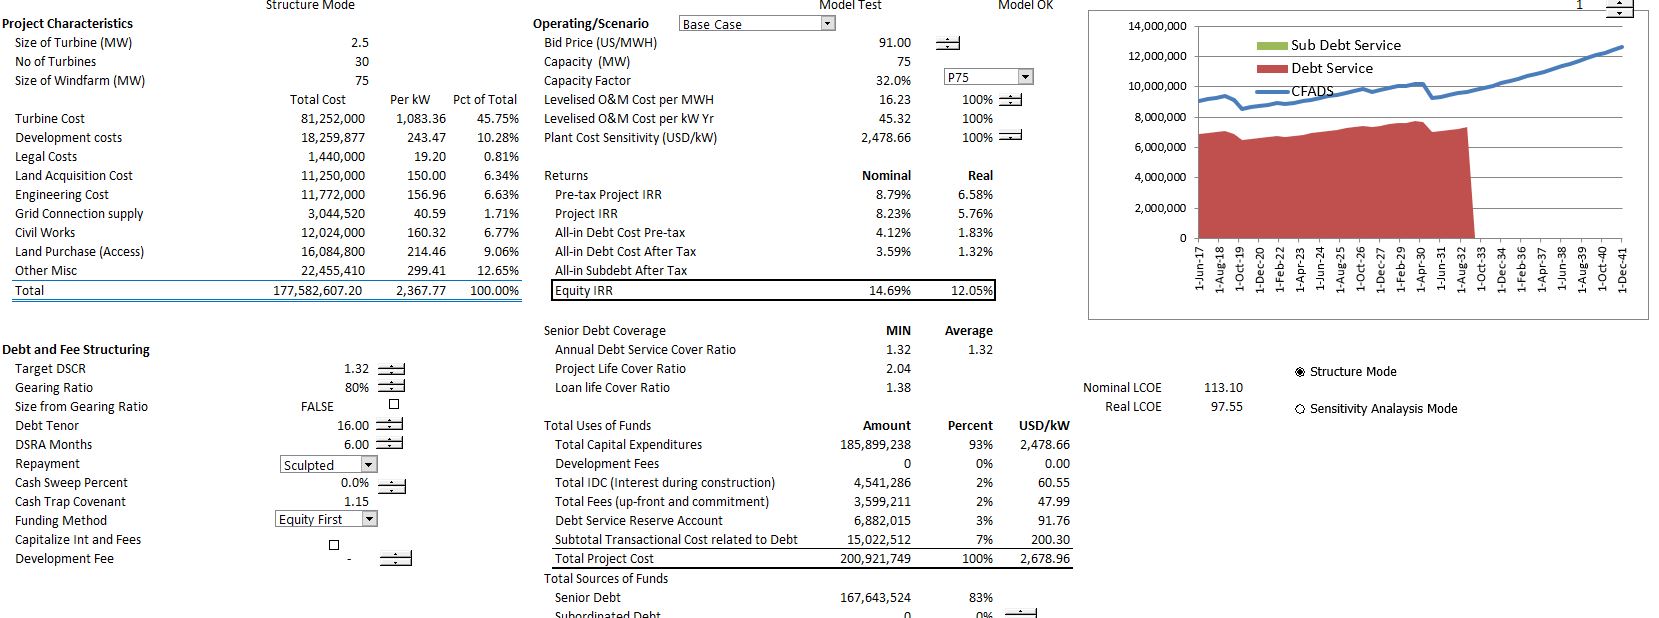
As with other models, these files include resolution of circular references related to financing and sculpting. I suppose you could put in your own capital expenditure and operating cost variables and then evaluate the effect of changing the DSCR, the maximum debt to capital ratio, the tenure, the DSRA months and so forth. You could then use goal seek to find tariff bids the result in an adequate return on equity (only because the UDF approach is used). An excerpt from the summary page that is similar to other models is presented. I hope you would keep the summary page focused; present the cash and debt service graph; show some key operating data as well as the project, equity and debt IRR’s.
You can download this on-shore wind model with detailed cost break-downs using the button below. You can also watch a video describing the model.
On-Shore Wind Project Finance Model with Detailed Assumptions and Curtailment
[wonderplugin_video iframe=”https://www.youtube.com/watch?v=c9HVevcKNQg” videowidth=600 videoheight=400 keepaspectratio=1 videocss=”position:relative;display:block;background-color:#000;overflow:hidden;max-width:100%;margin:0 auto;” playbutton=”http://edbodmer.com/wp-content/plugins/wonderplugin-video-embed/engine/playvideo-64-64-0.png”]
Wind Model with Merchant Tail
As time goes by and wind projects become more economic because of more efficient turbines with power curves that can secure wind at lower speeds, the question of building projects against merchant power prices is becoming more and more of an issue. The model that is available for download below illustrates how to incorporate merchant prices after a PPA period. In the case that is illustrated in the excerpt, I used merchant prices provided by a developer that had a typical optimistic forecast. The simple question that I think you should ask in a case like this is can a new plant be built profitably against the merchant prices. If this is the case the merchant prices are not internally consistent. There is a whole lot more information about merchant price analysis in the merchant electricity price section of the website.
Off-Shore Wind Project Finance Model
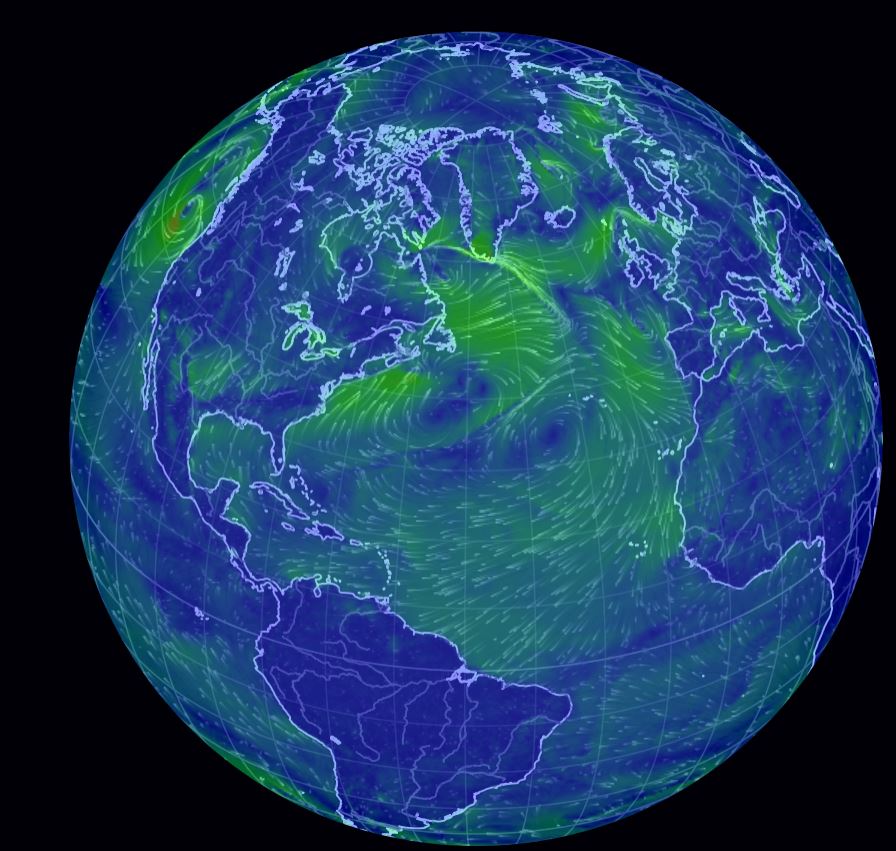
In my opinion (which is really not worth anything at all), the long-term future of electricity will be between off-shore wind and nuclear energy. A dramatic decline in the prices bid for off-shore wind has occurred which is similar to the revolution in solar power. However unlike solar power, there is a lot more off-shore wind resource available than either on-shore wind or land for solar energy. You can see this by googling the world wind map and seeing all how much more wind there is off-shore than on-shore as illustrated in the excerpt below.
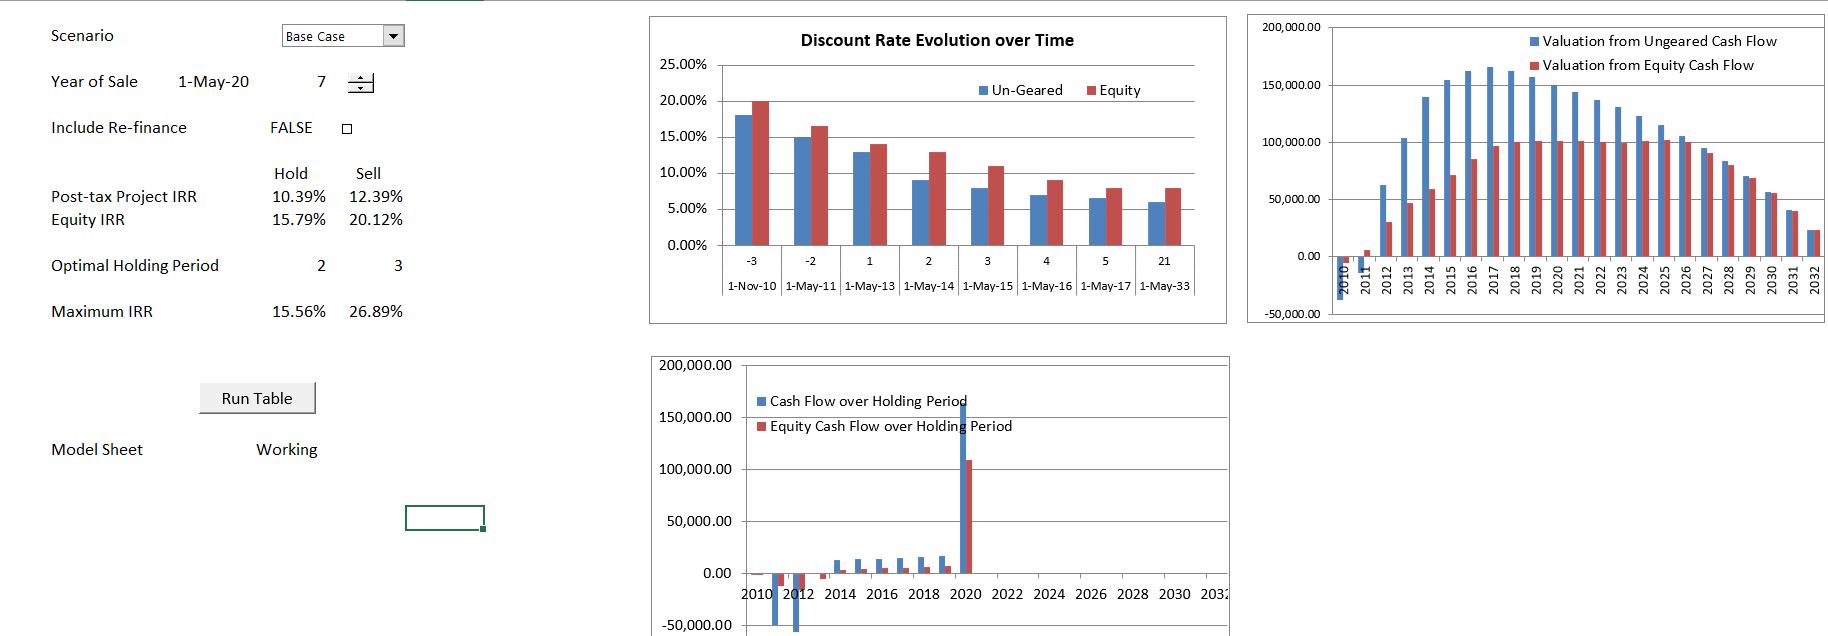
The file you can download below is intended to show some issues that can arise in project financing of off-shore wind. The model includes resolution of circular references, re-financing and the return that can be generated by selling a plant after the risk of the plant declines. The re-financing assumptions allow alternative timing, DSCR and credit spread assumptions. As with other models, the analysis includes a page that demonstrates what can happen when the plant is sold at different time periods. By assuming that the risk and therefore the target IRR declines, the price increases. When the IRR target declines the value increases as illustrated on the page below.
You can download the off-shore wind example using the button below. As with the on-shore wind examples, the analysis does not include large cost reductions and capacity factor increases that have been realized in the past couple of years.
The video below describes some of the aspects of the off-shore wind model.
[wonderplugin_video iframe=”https://www.youtube.com/watch?v=eQzUJL11Eyo” videowidth=600 videoheight=400 keepaspectratio=1 videocss=”position:relative;display:block;background-color:#000;overflow:hidden;max-width:100%;margin:0 auto;” playbutton=”http://edbodmer.com/wp-content/plugins/wonderplugin-video-embed/engine/playvideo-64-64-0.png”]
Other Wind Models and Analysis on the Website
There are many more examples of wind project finance models than the few selected above. As with the models above, I have included a little description for these models. Here, I give a link to the models that are in the wind resource section of the energy analysis part of the website. A couple of the models demonstrate how to simulate cases where the debt size is driven by a particular level of wind output assumption (P99 one-year, p50 etc.) and the associated DSCR is associated with the wind scenario (e.g. P50 is 1.35 and P99 one-year has a DSCR of 1.0). In the models, the debt size can be driven by one criteria, but the IRR is derived from a different wind probability assumption.
Another set of wind project finance models are explained in the wind resource section include databases of power curves. Using the database you can be used to demonstrate the dramatic difference in capacity capacity factor that is caused by seemingly small differences in the shape of a power curve. In this model you can use the spinner box and examine the difference in capacity factors that can be obtained at particular wind speeds. For example, you can look at wind speeds or 6 meters per second or 8 meters per second you can look at the increase or decrease in capacity factor that can be obtained.
A third set of project finance models that include wind are the models that address financing with tax equity in the U.S. The tax equity transactions can have horribly complex rules (that are not really necessary but allow people to sound smart). These rules include DRO’s, rules for maximum capitalization, rules for distribution of tax benefits and operating cash flows. I have put some of the tax equity models that also deal with wind as featured models.