This page describes how to create analytical models with battery storage and evaluate the costs of storage compared to other alternatives. In making battery analysis there is almost no way to avoid some kine of hour-by-hour analysis where batteries move around demand to meet the constraints of supply. Batteries costs and other parameters are a function of the amount of hours of storage — the costs are generally expressed in kWh. In measuring costs and benefits, you need the amount of hours of storage relative to the capacity or load. Another model addresses how to create a simple model of including batteries with solar in for a residential rooftop. Subjects covered include how to set-up a simulation of how much storage is in the battery on an hourly basis and how the battery will be charged and discharged. Storage in a battery is measured with an opening balance, plus charged energy, less losses and less discharged energy. The mechanics of charging and discharging can depend on the context of the battery that you are using. For some applications where economics are in part driven by retail or wholesale rates, the definition of on-peak and off-peak periods may be necessary. Other subjects include measuring the battery cost with degradation and where the operating life of the battery is different from the overall life of the project as well as the ancillary services provided by the battery. In these cases you must make assumptions about the replacement cost of the battery.
In other pages of this section on batteries and storage I have provided analysis of batteries using carrying charge rates and providing a completed model. On this page I walk through a step by step process to create a model with storage from scratch including a presentation of the charge and discharge and how to incorporate learning costs in the cost of batteries. The analysis also includes modelling of the replacement of batteries where you can input different learning curves in terms of battery cost changes.
.
.
Project Finance Model with Battery, Solar and Wind Along with Tax Equity Financing and Bridge Loan
.
.
Overview of Creating Battery and Renewable Model
The model I am using is a simplistic evaluation of whether battery storage is beneficial in the provision of a data center that uses a whole lot of energy and would like to use as much renewable energy as possible as long as it is economic. In creating this analysis I have put the little spinner buttons in so you can see how the battery would affect the cost of electricity to the data center with different assumptions. I have also created the model so you can see what battery cost is required to make the storage economic relative to buying and selling power in merchant markets.
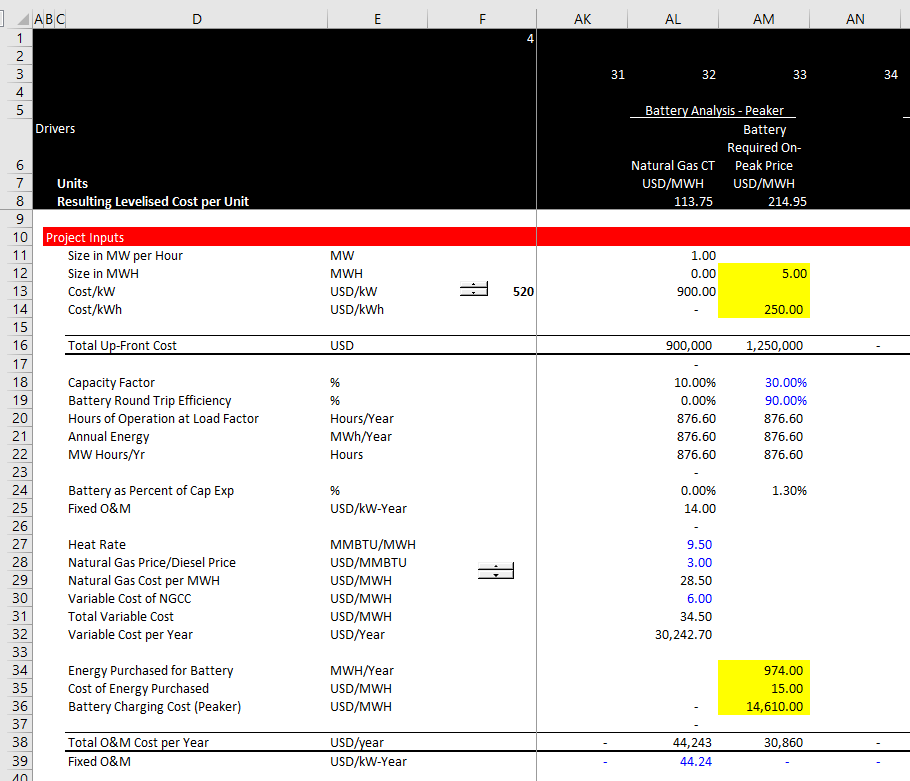
Some of the assumptions for the analysis are illustrated in the screenshots below. The first screenshot illustrates how to set-up the operating section of the model where renewable production is assumed as well as the round trip efficiency of the battery. Note that the amount of capacity can be adjusted for the wind, solar and battery capacity. The capacity factors come from the hour by hour renewable production estimates. In this case I have three years of historic production data and you can change the base year of the data to see how the production changes.
.

.
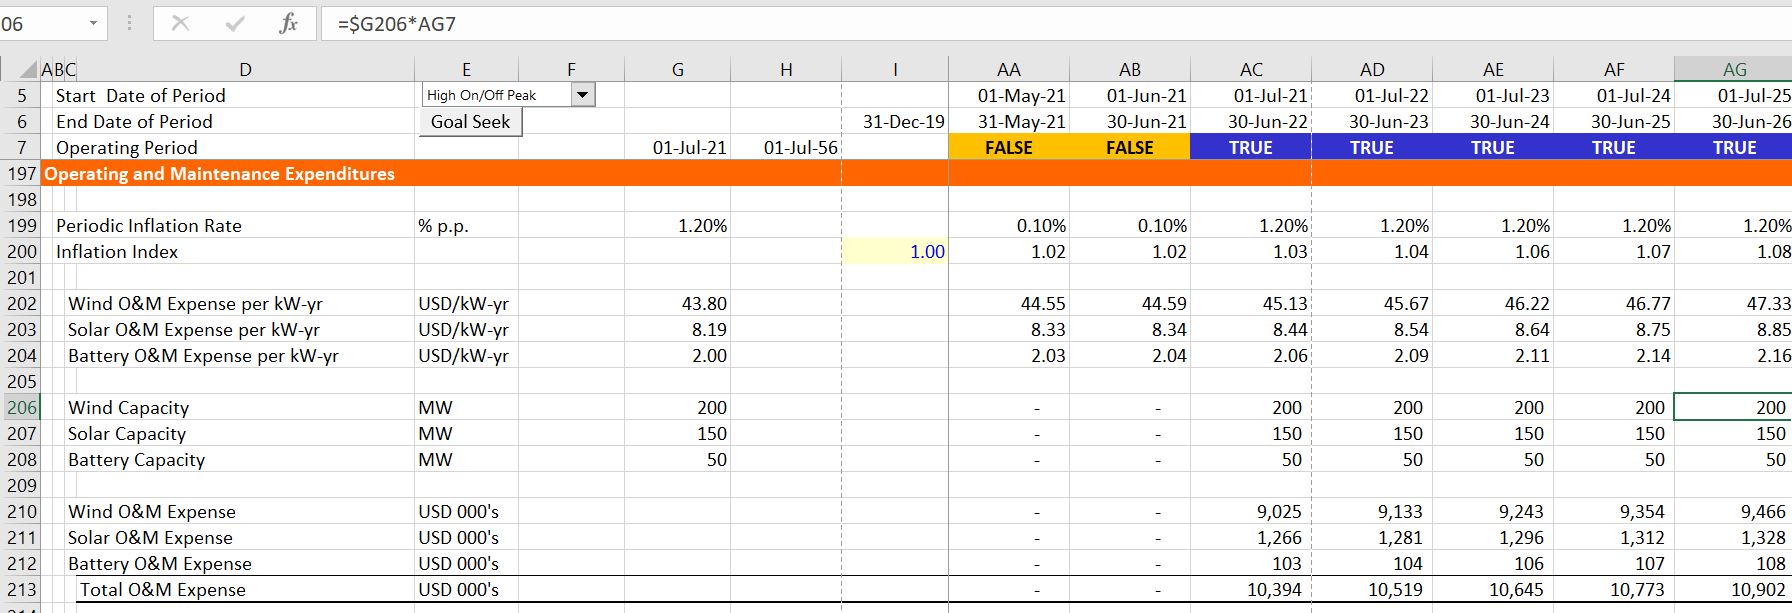
The next screenshot illustrates assumptions with respect to the capital expenditure cost of different equipment including the batteries. The replacement cost of the batteries is a key input as well as the useful life of the batteries. In the screenshot below I assume that there is steep learning curve and the that the battery cost is cut in half every 12 years. You should make the model flexible where you can change the operating life of different batteries — the initial battery relative to the replacement battery.
.
Step 1: Set-up of Operating Characteristics of the Battery and the Renewable Energy
.
In any model I keep emphasizing that you should begin with the operation of the machine. This is particularly important with battery analysis. For different battery applications there may be very different mechanics of how the battery charges and discharges. If the battery is used to reduce electricity bills in the context of a rate structure with on-peak energy charges and a demand charge, then the battery must not dis-charge too much as soon as the on-peak period begins. Additionally, the battery should not discharge during the off-peak period. For this there should be some kind of algorithm to look forward. If the battery is part of a micro-grid system without on-peak and off-peak rates, the battery should charge when there is more solar production than load and it should discharge when the load is greater than the solar production. In the example below, the battery is charged from surplus renewable production above the needs of the data center. The battery is discharged when the opposite occurs and the production is below the electricity a load of the data center.
To make a battery analysis, I suggest that you need some kind of hour by hour analysis. In the case used here, I am using historical hour-by-hour production from wind and solar. This can be expressed as a percent of the capacity of the wind and solar. Once the percentages are established, these can be multiplied by alternative amounts of capacity as shown in the screenshot below. With the loads of the data center facility (I have assumed flat which seems a little crazy — if the weather is hot one would think you need more electricity for air conditioning), you can begin making graphs of what is simulated in terms of production versus use. Note that when you make 8760 rows in a sheet some things become very slow even if the formulas in excel are set to manual. I suggest that you delete lines while you are making the model. Then of course you can re-copy them when you are finished.
.
Screenshot
Making Graphs of Renewable Production, Loads and Battery Operation
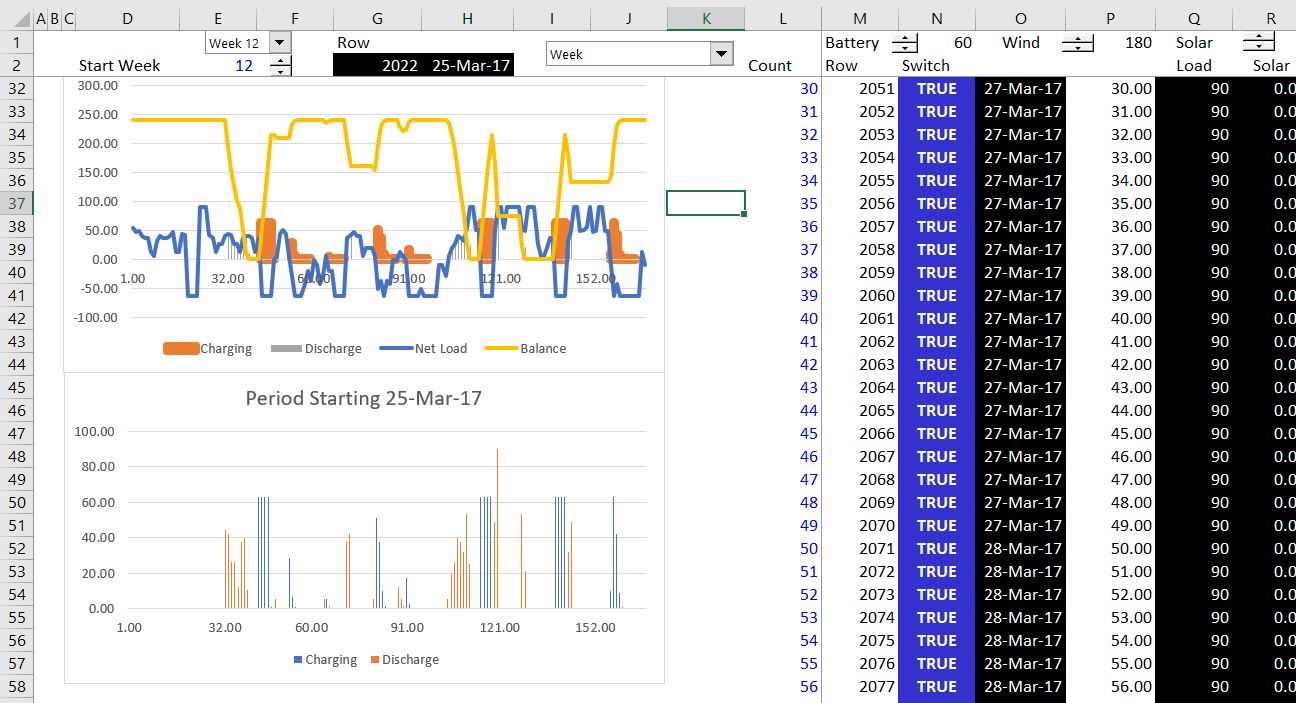
To make a graph of the electricity production versus load, you can make a flexible graph that shows different time periods along with the start and end period. I suggest a page with the hour by hour analysis and then another page that extracts data that you would like to see in the graph. To do this you can start with making spinner boxes drop-down boxes that allow you to select different dates of the graph. This is easy to do when you use the MATCH function in excel (shown in the daily graph below) and make sure to use the whole row or column rather than pressing a bunch of F4’s to lock the ranges. You can also make the graph flexible in terms of how long you want the graph to be shown on the x-axis. In the example in the file that is attached, I have allowed you to use either daily, weekly, monthly or even yearly graphs. This is accomplished with the NA method that is explained in the flexible graph section of this website.

I decided to show both the monthly and a daily graph so that you can see the #NA things that limit the x-scale on the graph. Note also how you can change the amount of solar and wind capacity and see how much surplus or deficit power is needed.

.
Setting-up On-Peak and Off-Peak Switches
.
As I mentioned above, electricity prices are often defined by on-peak and off-peak periods. These periods can indicate the approximate price that you can buy and sell power for in wholesale markets. In the case study here, the battery is only discharged during on-peak periods because the cost of power is low during off-peak periods. This means you can use a switch to make sure the discharge only occurs during on-peak periods when the cost of electricity is higher. When setting up the on-peak and off-peak periods you can set up a few different columns that depend on the week day and the hour of the day. Just use the WEEKDAY function and the AND function to set this stuff up. Results of setting-up the on-peak and the off-peak periods are illustrated below. I used the generic macro file to make the colours that show what is TRUE and FALSE and which data comes from other sheets.

Computing the Energy Storage Balances in the Battery – Making Flexible Charge and Discharge Equations Depending on the Application
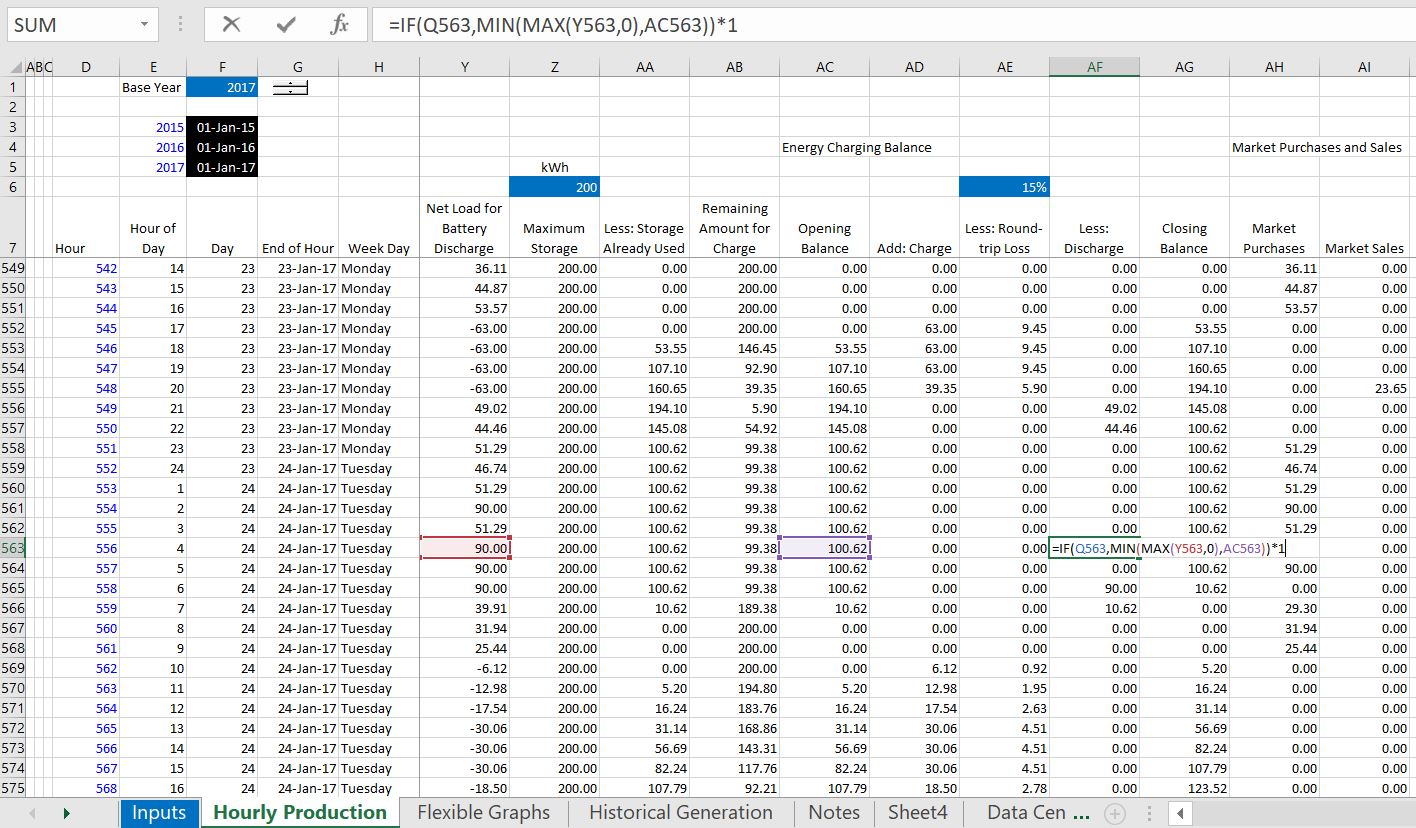
Once you have the production and load as well as the on-peak and off-peak switches, you can compute the amount of energy in the battery as well as the charge and discharge. In setting this up I suggest developing an opening balance and closing balance in a similar way as many other balance accounts are set-up in financial models. When doing this, I suggest first setting up an account to see how much power is available to be charged. You can put the maximum storage on a row or column and then see how much has already been charged (the opening balance). Some points that may be useful in modelling the balance of storage include:
- Begin with the load minus the renewable production. If this is negative there is too much renewable production and you may charge the battery. If this is positive, you may discharge the battery. To separate whether you charge or discharge, use the classic MAX(net load,0) or MAX(-net load,0).
- Set-up the remaining balance available to store. The charge cannot be more than this which you can model with the MIN function.
- When entering the charge calculations, add a line for the amount of losses from a single cycle charge. This may be something like 10% or 20% depending on the battery characteristics.
- When modelling the charge, use a classic MAX and MIN to assure that you can charge from the remaining to charge line and also that you have enough excess energy.
- When modelling the discharge, use test the amount of deficit energy and you can also use the on-peak to make sure that power is only discharged in an on-peak period. There can be a lot of alternative ways to compute the discharge depending on the economic circumstances.
The manner in which you can set-up this balance account with an opening balance and a closing balance is illustrated in the screenshot below. In this case it is assumed that the discharge does not occur in the off-peak periods because energy can be replaced at a low cost. In addition the amount of energy that is produced that cannot be used for charging is shown.
The screenshot below illustrates the results of assumptions regarding the charge and discharge of the batteries. I have made one chart that shows the balance of storage in the battery and another chart that only shows the charge and discharge. These charts are created using the same mechanics as the charts that show the load and renewable production. You can adjust the capacity of the battery as well as the renewable capacity and see what happens to the storage capacity.


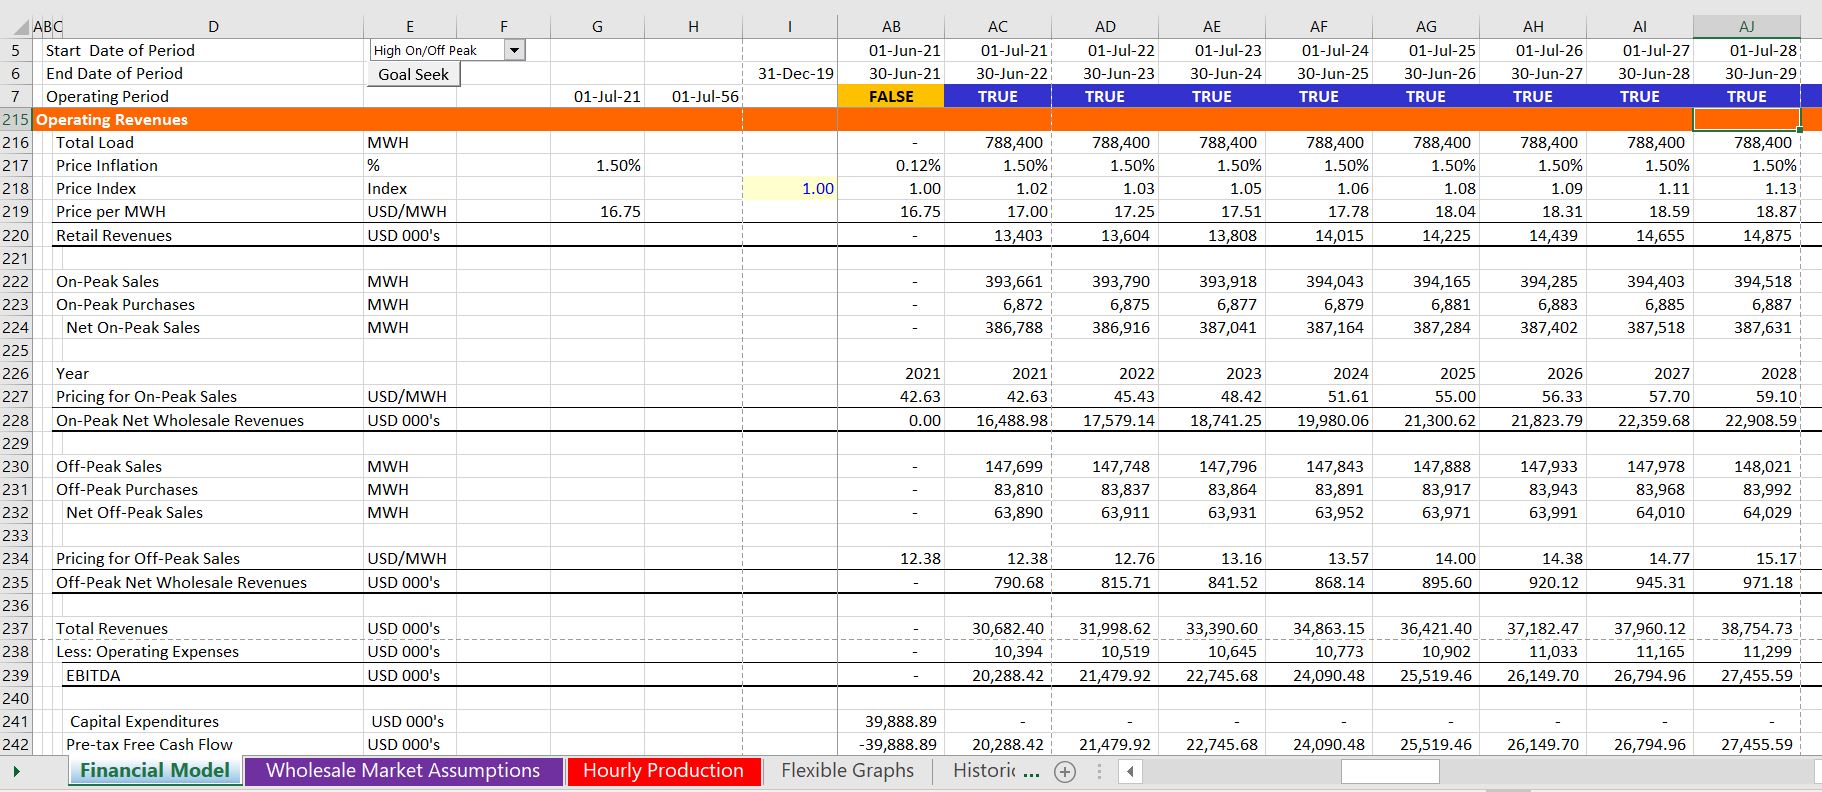
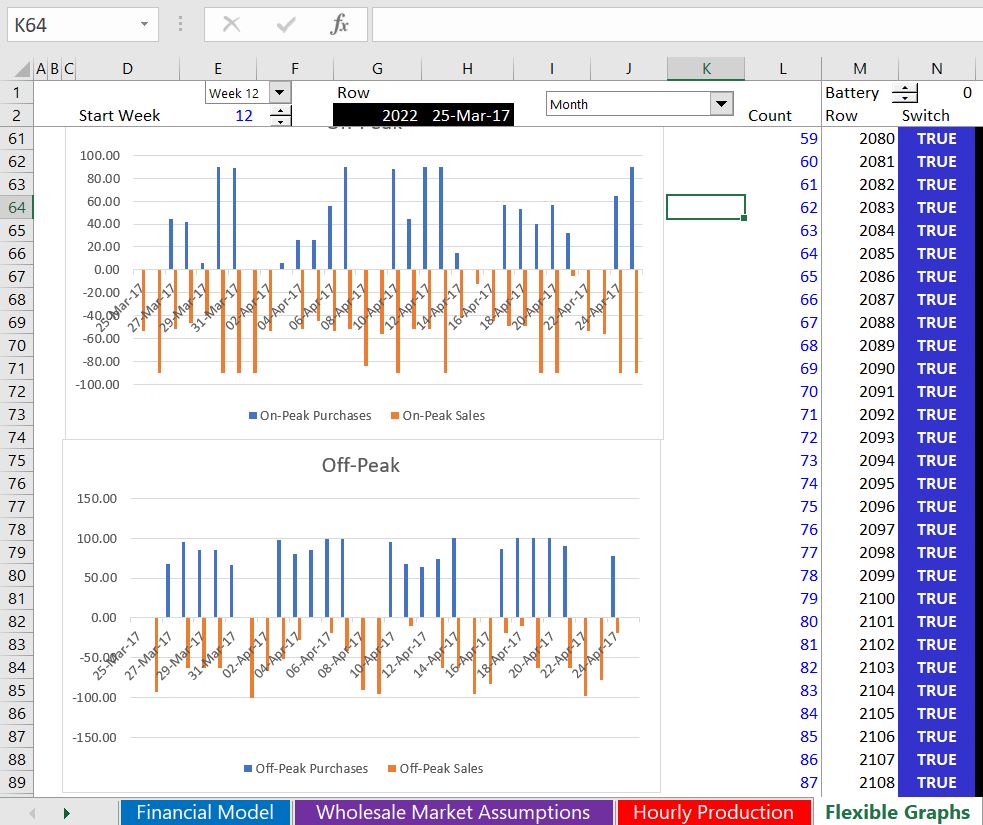
Effect of Battery on the On-Peak and Off-Peak Sales and Purchases
The economics of storage depend on the cost of charging a battery versus the value from discharging the battery. In this case the way the battery storage is set-up is to discharge only during on-peak periods. The savings ultimately come from the ability to reduce the on-peak purchases for the data center and replace the on-peak purchases with off-peak purchase or renewable energy production.