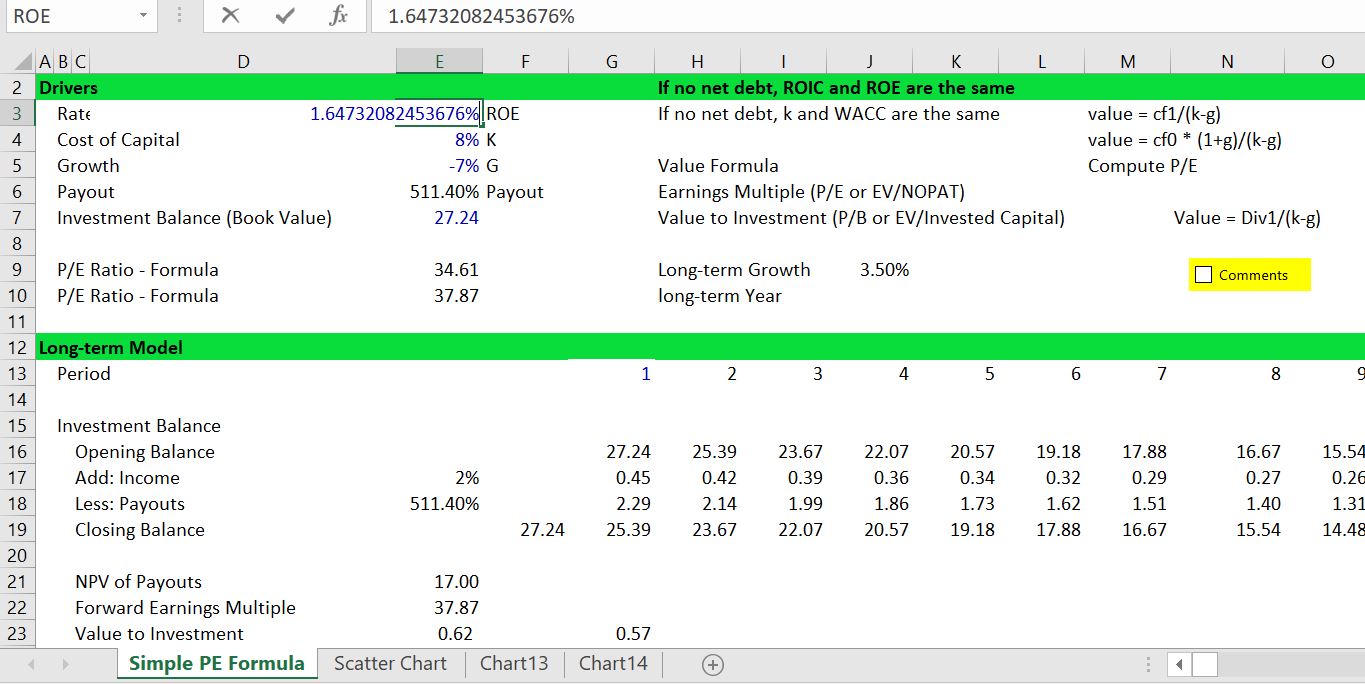
This page describes some theory and mechanical issues related to the value driver formula: Value = Earnings x (1-g/ROI)/(WACC-g). Subjects include derivation of the formula from a couple of fundamental financial equations; demonstration that when the ROI equals the cost of capital, the market value to book value is unity; illustration of how growth combined with returns in excess of the cost of capital can lead to big value increases; demonstration that changes in value as a function of returns and growth are not linear. I begin by reviewing a couple of consultant slides that illustrate the principles. I admit that I am obsessed with this formula and in particular working through problems with the formula. These problems include implicit changes in the earned return over time to gradually reach the stable return and the effect of inflation on the multiple that is derived from the formula.
I have put an excel file together with exercises that are used in this page. This file is attached to the button below. A file that has some exercises of returns and growth is attached to the button below.
First, Some Basic Financial Mathematics
There are a couple of fundamental equations in finance. The first is the equation for value that involves integrating cash flow with a constant growth. The integral results in the first equation below where Value = Cash Flow in next period/(k-g). The second equation is from the fundamental growth equation which reflects the fact that if all cash from income is taken out as dividends, then the company will not grow. If there is no growth and cash is plowed back into a company, then the growth rate is the same as the return on investment or g = (1-payout ratio) * ROE. The equations below illustrate how the couple of equations can be re-arranged so as to express value as a function of return, growth and cost of capital.
- Value = D1/(k-g) — Simple calculus
- DPO = (1-g/ROE) — Fundamental growth
- D1 = E1 * DPO — Dividends from Earnings
Substituting the E1 * DPO and DPO = (1-g/ROE) into the first equation:
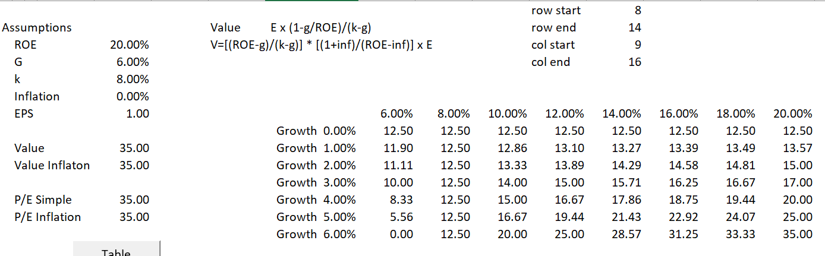
Value = E1 * (1-g/ROE)/(k-g)
For P/E Ratio
Value/E1 = (1-g/ROE)/(k-g)
For P/B Ratio
- E1=Book Value of Equity * ROE1
- Value = Book Value * ROE * (1-g/ROE)/(k-g)
Value/Book Value = (ROE-g)/(k-g)
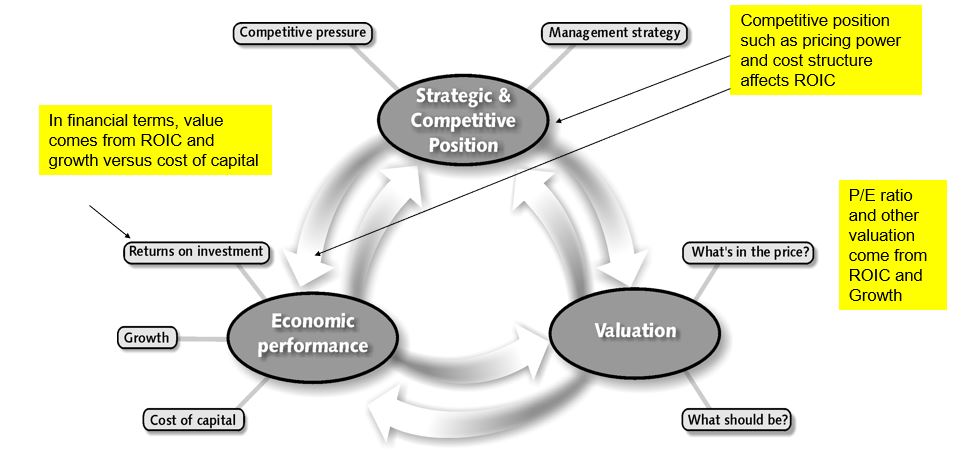
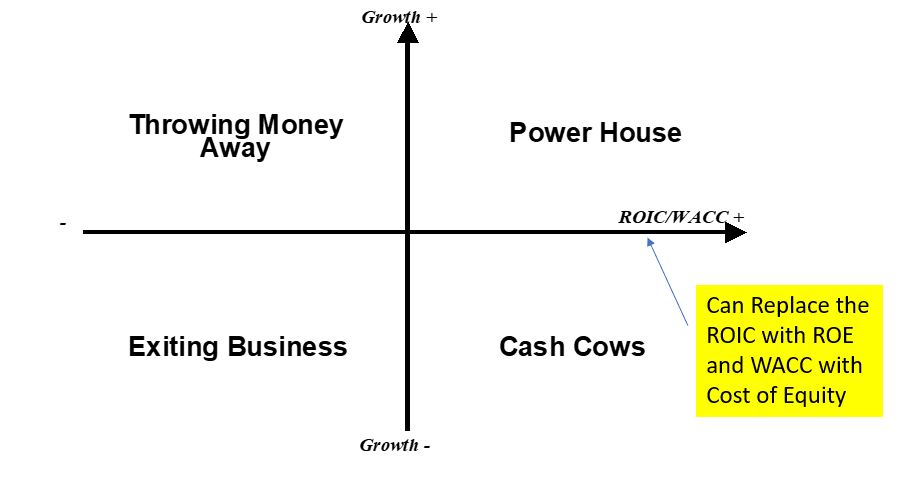
Strategy, Competition and Value Matrix
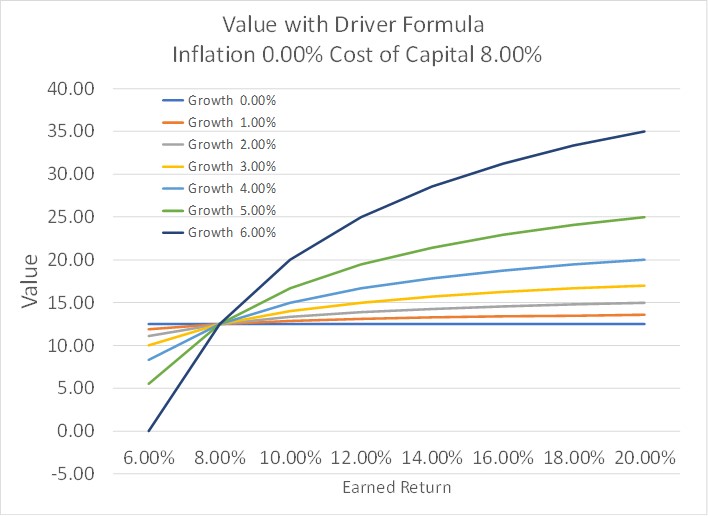
The pictures below are typical pictures that consultants may give you about valuation. The first slide emphasizes that value ultimately comes from the competition in the industry, industry growth and management proficiency and that translates into growth and return on investment. The second diagram demonstrates that the best place to be is where growth is high and return is high. The problem with this graph is that is also where everybody else wants to be.
Simulations
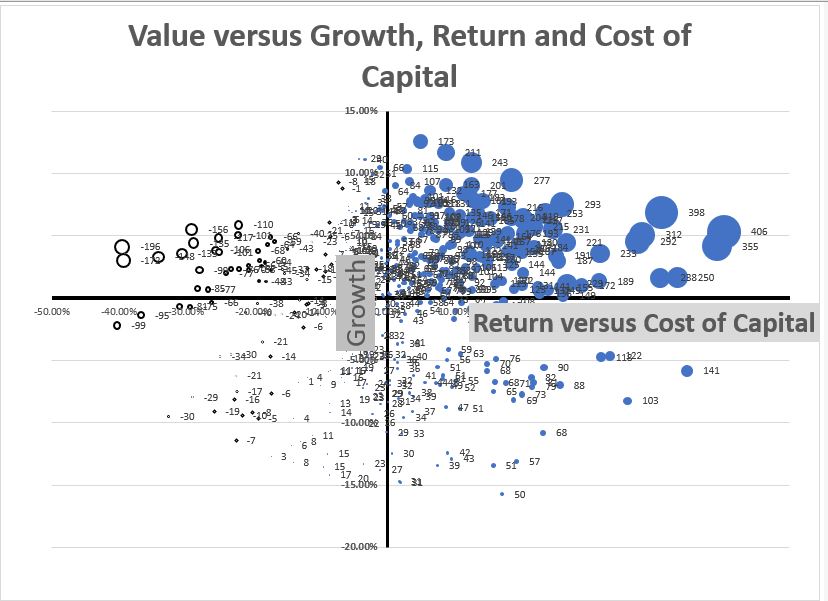
Simulation of Value with Different Returns and Growth Rates and Scatter Plot
I have made an analysis where I test the effect of growth and value. To do this I make a scatter plot with different returns relative to the WACC and also different growth rates. The results of this analysis are illustrated in the graph below. You can download the file that has the data for making this graph by clicking on the button below.
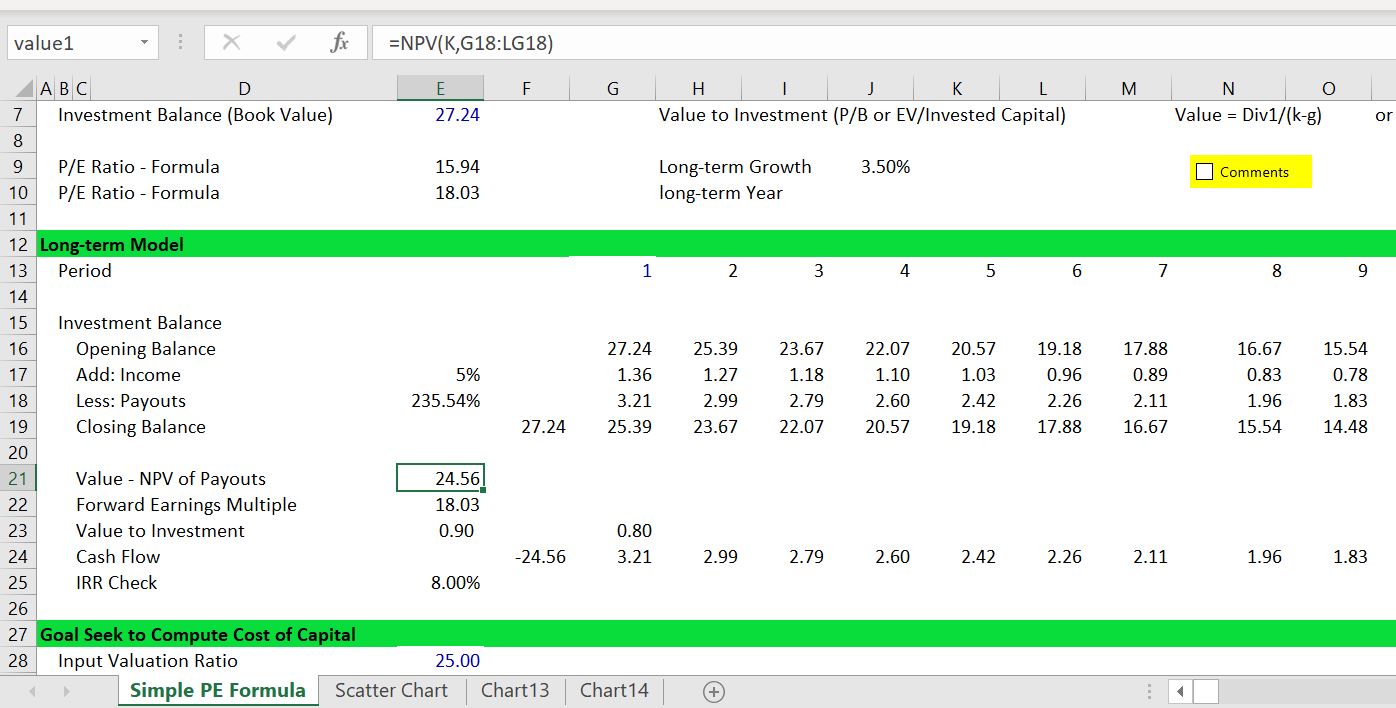
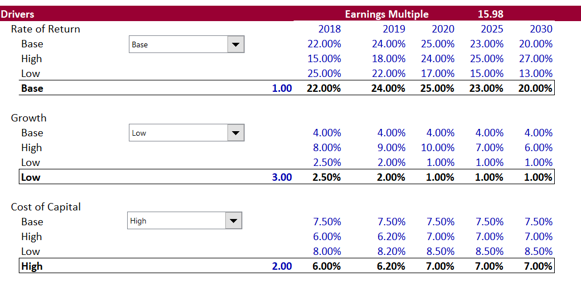
You can see how the Monte Carlo simulation works by looking at the screenshot below. I start with different sets of growth and returns and then copy the numbers into tables. After that, I create random variables around the base values. Then I run a macro that puts the different values in the valuation formula. The screenshot illustrates the formula for growth with a random factor. There is a similar formula for the ROE formula.
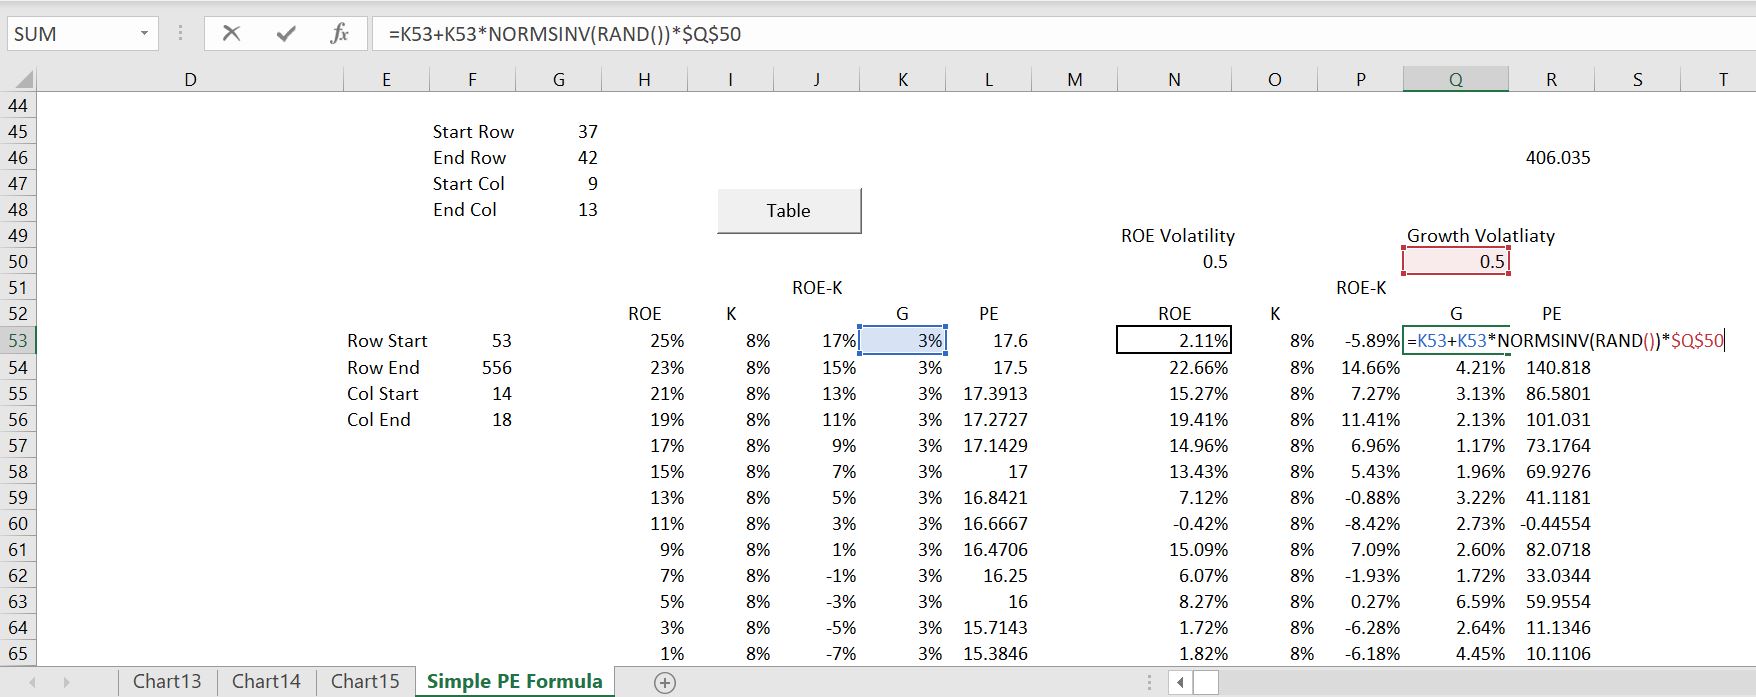
.
.
Sub table1()
'
' Macro1 Macro
'

For Row = Range("row_start") To Range("row_end")

Range("roe") = Cells(Row, Range("col_start"))
Range("k") = Cells(Row, Range("col_start") + 1)
Range("g") = Cells(Row, Range("col_start") + 3)

Cells(Row, Range("col_start") + 4) = Range("value1")


Next Row


'
End Sub
.
The scatter plots below demonstrate how the simulated data connects to the valuation analysis. The first screenshot shows the connection of the inputs from the macro — the ROE, k and g are changed. The second screenshot shows the value output.