This page addresses the question of timelines in project finance and other models. I argue for a consistent and standard time line with flexible dates across pages of a project finance model and that the practice of using many different time lines and different formulas for alternative parts of a project finance model is disgusting. Developing dates and timelines and putting the timelines at the top of each sheet is a standard part of financial modelling and included in all of the regular old blah blah blah classes that you can get elsewhere. Formulas for establishing dates and switches (or flags or masks or whatever you want to call them) is very standard. But, very surprisingly, the use of a master time line where you work through a simple formula for establishing dates is not generally done these days. In addition to complaining about multiple time lines I address a couple of other issues on this page. One issue that is a bit tricky is being careful about developing annual analysis when moving from monthly to semi-annual cash flows. Another issue that can be tricky is accumulating monthly data into semi-annual data or consolidating quarterly data.
As with other pages, I hope that you do not believe my ideas and just click another app or apply a bureaucratic method like FAST or SMART. Instead, I hope you can find the finance and modelling ideas a way to be creative. I hope to convince you to start at the bottom, even finding exactly how the data is measured, rather than just pressing some buttons and believing the result. In terms of excel style, I repeat here and will repeat my two rules so many times:
Rule 1: Make sure you can press the F2 Key and see all of the sources for the equations
Rule 2: Except for (X)LOOKUP or SUMIF, you should be able to find all of the sources in other sheets by pressing CNTL [ and then going back to your formula with the F5 key.
The video below demonstrates various timing issues in project finance models. It includes discussion of what happens when you have a model that does not end in months like December that is the fiscal year of the company. In this case you may want to pro-rate the data and put some of the amounts in a prior period or a future period for annual. I address this issue at the bottom of this webpage.
Make a Master Time Line
At some point you will want to compute an IRR that includes monthly periods and semi-annual periods. This means a master time line must be part of the model. I suggest starting with a period counter, then computing the months you have in the period, then using the EDATE function with the months in the period. It is really simple. But it is shocking to see people develop different pages with different timelines. This leads to painful SUMIF’s; too many lines in a model and difficulty in auditing.
To make a master time line that has different months in a period for pre-commercial operation and post-commercial operation, I find the easiest thing to do is to follow the following steps:
- Make a period counter with ALT, E, I, S (on English keyboard)
- Compute the months from the start of a model until COD (can use DAYS360)
- Compute flag for pre-COD
- Use the flag to compute the months in period
- Compute the start and end of period with EDATE
- Compute a flag for post-COD operations
This process is illustrated in the screenshots below. The first screenshot demonstrates how you can set-up the dates in the input sheet. The second screenshot illustrates the completed time line.
Timeline in the Case of Monthly Operations and Semi-Annual Financing
These days, you may have projects that have a lot of seasonality; there may be working capital calculations that last many months; there may be changes in operating expenses for different months and so forth. So in measuring the EBITDA and the working capital, you may want to make your model monthly. But when you get to the financing, it would not be silly to make your model semi-annual. This is because the repayments and the interest payments occur on a semi-annual basis and if you pretend that they occur on a monthly basis, your model would be incorrect. (You could compute all of the financing on a semi-annual basis, but this would make your model big and you would have to use either the SUMIF or the OFFSET function). To illustrate this case, you could define the timing of the operations sheet and the financing sheet differently as illustrated in the screenshot below.

To make the timing flexible, you can add the semi-annual dates to the page with the monthly analysis. With a date (I suggest the first of the month day and not the last of the month day and I insist that you keep things consistent), you can use the SUMIF function (using the entire line). To create a semi-annual date in the operating page can be a little tricky, but please do not give up and start using complex formulas. You should look at the dates and understand that after the COD, you want six months of the start of the COD date (not the period after that). If the COD date is 1 June 2020, then you want this date to be in the monthly analysis for six months. If you create a counter below the COD and then increment it by six months, you can use the EDATE function with a negative value as illustrated in the screenshot below. Note that if you make the counter negative, you can go back to the prior six months using the EDATE function. You can create the six month counter using IF(prior=6,1,prior+1). This will just count from 1 to 6 over and over again.
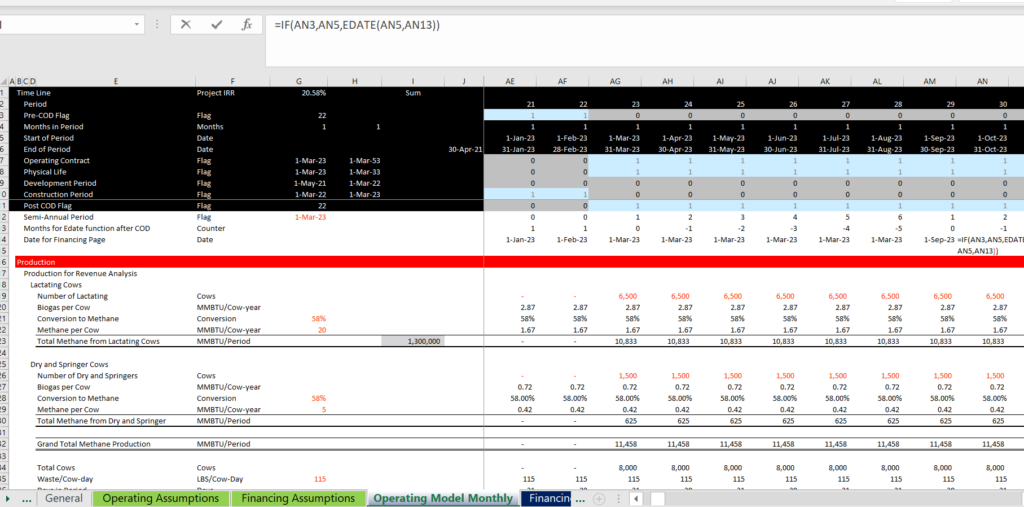
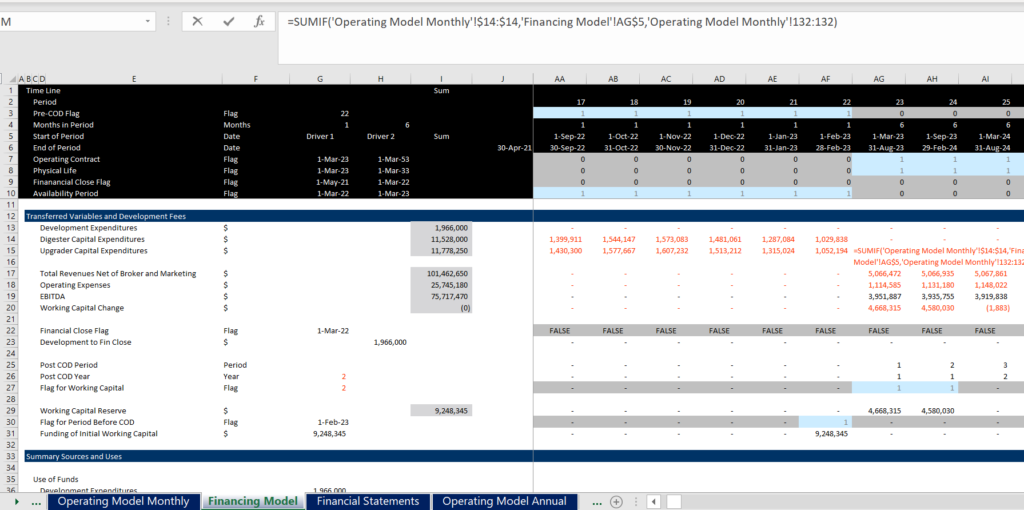
Once you have the dates for the semi-annual periods in the monthly analysis, you can move to the semi-annual page. If you use the classic method of establishing a months in period switch after the Pre-COD switch, then the dates in the semi-annual section should be the same as the semi-annual dates you put in the monthly page. I have illustrated this in the screenshot below. I show how you can use the dates from operating model and then use the start of the period in the financing sheet to establish the values for the variables that are transferred. By using the SUMIF with the semi-annual dates in the monthly page and the date in the financing page that is computed on a semi-annual basis, you can hold the formula the same except of the line item.
Timeline Examples – Keeping Useful Flags on the Top of the Sheet
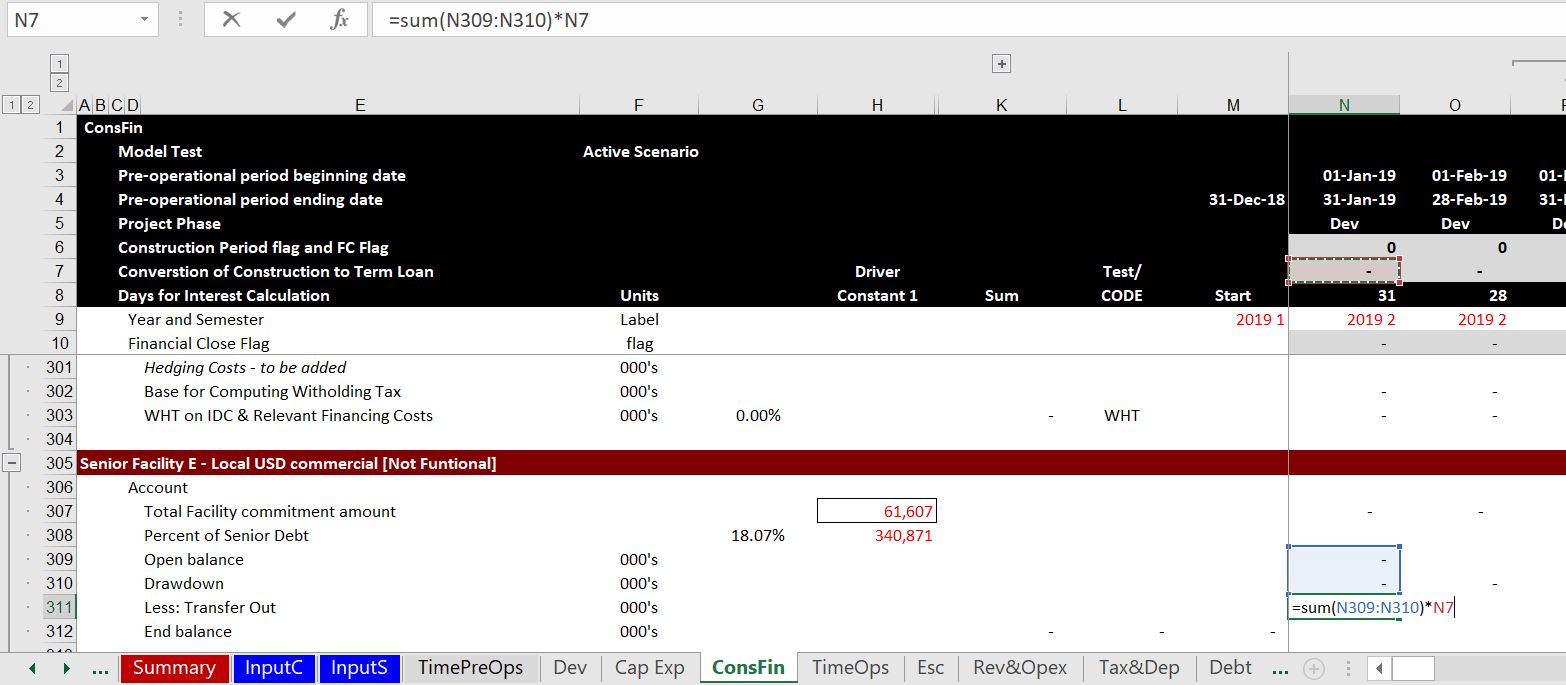
In the next few paragraphs, I put some examples of what to do and what not to do when you are setting-up your time lines. In the first screenshot below I suggest that you should find the time line switches like and operating flag or a flag that is date when the availability period of a loan turns into a term loan. You also often want to see the number of days for computing periodic interest rates. So, put key timelines that you will use over and over again at the top of the page as in the example below.
In the screenshot below I show a counter example where there is no time line at the top of the page and no useful switches. You can see that the timeline is in line 21 and there are no 1/0 or TRUE/FALSE switches that you can use over again at the top. For each page, it is basic modelling concept that a time line is at the top. Further, the formulas should be simple and not like the formula shown in the screenshot.
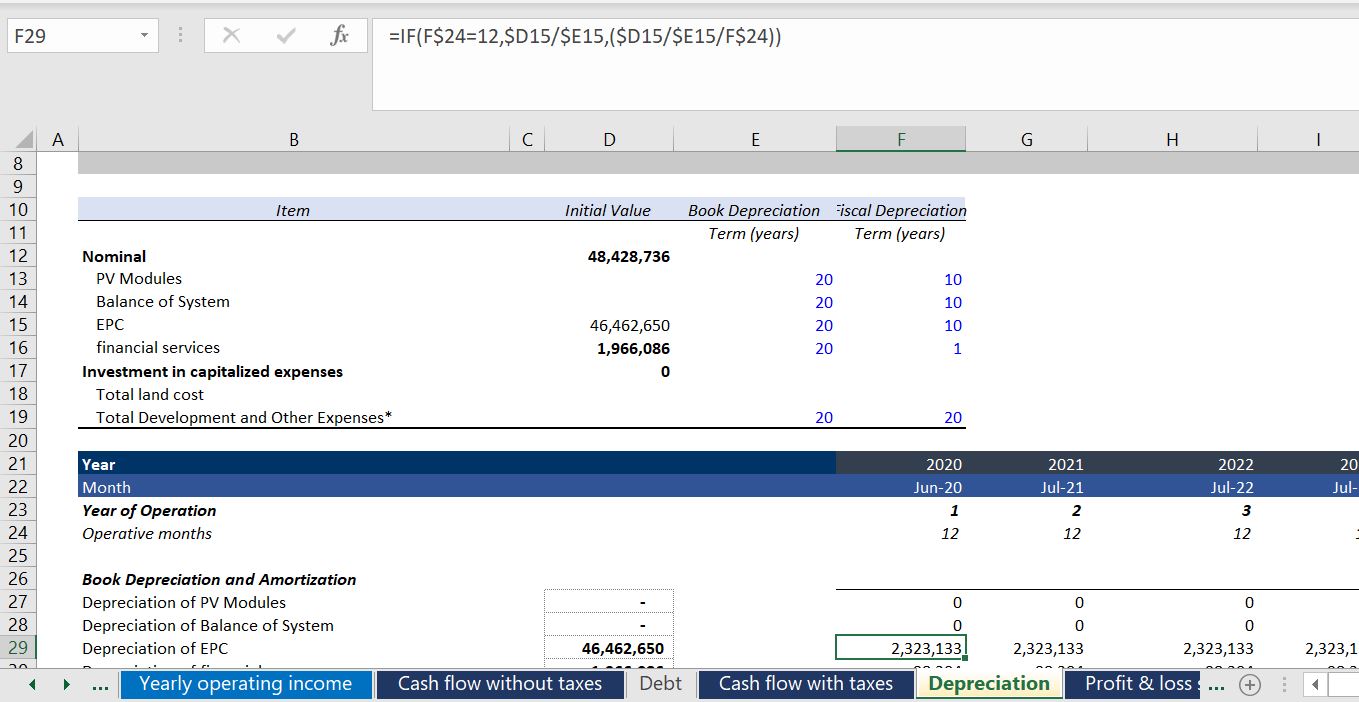
The next example of time lines is even worse. Here the year is a fixed number as shown in the formula box. This means that the date of the financial close or the commercial operation cannot be changed. This is a simple and dramatic error rendering the model very inflexible (counter to the F in FAST modelling). Please do not ever do this.
Fiscal Year End and Accumulation of Periodic Data into Fiscal Years
For the fiscal year used in the annual page, you want to find the end of the month before the COD. You can just use EOMONTH function and enter -1 for the month — EOMONTH(COD,-1). Then find the month of this date using the MONTH function. Once you have the month end for the fiscal year, enter a switch that is true whenever the end month in the main time line is equal to that month. You should create the year of the date with the formula that the year changes when the fiscal month is reached. To do this use an IF formula — IF(MONTH(end date in time line) = Month End defined above, Year = year +1, prior year). This makes a year counter that increments whenever the fiscal year end is true.
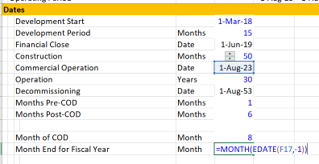
The process is shown in the two screenshots below. The first screen shot is really the key. Note that the commercial operation date is 1 August 2023. You need to find the prior month (including if the month happens to be December). This month can be used to drive the SUMIF function. Note that instead of using the function MONTH(COD) – 1 which would not work for January or December, you can use the EDATE with -1 for the month and then put the month around the EDATE. The formula is:
Month of Fiscal Year End = MONTH(EDATE(COD,-1)).
The second part of this method is shown in the screenshot below. In this example, the COD date using the standard monthly analysis is 1-May-2018. This means the fiscal year end will be April. But when the model switches to semi-annual mode, the month of April is in the ending date and not the beginning date. But you want the switch for a new year to start after the closing date. So you should take the PRIOR closing month and use that in the test. Once you have done all of this you can use the computed fiscal year end rather than the calendar year computed from the start or end date. The fiscal year is computed from the prior fiscal year and changing the year when the switch is TRUE. This sheet uses the generic macro program to point out when a flag is on or off. Go to the generic macro discussion to see how to do this automatically. In this example again, the numbers in the left (the dates) that come from another sheets are coloured in red (you could also colour the cells according to the sheet name).

User Defined Functions for Quarterly and Semi-Annual Time Lines
Most of the time, creating a timeline is pretty straightforward. You can count the months pre-COD and create a timing switch that is 1 for the monthly periods and 6 for the semi-annual periods (or 3 for quarterly periods). Then you can use the EOMONTH or EDATE function to count the months (if you use the EDATE function, subtract 1 for the end of the month. If you use EOMONTH, subtract 1 inside the formula. Sometimes when you use a half-year model, you may need to aggregate months into half years. You can use the user defined functions below to compute the appropriate half year or quarterly date from the monthly date. If you use quarterly time periods or monthly periods that will be converted to semi-annual flows, the following user-defined functions may be useful. The first function returns the end of the half year period given the date. The second function returns the end of the quarter. These functions should be part of excel.
Function eohy(date1)
month_of_date = Month(date1)
If month_of_date = 1 Or month_of_date = 7 _
     Then eohy = WorksheetFunction.EoMonth(date1, 5)

If month_of_date = 2 Or month_of_date = 8 _
     Then eohy = WorksheetFunction.EoMonth(date1, 4)

If month_of_date = 3 Or month_of_date = 9 _
      Then eohy = WorksheetFunction.EoMonth(date1, 3)

If month_of_date = 4 Or month_of_date = 10 _
    Then eohy = WorksheetFunction.EoMonth(date1, 2)

If month_of_date = 5 Or month_of_date = 11 _
     Then eohy = WorksheetFunction.EoMonth(date1, 1)

If month_of_date = 6 Or month_of_date = 12 _
     Then eohy = WorksheetFunction.EoMonth(date1, 0)

End Function


Function eoqtr(date1)

month_of_date = Month(date1)

If month_of_date = 1 Or month_of_date = 4 Or month_of_date = 7 Or month_of_date = 10 _
Then eoqtr = WorksheetFunction.EoMonth(date1, 2)

If month_of_date = 2 Or month_of_date = 5 Or month_of_date = 8 Or month_of_date = 11 _
Then eoqtr = WorksheetFunction.EoMonth(date1, 1)

If month_of_date = 3 Or month_of_date = 6 Or month_of_date = 9 Or month_of_date = 12 _
Then eoqtr = WorksheetFunction.EoMonth(date1, 0)


End Function