This page includes exercise files, power point slides and instructions for the course on Corporate PPAs and Merchant Prices. The course includes exercises discussion of alternative corporate PPAs and working through an example of a corporate PPA contract. Other subjects include how to compute short-term and long-run marginal cost; working with merchant price data and understanding how Corporate PPAs work with swaps, contracts for differences and forward prices. In explaining how the concepts work I emphasize the foundations of how prices and values are established. We also work though contract issues once the economic issues are established.
- Some starting point items may seem basic like allocating risks to those who control the risk, but beginning with the key philosophic items will drive much more nuanced issues.
- Some of the marginal cost analysis may seem simple like developing a supply curve and matching that with demand. But the fundamental ideas can be used to evaluate all sorts of issues related to renewable energy, storage and merchant prices.
- Some of the merchant price analysis based on historic data may seem to be out of date. But the case studies which are driven by supply and demand reflect analysis that has not changed and studying selected issues using historic price analysis.
First, Power Point Slides for the Course. The first set of slides below includes the primary issues that are covered in the course. The second set of slides describes financing issues and the third power point slide discusses some old case studies.
.
.
The second document for the class is an example of a corporate PPA. We will use this example to work through and understand issues in a corporate PPA that are similar to and that differ from a standard utility company or single buyer off-take PPA agreement.
.
.
The third file we will use for the course is a file with European Prices from 2019 (pre-pandemic) to 2024 (after the large spikes from gas prices). This is an excel file that demonstrates how to work with data and to make flexible presentations demonstrating the effect of increased renewable energy on hourly prices.
.
Excel File with Hourly Prices in Europe from 2019 to 2024 used to Evaluate Renewable Energy Effects
.
The fourth file is an exercise file with various calculations related to the corporate PPA including the quantifying the contract terms and evaluating market prices.
.
.
Other files that may be used are shown below
.
Power Point Slides Describing Issues Financial Issues Associated with Electricity Power Projects
.
Power Purchase Agreement Contract Example with Both Solar Facility and Solar and Battery
.
The buttons below are attached to database worksheet files that evaluate the pricing of power in Europe. This button below is attached to an excel file where you can evaluate how power prices work and how electricity prices relate to loads, natural gas prices, and wind power. The file allows you to compare prices in different regions. I believe you can learn a lot from use of different time period analysis and different comparisons.
.
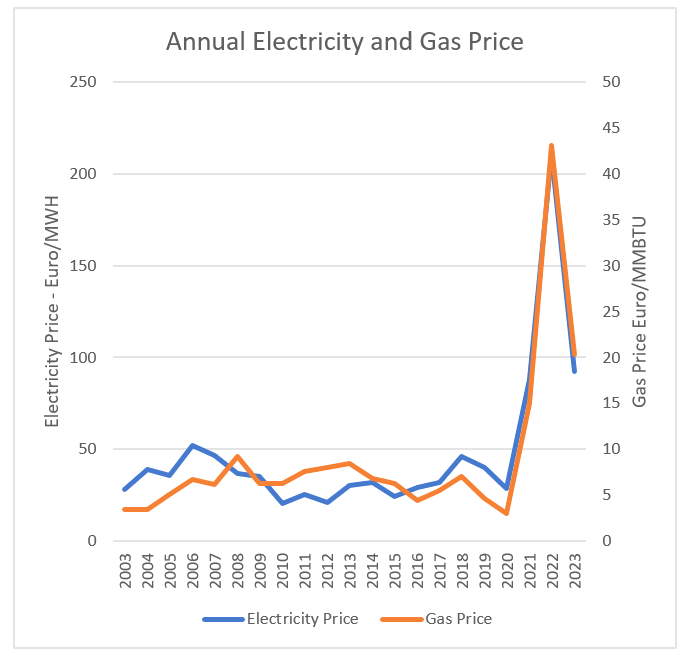
Excel File with Analysis of Merchant Electricity and Gas Prices in Europe for the Dramatic Year 2022
.
Comprehensive Nordpool Database with Wind, Consumption and Natural Gas Prices from 1997 and 2003
.
..
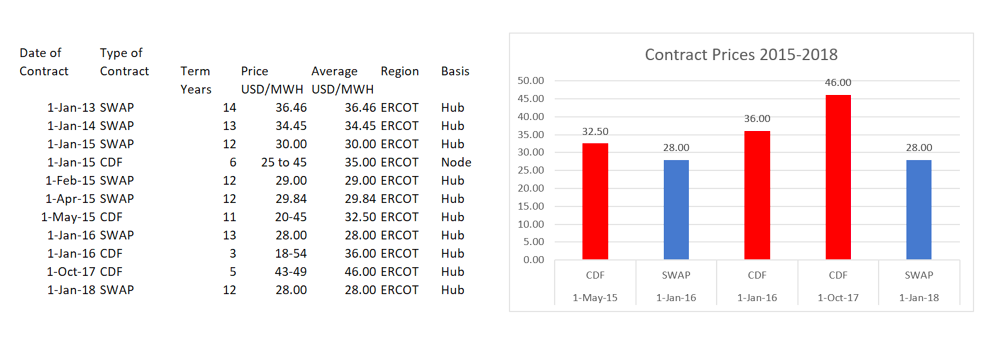
Understanding different types of Contracts in Merchant Markets
ERCOT Case Study for Hub versus Node and Financial Contracts (Swaps) versus CdF
.
Denmark Case Study for Value of Merchant Wind, P99 Hedge and Exposure Tracking Account
.
.
Corporate PPA Contract Example in PDF File for Wind Power Plant with Manfacturer and Merhant Market
.
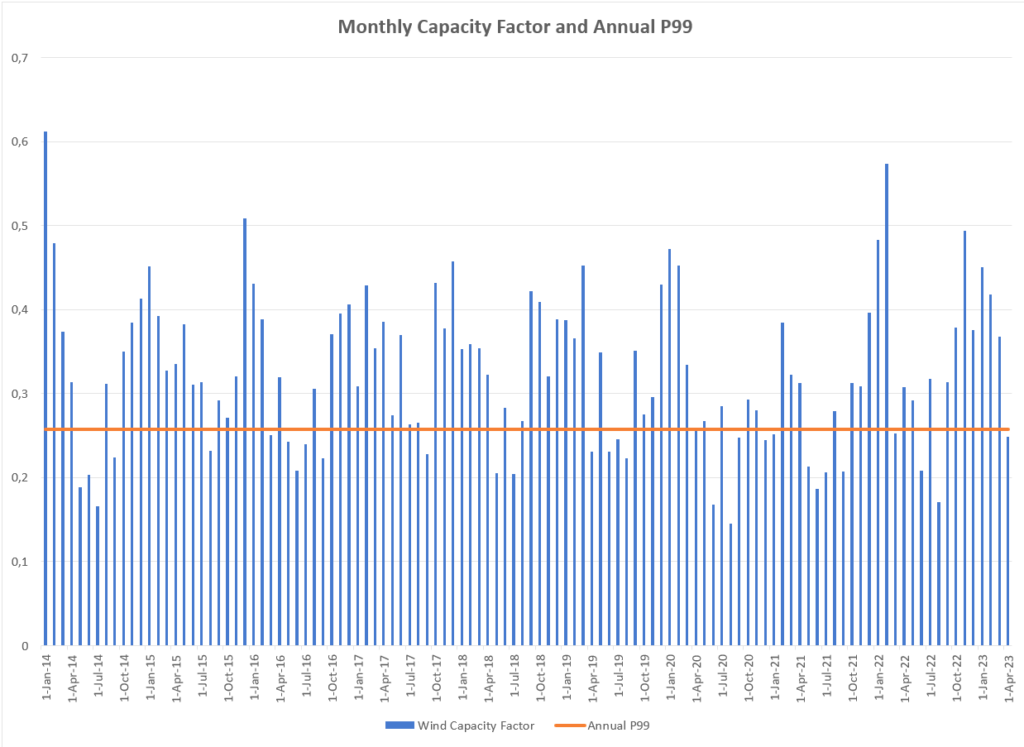
Analysis of P99 Hedge Using Denmark Hourly Wind and Denmark Prices
Why is it a P99 Hedge
You need a notional quantity when you are using a swap and you do not need a notional quantity when you are using a contract for difference. It is a whole lot more difficult for somebody to try and hedge something when you don’t even know the quantity. In the slides and the video you can see how I have tried to evaluate the pricing on a swap versus a contract for difference. With some scant data I the screenshot below illustrates how the contract for difference has a higher price. But always remember that you must find the notional quantity on a swap contract.
.
..
.
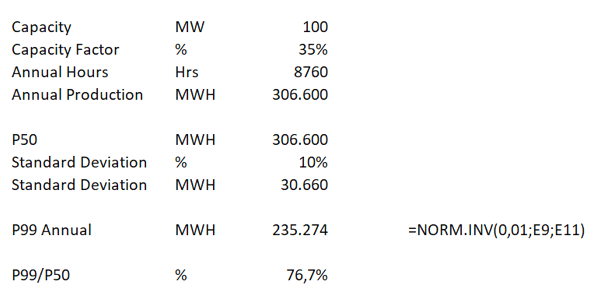
Standard Deviation and P99
Basic Fact about Standard Deviation that drives P99. Standard deviation of hour by hour cannot be added to get standard deviation of monthly Standard deviation of monthly cannot be used to compute standard deviation of hourly That’s why you use mean squared error. That’s what portfolio theory is all about. The little example below shows that 80% below the P50 is a P99 if the standard deviation is about 10%.
The graph below shows the P99 for a month versus the P99 for a year with the month by month capacity factor for Denmark. As expected the monthly variation is much more. This is explained in the video above.
.
.
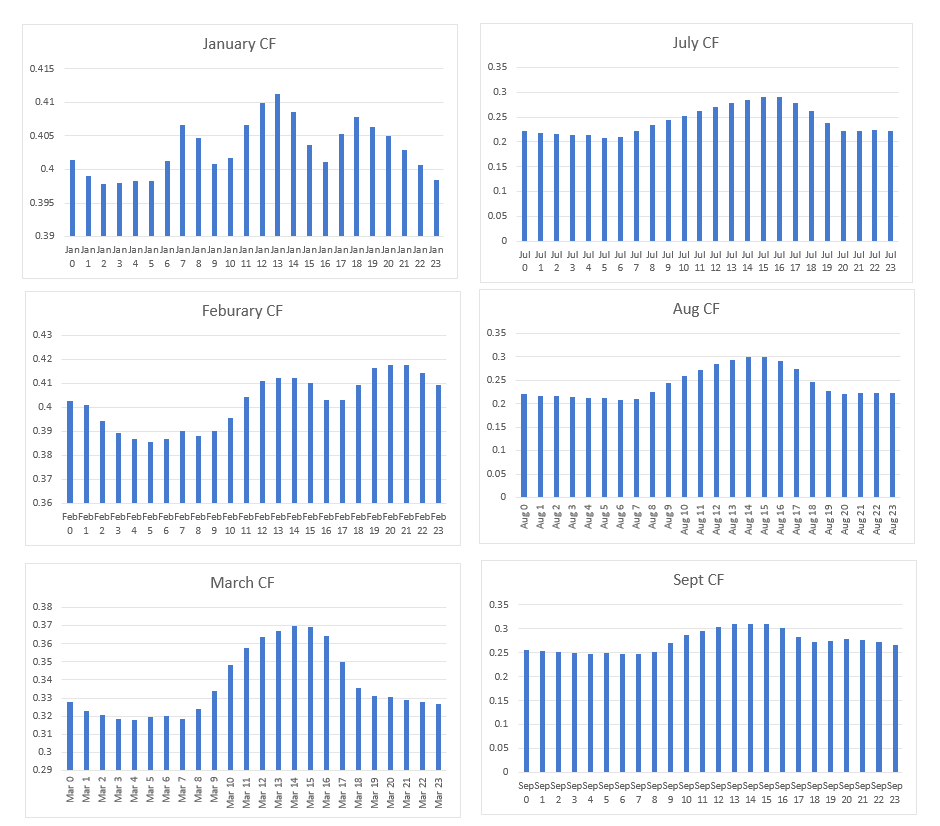
The screenshot below illustrates shape curves using the capacity factor from the Denmark case study. Different shape curves are made for each hour using the AVERAGEIF function.
Basic Fact about Standard Deviation that drives P99. Standard deviation of hour by hour cannot be added to get standard deviation of monthly Standard deviation of monthly cannot be used to compute standard deviation of hourly úThat’s why you use mean squared error úThat’s what portfolio theory is all about.
§Reduce the capacity factor and then compare the shaped capacity factor to the actual capacity factor. §Two cases úIf the actual capacity factor is greater than the shaped capacity factor, then sell in the merchant market úThe sales for 1 MW is the surplus capacity factor multiplied by the merchant price (this does not account for basis difference) úIf the actual capacity factor is less than the shaped capacity factor, then buy from the merchant market úOnce have the data by hour, sum the data over all of the hours for the year.
.
Excel File for Treasury Analysis with Daily Analysis of Accounts Receivable and Borrowing with Loans
.
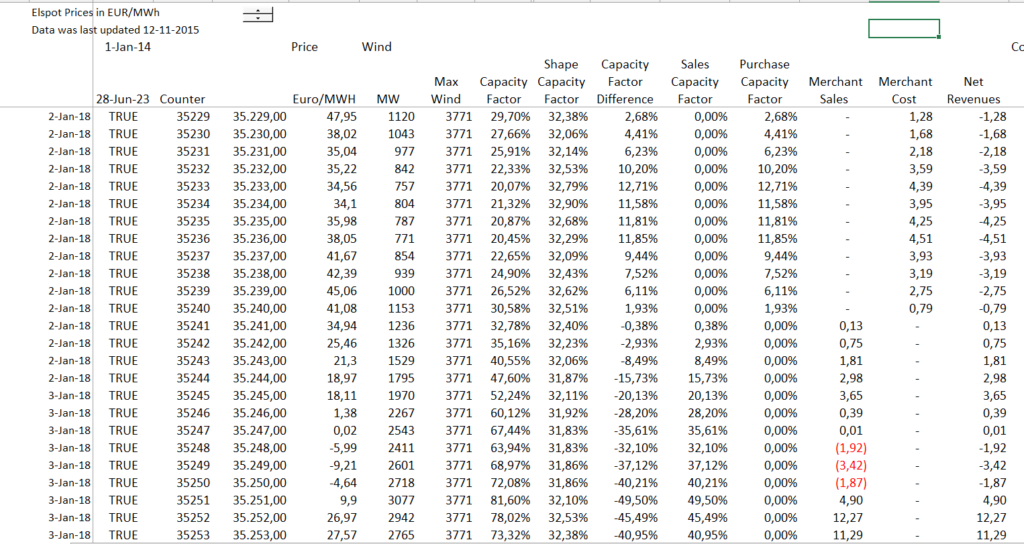
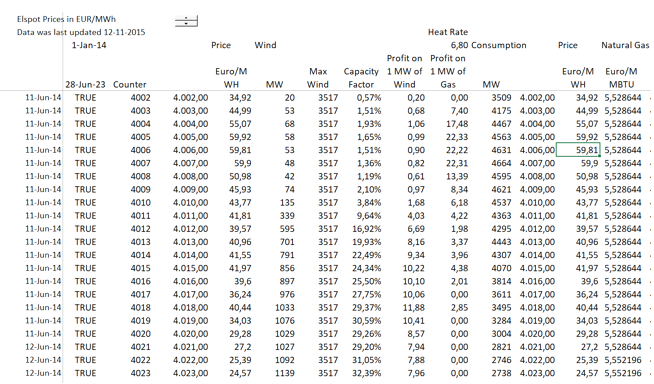
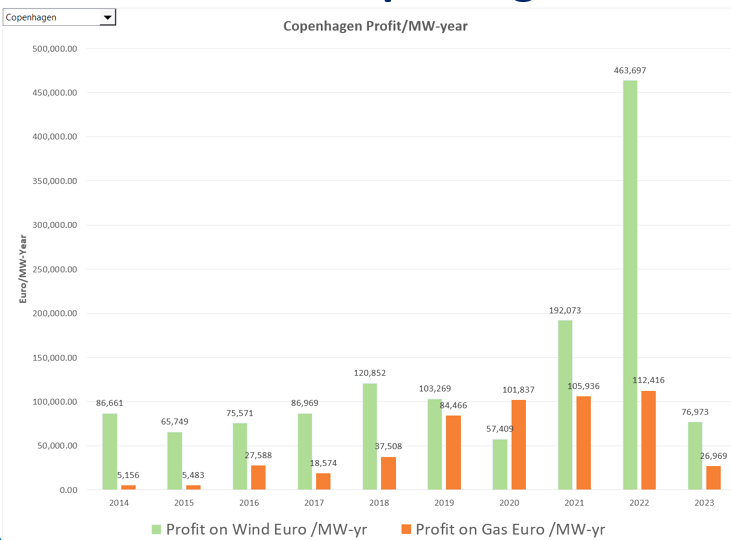
Analysis of Merchant Value of Wind and Natural Gas
In the slides I discuss the classic problem of merchant price and the over-capacity of natural gas in many markets. But Wind and solar make their money from the total price rather than the margin on the gas price. This is illustrated by the formulas below. The screenshot shows hour by hour values for a wind and gas plant.
Value of Merchant – Look backwards instead of forward. For 1 MW of Wind or Solar. In each hour, capacity factor x Euro/MWH = Profit/MWH. Sum across all hours of year = Profit/MW-year.Can compare to fixed cost per MW-year úFor 1 MW of Natural Gas. If dispatched profit = Euro/MWH – Euro/MMBTU x MMBTU/MWH). If not dispatched, zero
.
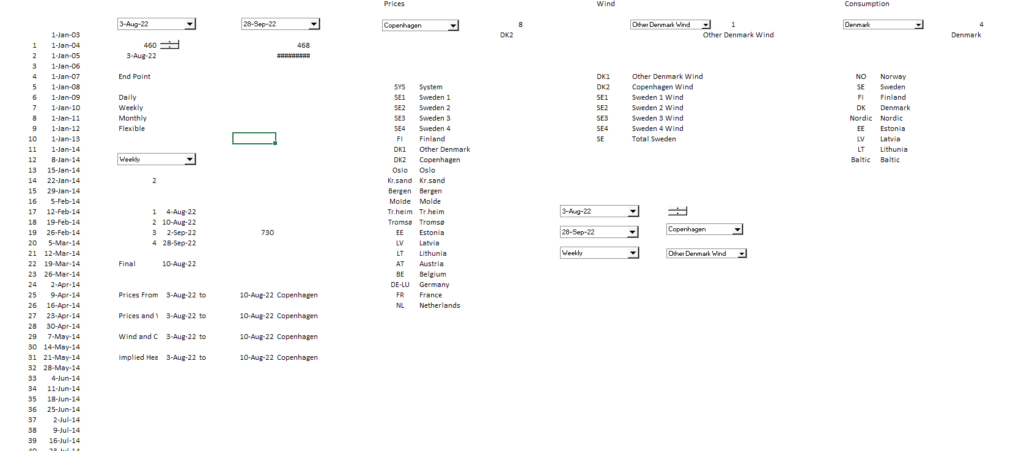
Making Flexible Graphs
I hope the power point slides and the discussion has shown the importance of making different graphs and presentations. Sometimes you can see things with a daily graph, sometimes hourly over a day, month or year, sometimes things are more clear with a monthly graph. The video below and the screenshot illustrate how to make you graphs flexible so you can do the analysis. Please note that without the ability to download data by yourself, you cannot do any of this. That is why I am so obsessed about getting the data yourself.
.
.
.
The video below introduces some of the issues covered in the first set of slides on general merchant power, electricity economics and corporate PPAs
.
.
.
The files below contain exercise files for short-run and long-run marginal cost
.