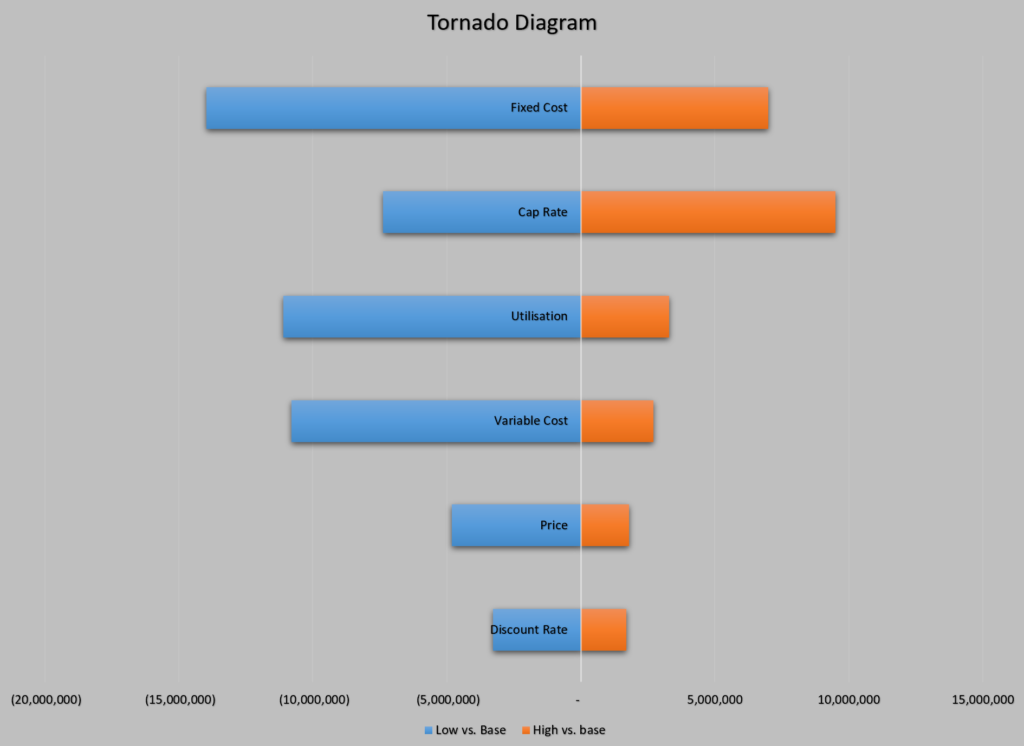
This page explains how to make different presentations of scenario and sensitivity analysis using tornado diagrams and spider diagrams. A tornado diagram can be a good risk tool because it shows the importance of different variables and it demonstrates whether there is more downside or upside risk. A spider diagram can be used when sensitivity variables are expressed as percentages (e.g.120% or 90%). Then a two way data table can be used with the percentages and the various different input variables. In creating a tornado diagram you need add a whole bunch of scenarios where each sensitivity has only variables that differ from the base case. Creating a tornado diagram quickly involves using a combination of the data table tool and the index function. The process is helped with the TRANSPOSE function. You can walk through the process of creating a tornado diagram by downloading the file attached to the button below.
Fundamentals of Creating a Tornado Diagram from a Scenario Analysis using a One-Way Data Table
Video and the file below demonstrate how to create a tornado diagram in just about any file. You need to set up a scenario analysis with a a base case, low case and high case. When you do this, the key is to use the INDEX function and put a code number for the scenario that is operating. Then you attach the inputs from your file to the INDEX function results in the scenario diagram. After making this basic scenario diagram, you should make your scenario analysis into a sensitivity analysis. To do this, use the TRANSPOSE function with the titles for all of the items in the scenario analysis. This is just like creating a whole bunch of new scenarios.
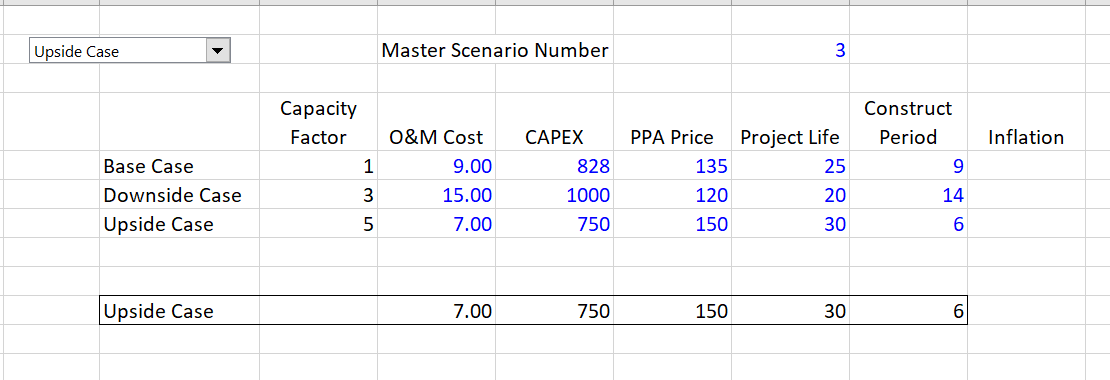
Start with a regular scenario analysis with a base case, a downside case and an upside case as illustrated below. At the bottom there is a normal INDEX function that is used as the basis for linking the inputs.
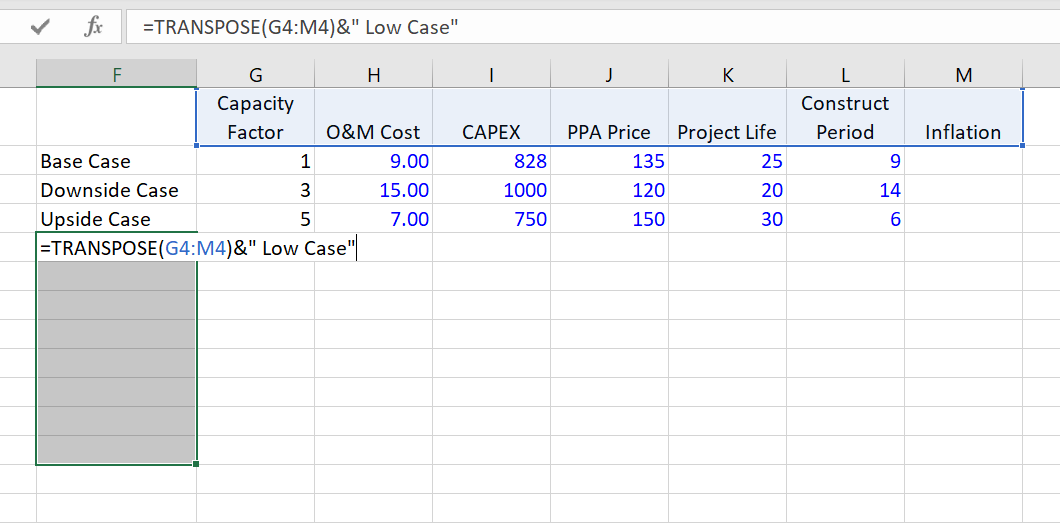
Next, you will create sensitivity cases where you start from the base case and change one variable at a time. To do this, count how many variables you have — seven in the example above. Add fourteen lines — one set for the downside case and one for the upside case. Then you can use the TRANSPOSE function and put together a list of the different cases. The way you can use the transpose case is illustrated on the screenshot below. Don’t forget to press SHIFT, CNTL, ENTER and not enter when you are finished with entering your TRANSPOSE function.
After you have finished entering all of the different cases, your table should look something like the table below. The base case is copied to all of the different rows and then you go item by item and replace the single variable that is being tested with the low case first and then the high case. You can use conditional formatting to make different colours for the variables that are changed. To do this you need to select the area and then go to the top left. Then make a formula that tests the item against the base case using the not equal sign or <>. Finally, make the data table with all of the rows.

The final step in making a simple tornado diagram (without sorting and adding other features) is to make a little table that compares each sensitivity case to the base case. You can start with the high case and then compare each of the values (the IRR’s in our case) with the base case value. This is shown on the table below. To create the table, you use the TRANSPOSE function once again to convert the rows to columns. Then you can put in the comparisons for both the high case and the low case.

Once you have this little table, select the area and then press either the ALT, F1 or the F11. Then change the chart type to a bar chart (the second option).

Video on How to Create Tornado Diagram
[wonderplugin_video iframe=”https://www.youtube.com/watch?v=0x1sx5YKpr8″ videowidth=600 videoheight=400 keepaspectratio=1 videocss=”position:relative;display:block;background-color:#000;overflow:hidden;max-width:100%;margin:0 auto;” playbutton=”https://edbodmer.com/wp-content/plugins/wonderplugin-video-embed/engine/playvideo-64-64-0.png”]
Resources that you can find on the library related to tornado charts are listed below. Send me an e-mail at edwardbodmer@gmail.com to get the files.
- tornado_diagram_macros_new.xls
- Tornado Exercise.xls
- tornado chart template.crtx
Scenario and Tornado Exercise Finished.xlsx
Scenario and Tornado Exercise Two Way Table.xlsm