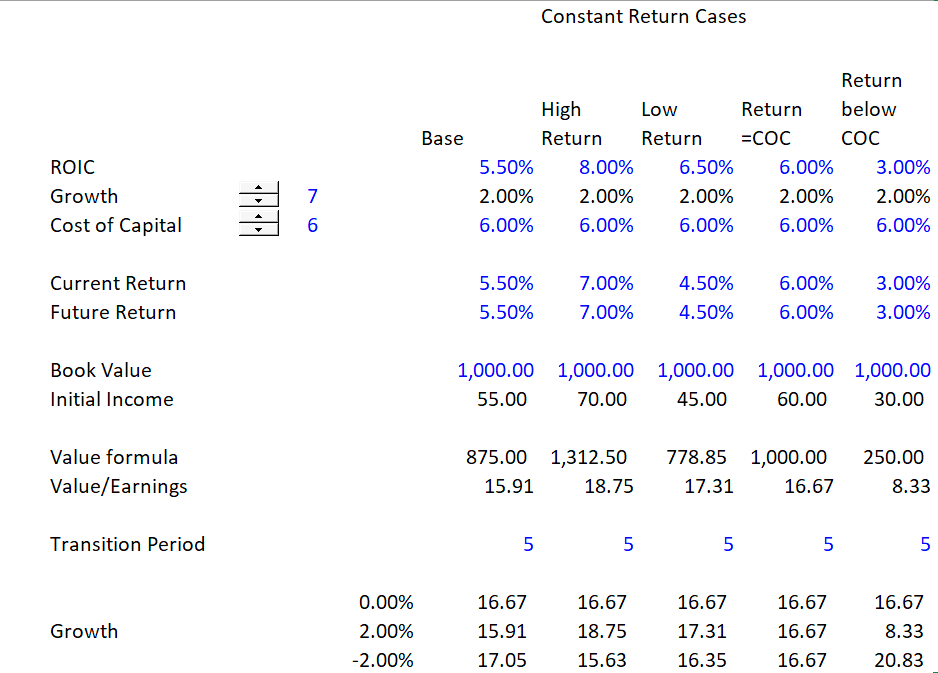
P/E ratios and EV/EBITDA ratios are used in valuation in all sorts of contexts and often discussed by experts on television. The question of why a multiple for an industry or a company in an industry should be high or low and whether the overall level of the multiple is high or low is not addressed in a rigorous manner in either finance texts or by those horrible people who shout so loudly on the TV. The exercises in this section demonstrate that both the P/E ratio and EV/EBITDA ratio are affected by future returns, growth and the cost of capital which are the standard drivers of value. To illustrate the ideas I begin with the value driver formula –> Value = Income * (1-growth/return)/(cost of capital – growth).
The initial videos describe how P/E ratios can be computed from the value drivers with changes in growth and cost of capital. The EV/EBITDA analysis shows how the EV/EBITDA ratio is different from the P/E ratio because the EV/EBITDA ratio is affected by tax, capital expenditure and depreciation relative to EBITDA and working capital adjustments. A problem I have with all of this is that the true economic drivers of changes in return are not discussed, meaning that you cannot just predict returns but you should carefully think about how price can move to short-run marginal cost; how margins are driven by supply and demand; how technological obsolescence can ruin a business; how some industries are more exposed to surplus capacity than others; how monopoly or oligopoly profits can disappear; how valuable are brands and the ability of companies like Apple, Starbucks, Coke, Disney and McDonalds can continue to earn returns through making the unsuspecting public become strongly addicted to their products.
Constant Return and Different Growth
Demonstrates that you cannot interpret without understanding the differences in future growth.
Videos Associated Evaluation of P/E, EV/EBITDA and P/B from Economic Drivers
Files Used in Valuation Concepts Lesson Set 2: Computation of P/E, EV/EBITDA and P/B from Economic Drivers
Here are files that I will be uploading and describing. If you want access to the file before I have finished the process of uploading them, please send me an e-mail to edwardbodmer@gmail.com and ask for the resource library.
PE and EV to EBITDA Multiples – Linear.xlsm
Proof of Timing in DCF Model.xlsx
PE and EV to EBITDA Multiples -Growth.xlsm
Corporate and Project Model.xlsm
Variable WACC in DCF Model.xlsm
EV/EBITDA and Required Income to Pay for Your House versus Your Masaritti
EV/EBITDA will be lower for companies that need to replace assets more quickly. If the net investment is the same and the EBITDA is the same, the company with shorter lived assets will have to replace assets more quickly and have more capital expenditures for the same EBITDA. This means EV/EBITDA will be lower for companies with higher depreciation rates.This means you cannot theoretically compare the EV/EBTIDA across different industries with different types of assets (and also within the industry)