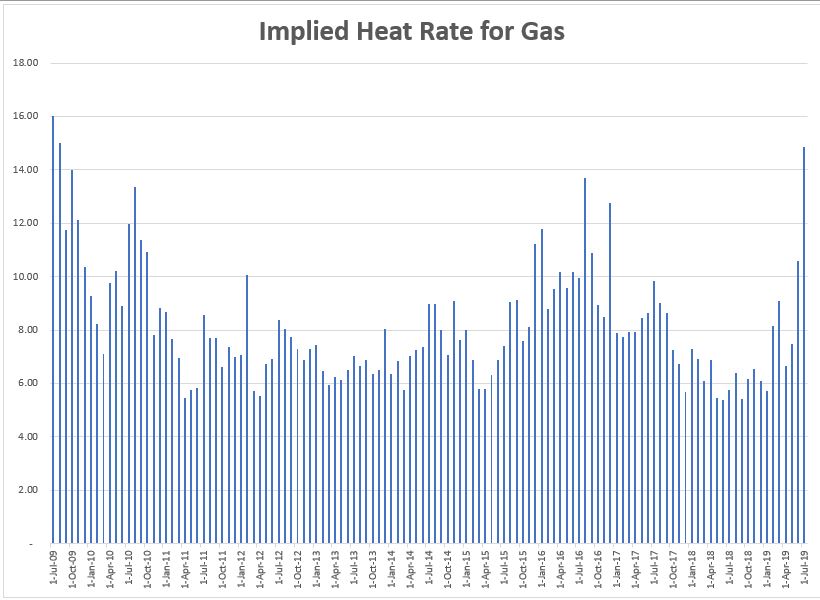
This page describes historic merchant electric price data for Turkey. The database includes raw prices in Turkish Lira and prices converted to USD. The historic price have been recorded on an hour by hour basis since the spring of 2009. The Turkey merchant electricity prices are expressed in USD and compared to natural gas prices as with other merchant markets. In this way, through expressing prices in USD, you can compare Turkey prices to worldwide merchant prices in other places in terms of price levels and volatility. As with other worldwide merchant electricity prices, I have provided instructions so that you can update the spreadsheets yourself and you do not have to waste time entering the historic data. The files for Turkey prices include the hour by hour database and the file that retrieves the historic currencies. A problem with this sort of analysis is that the natural gas in Turkey comes a lot from Russia and the Gazprom price to Turkey is not published. From the bit of data I have seen, the Gazprom price is somewhere the Northwest European price published by the world bank and the Asian LNG price. The analysis below presents implied heat rate price and gas price comparisons using both the European gas price and the Asian LNG price. The video below the buttons shows how you can update the database. The graphs below the buttons illustrate some of the things that you can evaluate with the database.
.
.
.
.
.
.
.
.
.
.
[wonderplugin_video iframe=”https://www.youtube.com/watch?v=sBxwbRNepIQ” videowidth=600 videoheight=400 keepaspectratio=1 videocss=”position:relative;display:block;background-color:#000;overflow:hidden;max-width:100%;margin:0 auto;” playbutton=”https://edbodmer.com/wp-content/plugins/wonderplugin-video-embed/engine/playvideo-64-64-0.png”]
Turkey Prices.xlsm Get Historic Exchange Rates.xls
.
.
Updating Turkey Merchant Prices by Yourself
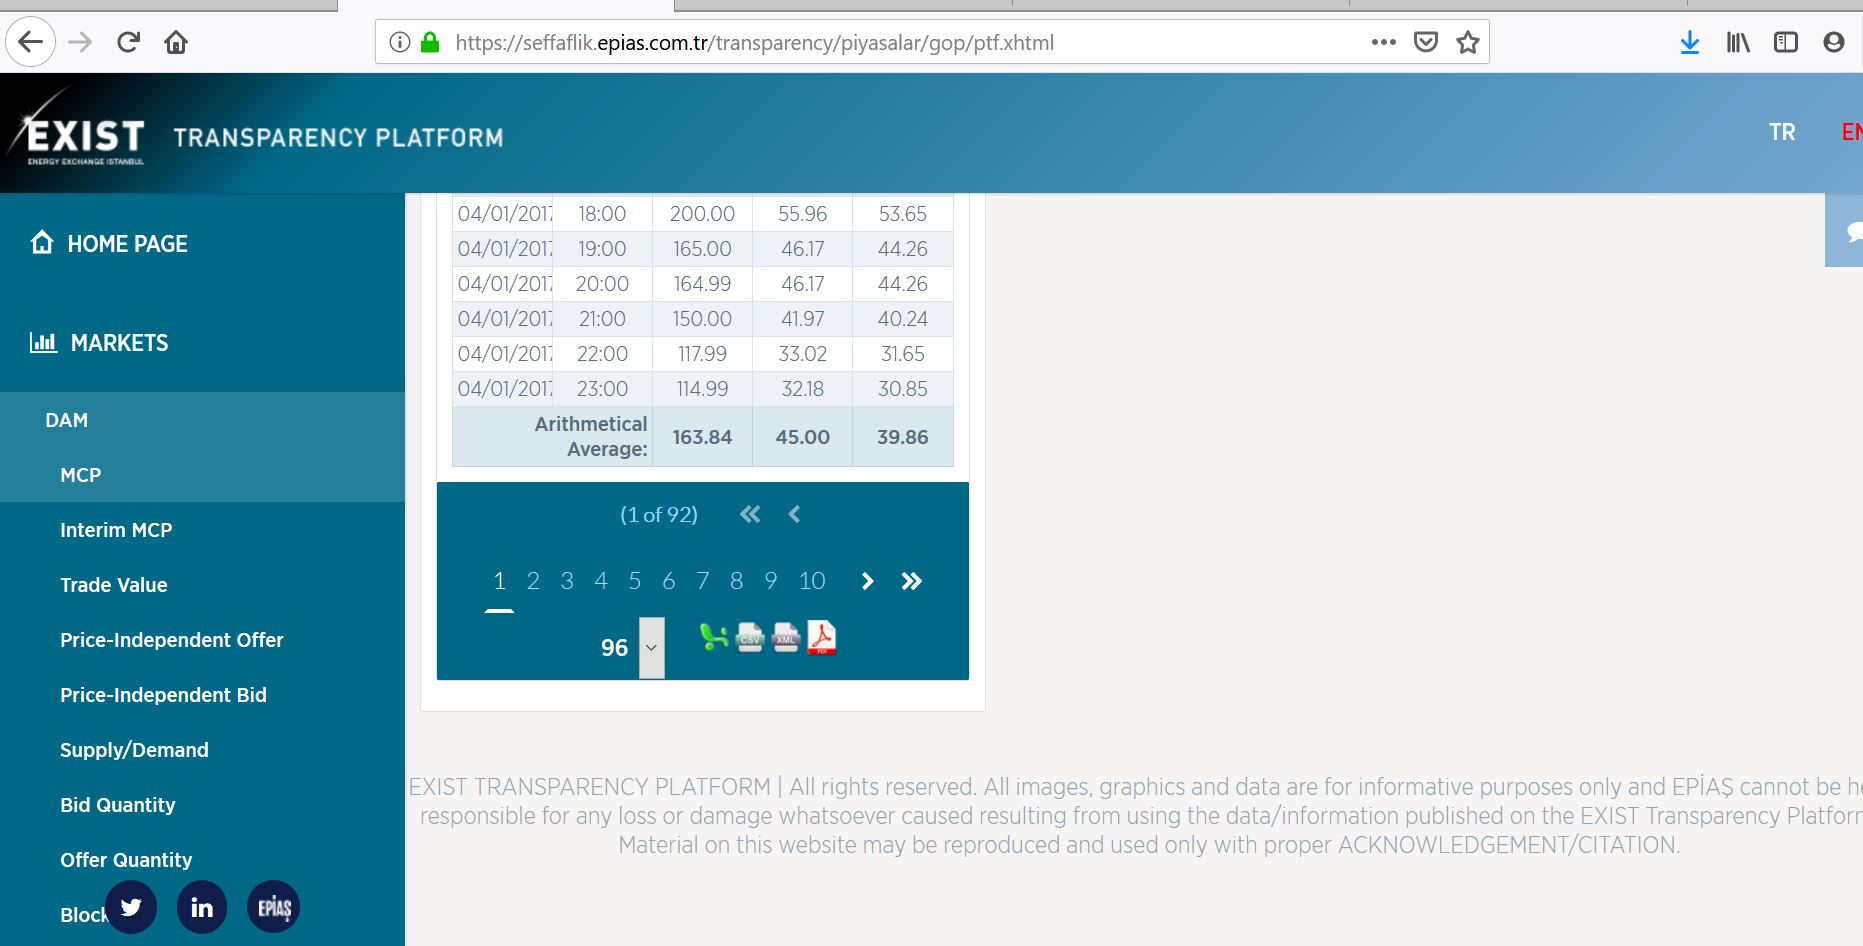
This section provides instructions on how you can regularly update prices and keep your analysis of Turkey Prices current. First, you can download the prices on an hour by hour basis using the link below which provides hour by hour prices in TKL. But it is a pain to download the historic prices because you cannot download the prices all at once and you cannot get a URL to download the prices.
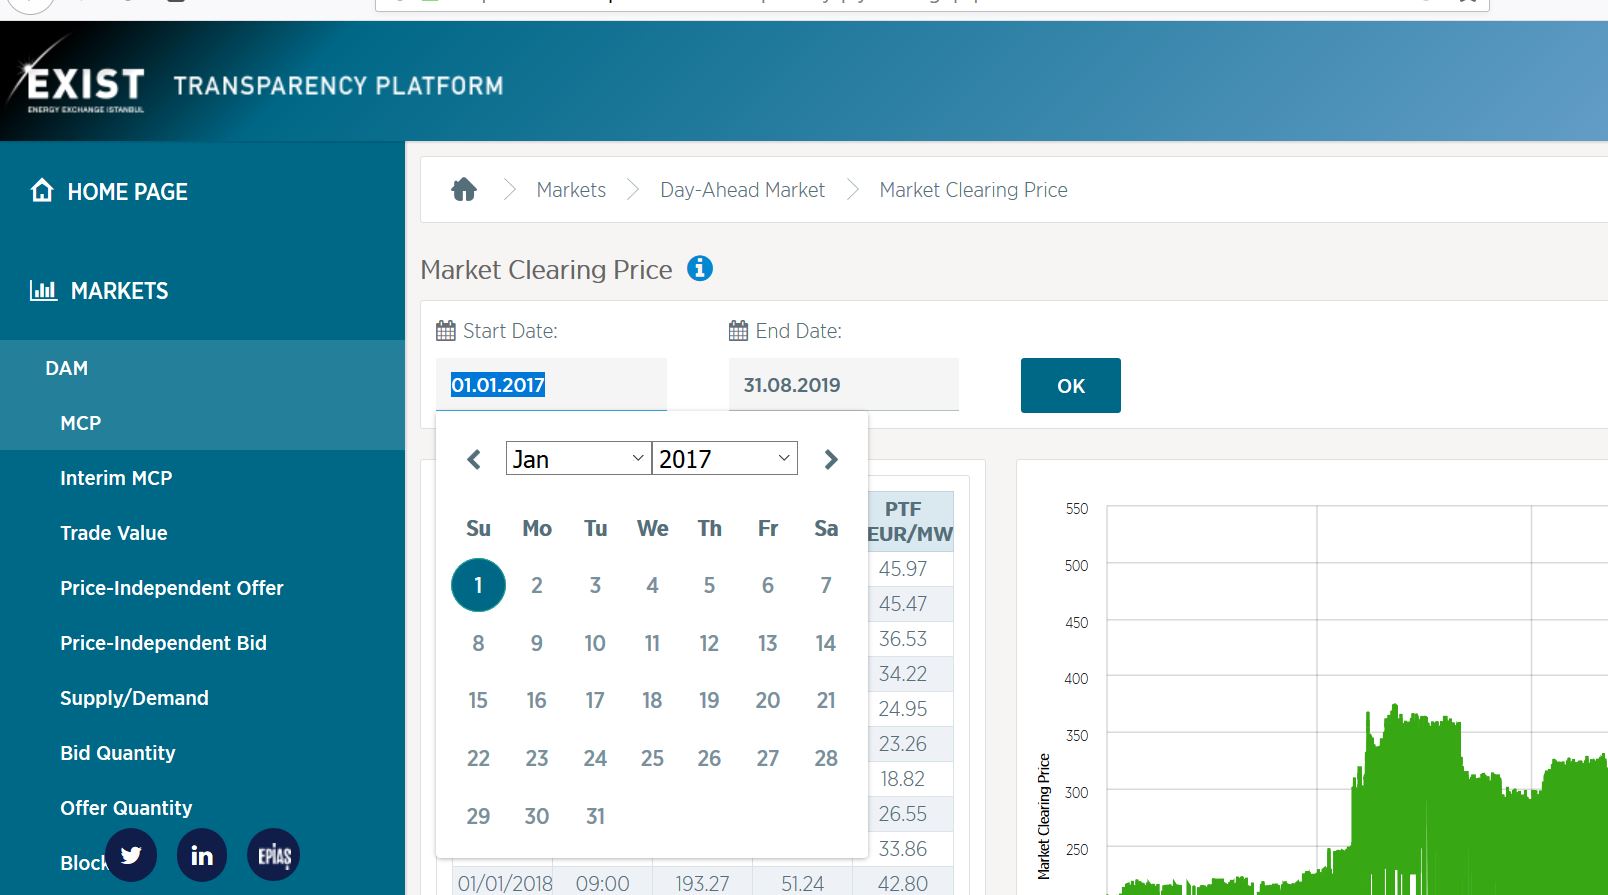
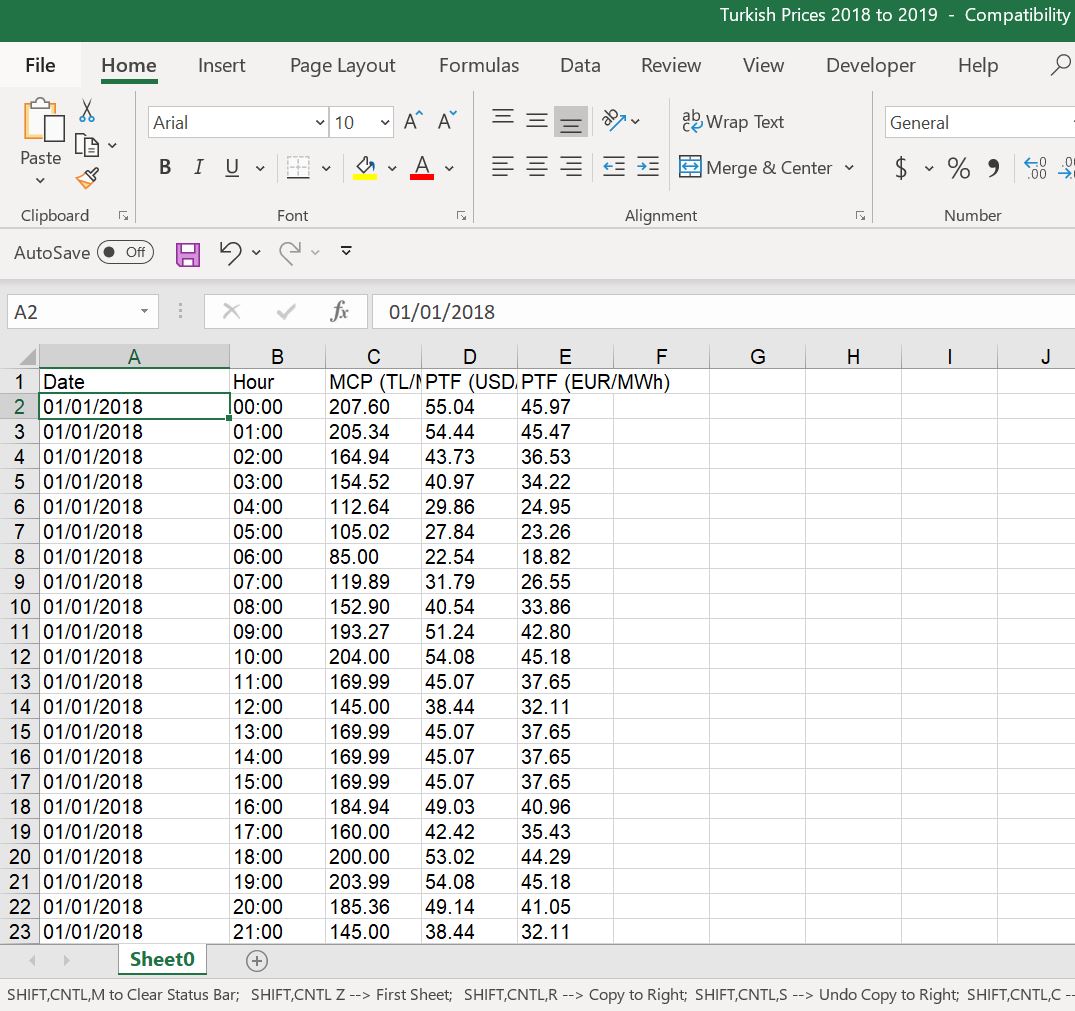
So you can go to the website and download the data by hand and put it into a spreadsheet. Then you can copy the data into a page of the spreadsheet. The process to put added data into the database is shown in the video above (which is too long and has bad sound). So, go to a page that hopefully looks something like this with MCP at the left (the link is just above the screenshot). Then you can try to change the dates and download the file to excel manually. I think you can only download a couple of years at a time (I maybe wrong about this). Make sure to click on a start date (I kept making this mistake). The second screenshot shows how you download the file to excel.
.
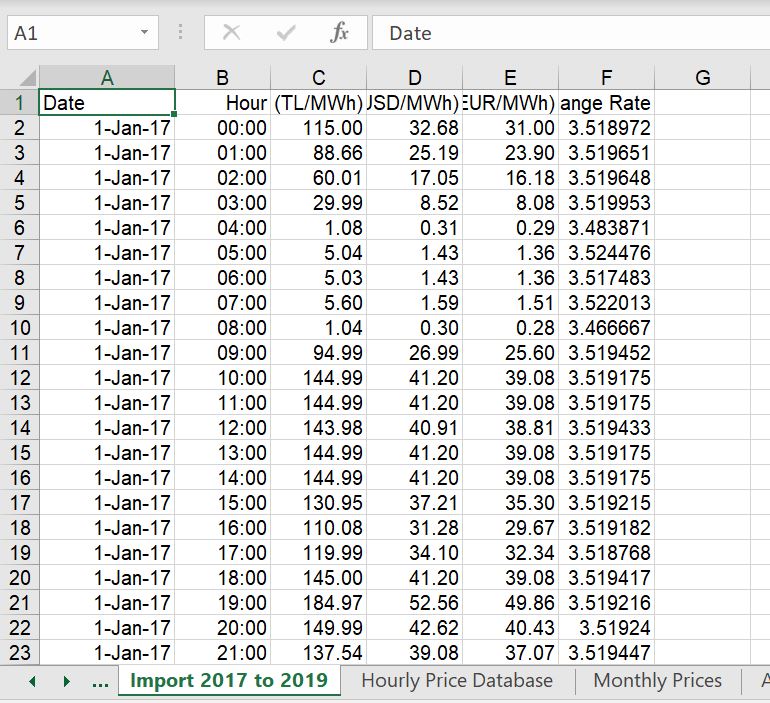
When you download the prices by hand, you should get something like what is shown in the screenshot below. This has changed now in that you can get the prices in Euro and USD as well as in TKL. In column F, I have computed the implied exchange rate (TKL/USD). Note that this is a sheet in the database and you can just add data to this sheet when you make an update.
d-mmm-yy h:mm;@
Once you gather the prices and put the new prices in the
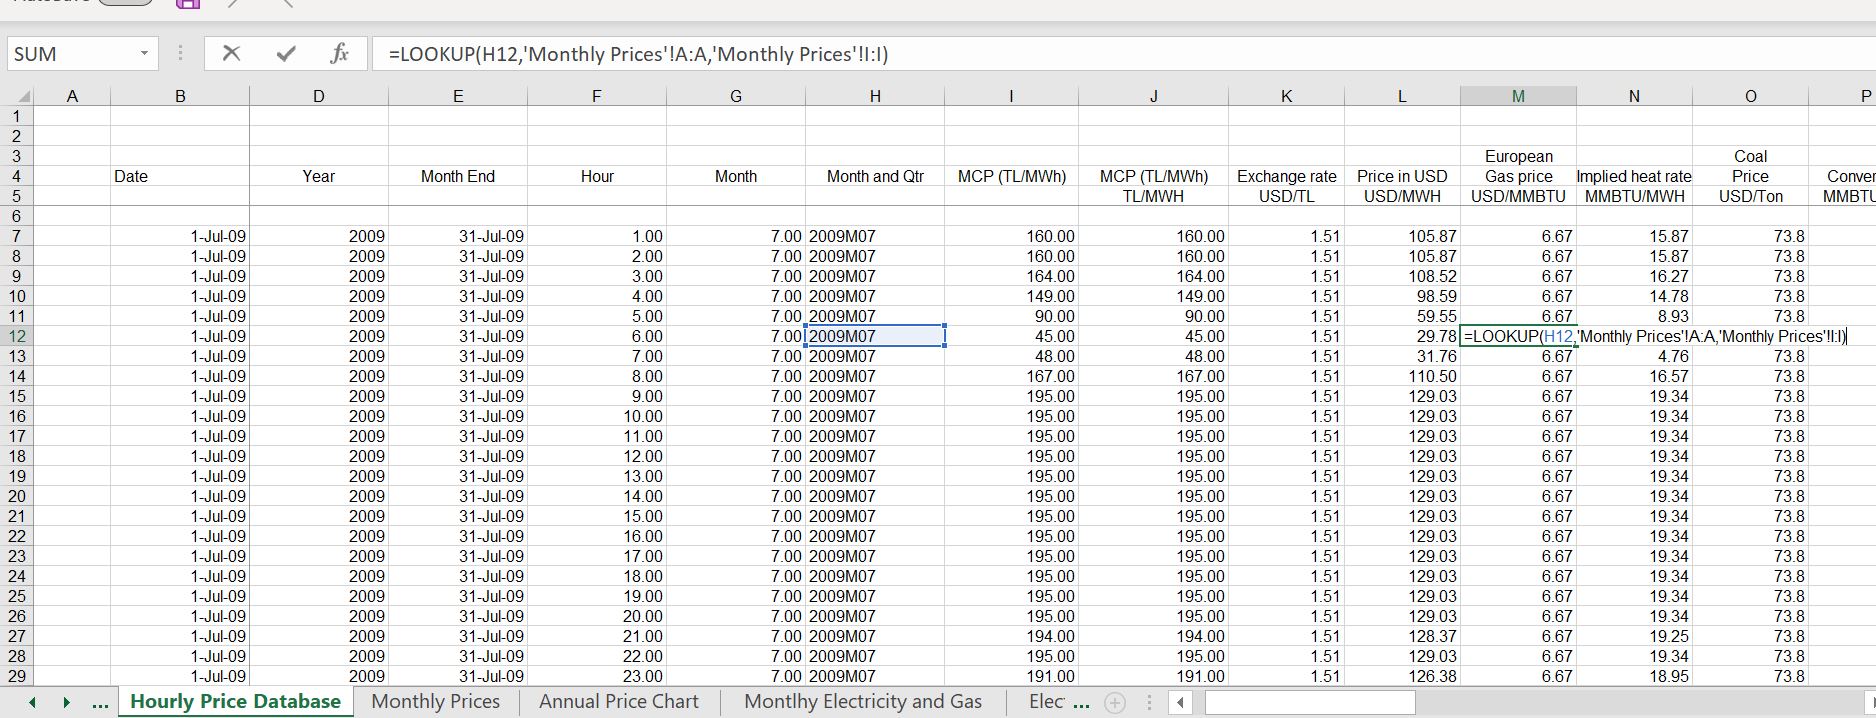
Next, adjust all the prices on this page to USD. This is another pain because recent prices are not included in the FRED database and it is a pain to find a database with comprehensive history. So, I found a database that has day by day historic data that you can put together using the WORKBOOKS.OPEN function.
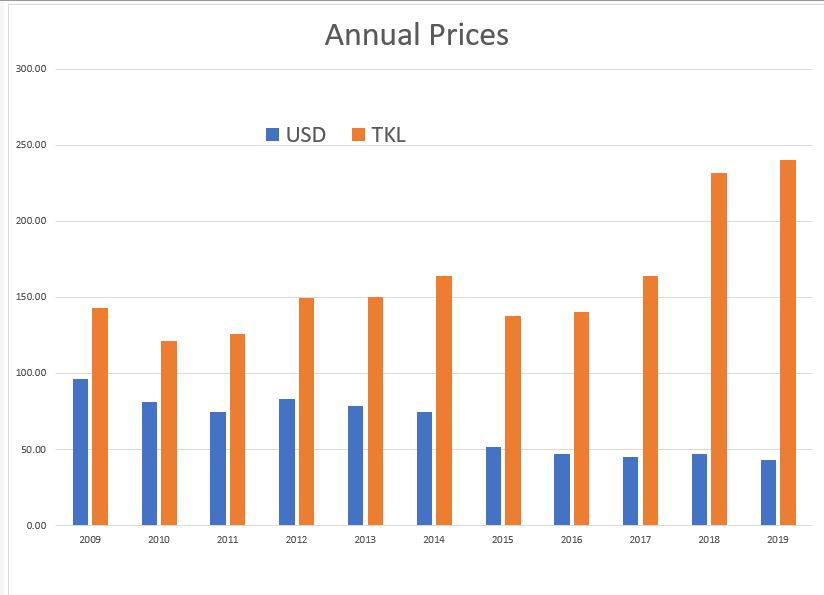
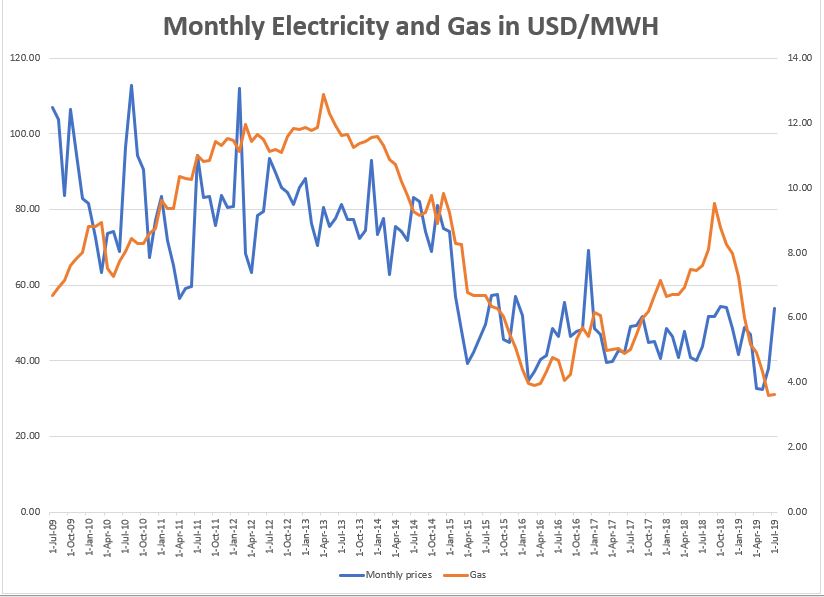
After changing to USD, the story is completely different. As such, the case demonstrates the importance of adjusting prices to a reference currency. Once the prices are changed, you can see a close correlation to natural gas prices
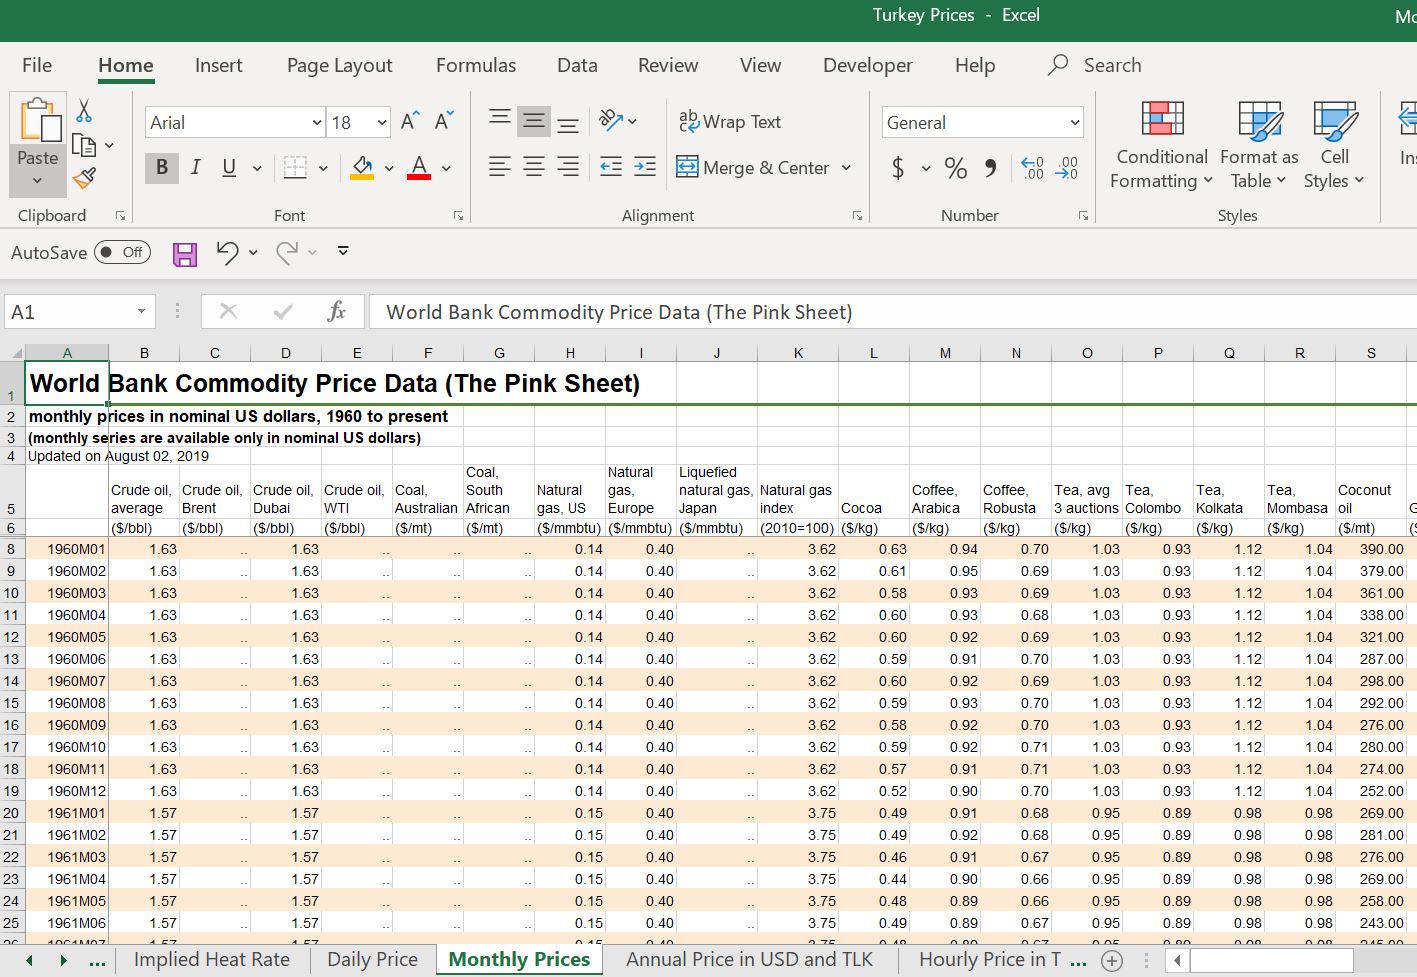
I use the European natural gas prices from PINK data published by the world bank. After you make these adjustments the story completely changes. Now the prices come down over time and you can evaluate the relationship between electricity and gas prices.
After you compile the hourly prices by downloading separate files you can use the AVERAGEIF or the MATCH and INDEX you see that the prices seem pretty stable (see the video).
To update the file, it should not take too long. You first go to the page from the link above (you can change it to English). Then you can go to the dates above the table. Make sure you click on a date as illustrated in the screenshot below. Last time I did this I could only download a couple of years at a time and not the whole database.
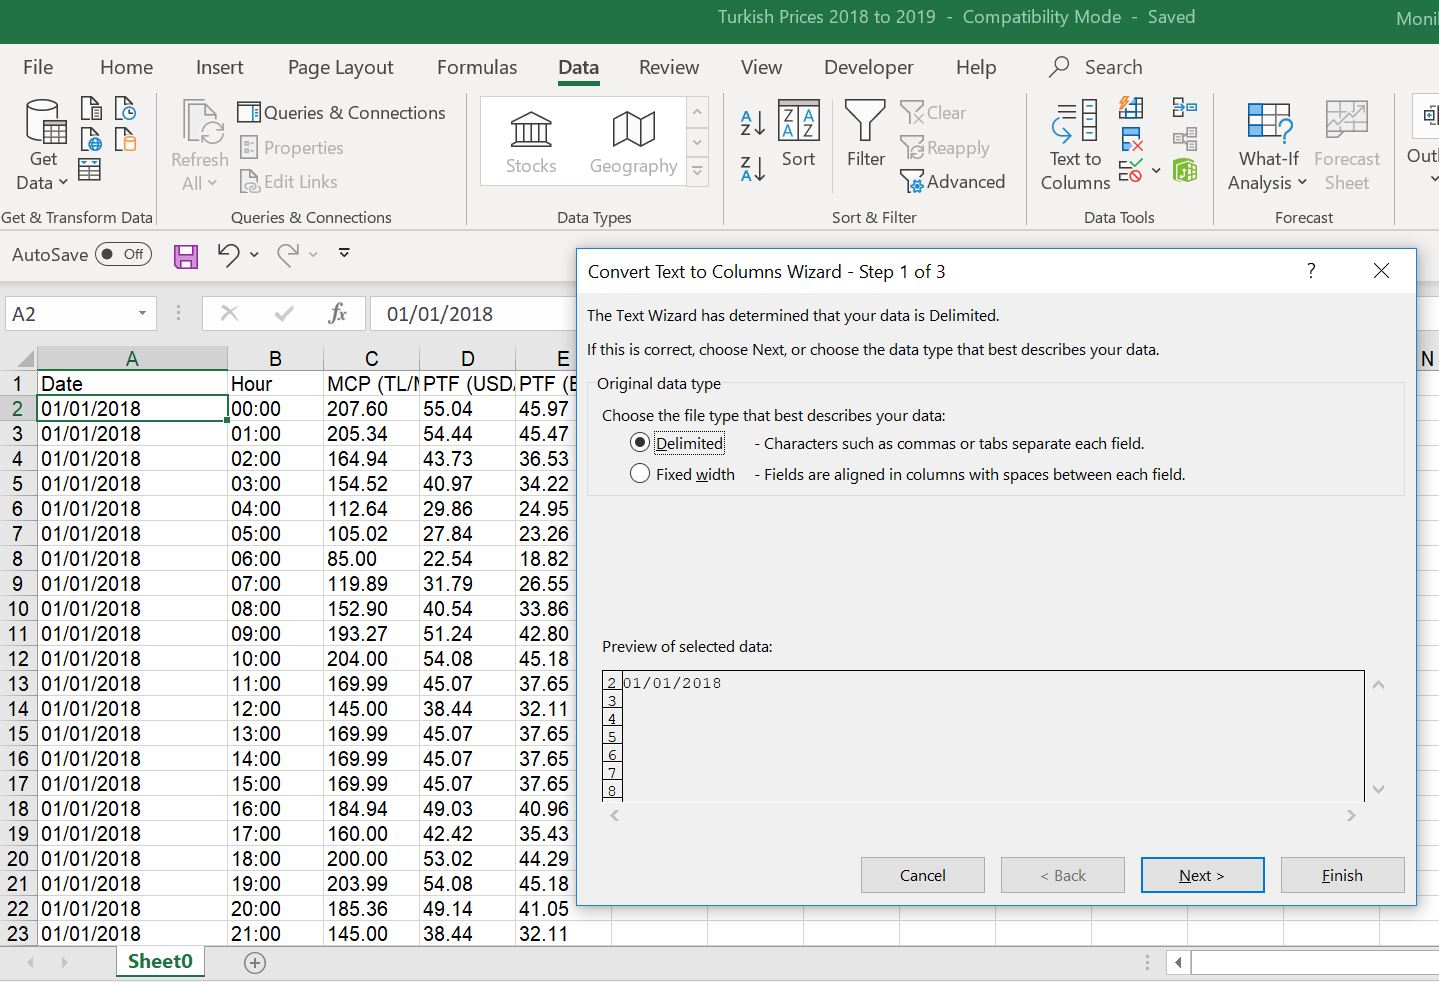
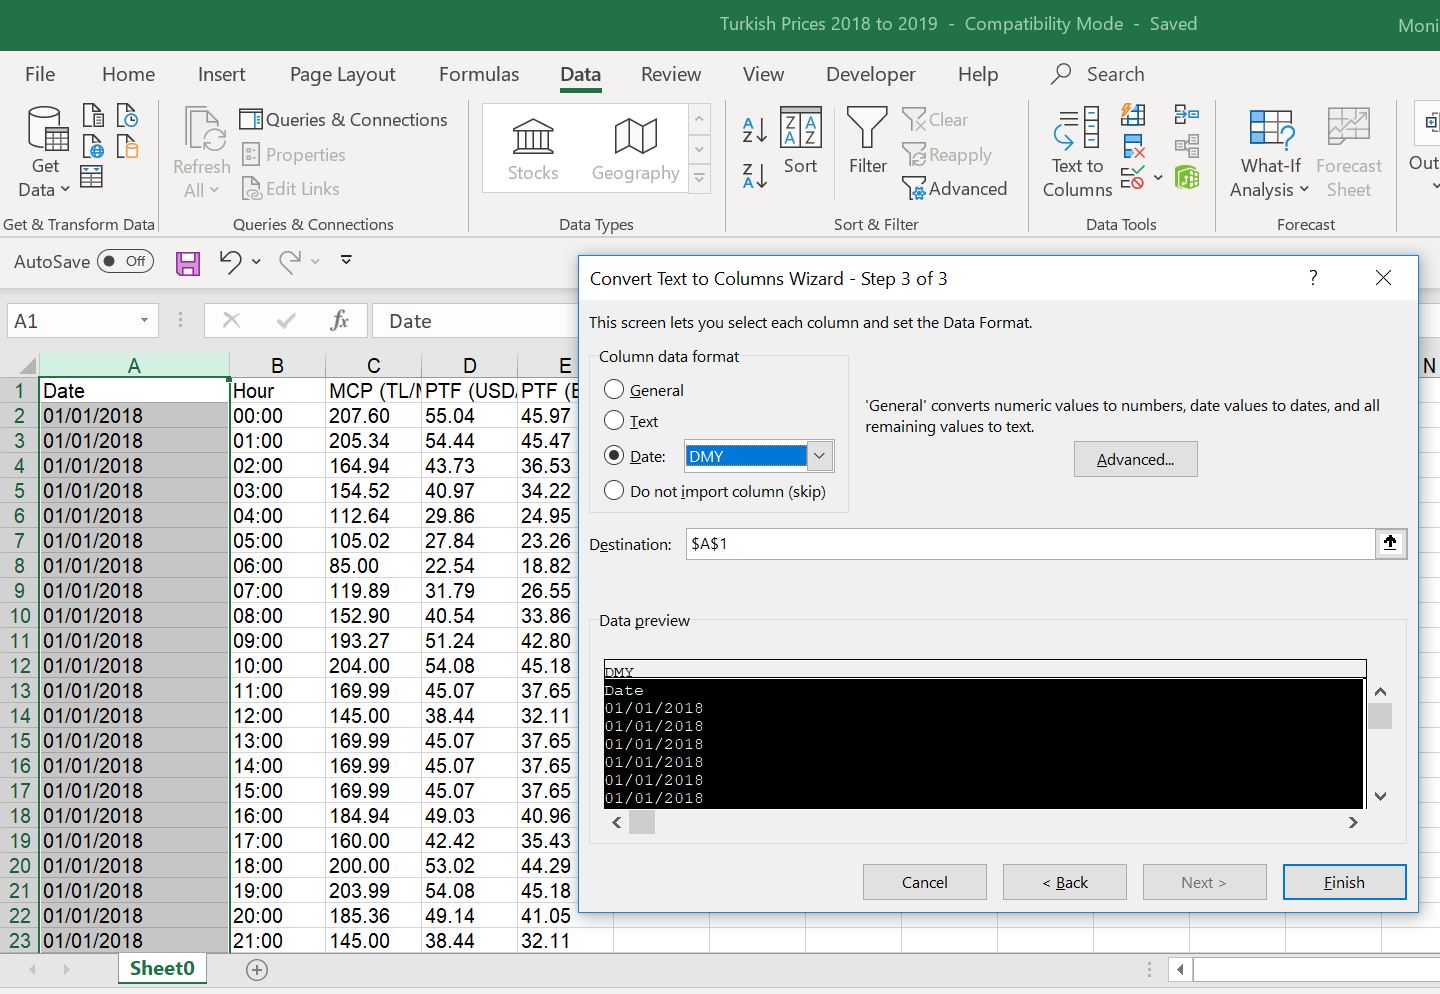
Changing the Date Format
Discussion of Turkey Merchant Price History
Prices for just about every market also tell a story and represent a case study. I looked at Turkey prices a few years ago when I was working in Armenia (there is no transmission connection). Turkey prices adjusted for both the exchange rate and for changes in gas price (through converting prices to implied heat rates and spark spreads) were much higher than Europe and other places in the world. I also ran into people making investments in Turkey who were assuming prices would remain constant or even increase. The clear question was whether these prices would continue at high levels relative to gas prices, coal prices and in absolute terms. This conversion to a common currency and examination of prices in the context of gas and coal prices is similar for all of the regions presented below.