This webpage addresses what items should be included in free cash flow and what should be included in the enterprise to equity value bridge (that is often referred to as net debt). The file below demonstrates how to evaluate whether various elements should be included or not included in the bridge between equity value and enterprise value. It deals with things like the value of derivatives and deferred taxes associated with the derivatives. The proofs develop both true cash flow and the accounting for cash flow.
Excel File that Demonstrates Proof of Various Ideas in Reconciling Equity Value and Enterprise Value
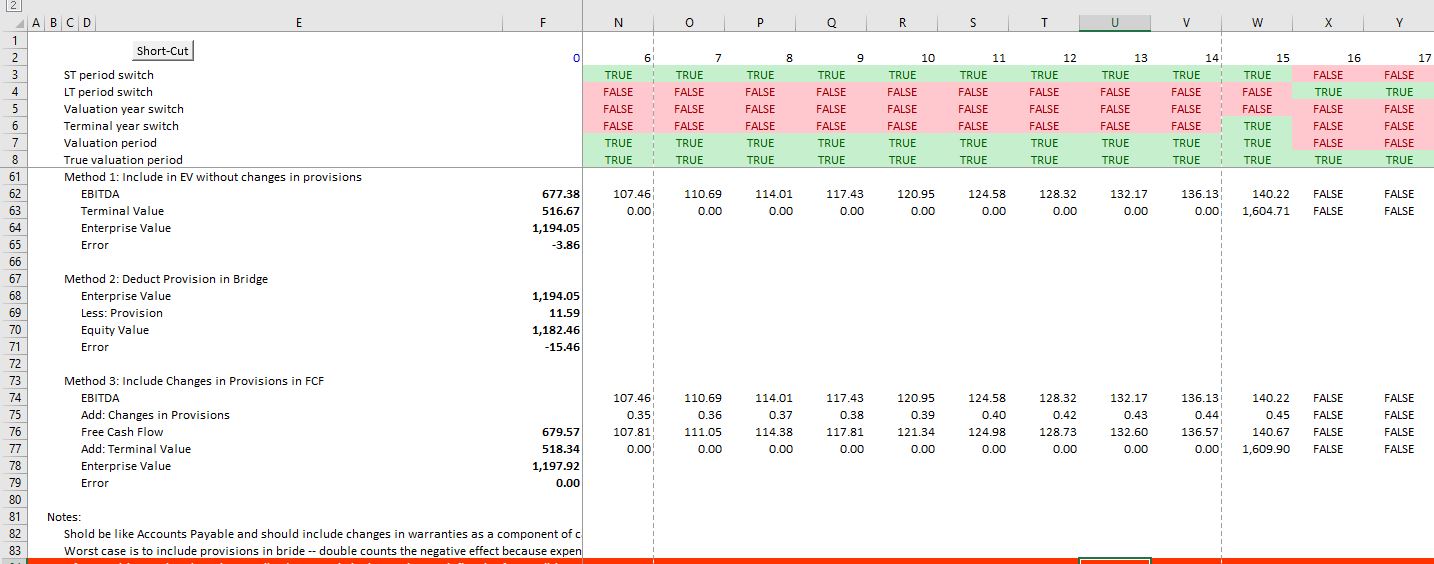
The different proofs of what should be included in free cash flow and what should be in the EV to equity bridge are summarised in the screenshot below. This screenshot is directly from the excel file above and each one of the items is associated with a separate proof. The method for establishing the proof is to set-up a long-term model and then to work through the accounting and the cash flow of the item. Then a terminal value switch is created and the terminal value with alternative assumptions for the bridge from equity value to enterprise value is tested.
In the file below, the following proofs are made:
- Proof 1: Accounts Payable: Demonstrates the A/P should not be in bridge because included in FCF; Also demonstrates process of making proof
- Proof 2: Provisions Related to Warranty Expenses; Demonstrates that should include in EV, NOT in bridge and that changes in provisions should be in Free Cash Flow
- Proof 3: Provisions Related to Dismantelling/Decommissioning: When cash flow is after explicit period INCLUDE in BRIDGE
- Proof 4: Provisions Related to Dismantelling/Decommissioning with taxes: Taxes follow the BRIDGE treatment and should include at net of tax
- Proof 5: Provisions Related to Warranty Expenses with taxes; Demonstrates that should include in EV, NOT in bridge and that changes in provisions should be in Free Cash Flow and Deferred Taxes should be in free cash flow
- Proof 6: Debt with alternative provisions; Demonstrates Clear Point that Should Include in Bridge at Market Value
- Proof 7: Debt with Constant Capital Structure; Demonstrates Clear Point that Should Include Debt in Bridge at Market Value and Can Be Used for WACC Analysis with Taxes
- Proof 8: Taxes Payable and Interest; Alternatively include the interest paid to the Govenment in EBITDA
- Proof 9: Derivatives from Interest Rate Swaps; Shows that Debt should be at book value and the value of Swap should be added
- Proof 10: Derivatives from Interest Rate Swaps with Tax; Shows that tax effect should follow the valuation and be included in bridge
- Proof 11: Income and Assets from Associates; If not in EBITDA then compute PV of After Tax Income and put in Bridge and Account for Differences in Discount Rate
- Proof 12: Futures Contract Associated with Operations; take the derivative gains and losses out of EBITDA
- Proof 13: Deferred Taxes from Capital Expenditures and other Operating Items; Include in Free Cah Flow and do not include in Bridge
- Proof 14: Deferred Taxes from NOL; Treatment Depends on the length of the holding period

Illustration of How to Set-up Proofs with Accounts Payable
We all know that working capital changes should be included in free cash flow and not in the net debt. But somebody may ask why accounts payable should be treated differently from other debt. The real reason is that accounts payable which involves delaying payment to employees and suppliers in theory reduces EBITDA a bit. If you would pay faster, the suppliers and employees should in theory lower their price which would increase EBITDA.


Warranty Payments (Deferred Credits)
Warranty payments are a lot like accounts payable. It is accurate to include changes as a positive cash flow item and not include anything in the bridge between equity value and enterprise value.


Decommissioning Accruals
The case of decommissioning becomes more ambiguous.
In a similar manner as a high project IRR can be a danger sign of pending over-capacity in project finance, a high ROIC may suggest that companies will try and enter the industry and increase supply. While evaluating ROIC is important in corporate analysis, the statistic must be adjusted for goodwill write-offs, restructuring charges, impairments and other accounting items. Risk assessment in corporate finance involves judging how EBITDA can change due to factors such as technical obsolescence, changes in consumer tastes, changes in cost structure, and a host of factors including industry demand and supply that can create oversupply in an industry. Rigorous analysis of potential changes in EBITDA are hardly ever dealt with in finance texts. Assessments of business risk that is driven by volatility in EBITDA are treated using opaque and confusing jargon by credit rating agencies such as Standard and Poor’s.
Using multiples such as the P/E ratio and the EV/EBITDA ratio in valuation can be result in biases without understanding how the multiples are affected by assumptions with respect to long-term growth and long-term earnings potential. The EV/EBITDA ratio is strongly affected by the lifetime of assets used in the business and the necessity to replace capital expenditures.
This file is a corporate model for a chicken producer with returns that are affected by changing politics. It demonstrates how you can develop stable ratios and normlised cash flow. It includes stable ratio of capital expenditures and other issues as well as stable ROIC.
Calculation of the Bridge Between Enterprise Value and Equity Value (otherwise known as Net Debt) including Fair Valuation of Derivatives, Operating Reserves, Deferred Tax Allocations, and Adjustments to WACC
The first file demonstrates that when the target capital structure does not equal the current capital structure, discounting free cash flows at the WACC (which does not change in theory when the capital structure changes) gives the same answer as computing a new cost of equity with changing capital structure.