One of the real world challenges in creating a financial model is to acquire historic financial statement and accounting data in an efficient and flexible manner. I believe it is is instructive to put together as many historic years as possible to evaluate trends, volatility of returns and develop downside cases in corporate models. So, in describing how to set-up a financial model I begin with description of how to retrieve data in a from a practical standpoint. There are a few ways to get historic data these days. One way is to go the an internet site like marketwatch.com and put together the data. If the company you are evaluating must register with the U.S. securities and exchange commission, you can get data back through 1994. If the company trades on U.S. exchanges, you can get nice data from Marketwatch. In some countries like India there are even better websites. In other cases you may have to get data from annual reports. This page describes alternative ways to manage the painful process of acquiring data. I begin by discussing how to bring in data from PDF files and then discuss how to efficiently extract data from the internet. You can download files the are used in the discussion on this page by clicking on the buttons below.
Reading Data from Annual Reports in PDF Format
This section reviews how can use how to use the read pdf program to acquire data for corporate modelling. I explain why I created these files and suggestions on how to think about various items in the financial data. Before I developed the read pdf file or the financial database file, I used to try to create a relevant a case example for companies in my classes. I would get pdf files with financial reports and then struggle with pdf files trying to retrieve the data. This really sucked. It would take hours and hours. That is why I started to develop the read pdf file. So the next couple of paragraphs walk you through acquiring data from PDF files and putting together many years of data in a consistent format. In addition to acquiring data from PDF files, the lesson set demonstrates how to acquire data from companies that make filings to the Securities and Exchange Commission in the U.S. You can receive credit for this lesson set simply by sending in a completed set of historical financial statements along with the original source of the data. If you do this and send me the files I will put your name on the page of the website that lists the star financial analysts who have completed a lesson. Here are the steps for getting a nice set of financial statements put together:
1. Find the financial statements and get them with Chrome (it works better than Firefox)
2. Copy the data into excel and arrange statements together (e.g. all income statements in first set of sheets, followed by balance sheet etc.)
3. Use the Read PDF excel file to format the financial statements.
4. Put all of the statements together — put all income statements in one file; balance sheets in second file etc.
5. Get the UNION function and the INDMAT function into your file from the Read PDF file.
6. Arrange sections of each statement with a few lines and have a lot of blanks. eg. operating section of income statement, current assets of balance sheet.
7. Use the UNION function to put together a common set of titles.
8. Use the INDMAT function to put together data for different years with common titles.
9. Copy and paste as values in new file for analysis.
You can try and read data using the file below. The financial statements begin about page 72 or so on the pdf pages. You can use SHIFT, CNTL, N to find the page.
Videos on Reading Financial Statements
Videos with this lesson set are boring and have some sound quality problems and I admit this, sorry. I have left them on the website anyway. Perhaps the idea of reading in financial statements from PDF files and from the SEC is not really interesting. However, efficient use of: (1) the READ PDF file to get data from the PDF’s on the internet and get the data as quickly as possible into excel is a very practical issue; (2) putting financial statements together from different years when the titles change is a very real world pain and is solved with the important UNION function; (3) quickly arranging the data itself after putting together the titles with the UNION function is very helpful and is accomplished with the INDMAT function. These three things are all made possible with functions and macros that are included in the READ PDF file.
Even with all of these tools, putting together financial statements is a pain. But it is a very real problem and anything to help this problem is I think useful. If you go through the videos and then try an example I think you can really improve your efficiency. The first two videos below explain how to use the read pdf excel file. It covers the subject of downloading data from financial reports using alternative sources.
[wonderplugin_video iframe=”https://www.youtube.com/watch?v=fPcC8gbQIKA” videowidth=600 videoheight=400 keepaspectratio=1 videocss=”position:relative;display:block;background-color:#000;overflow:hidden;max-width:100%;margin:0 auto;” playbutton=”https://edbodmer.com/wp-content/plugins/wonderplugin-video-embed/engine/playvideo-64-64-0.png”]
.
[youtube][wonderplugin_video iframe=”https://www.youtube.com/watch?v=TauokBNVwG4″ videowidth=600 videoheight=400 keepaspectratio=1 videocss=”position:relative;display:block;background-color:#000;overflow:hidden;max-width:100%;margin:0 auto;” playbutton=”https://edbodmer.com/wp-content/plugins/wonderplugin-video-embed/engine/playvideo-64-64-0.png”]
The third video discusses how to move the data around and put different financial statements together. This is done with the ALT, E, M short-cut.
[wonderplugin_video iframe=”https://www.youtube.com/watch?v=RT0QpDF1bkI” videowidth=600 videoheight=400 keepaspectratio=1 videocss=”position:relative;display:block;background-color:#000;overflow:hidden;max-width:100%;margin:0 auto;” playbutton=”https://edbodmer.com/wp-content/plugins/wonderplugin-video-embed/engine/playvideo-64-64-0.png”]
If you are going to put financial statements together using the read_pdf file, there are inevitably changes in the format of the income statement, balance sheet and cash flow from year to year. It is a real pain to arrange the data in an easy manner without the horror of moving things around manually in excel. To solve this problem of different titles, I have created a union function that is intended to create long list of accounts. After you have created the accounts, you can use the match and index with the long list and the individual accounts to create a common format. This is the technique presented in the video.
The union function is a UDF. you can find the UNION function in the file named read_pdf
[wonderplugin_video iframe=”https://www.youtube.com/watch?v=RT0QpDF1bkI” videowidth=600 videoheight=400 keepaspectratio=1 videocss=”position:relative;display:block;background-color:#000;overflow:hidden;max-width:100%;margin:0 auto;” playbutton=”https://edbodmer.com/wp-content/plugins/wonderplugin-video-embed/engine/playvideo-64-64-0.png”]
The final two videos in this set address cleaning up and graphing the data after you have put it together with the UNION udf. The first video demonstrates how to put the financials together in a structured manner and the second video shows how to use the INDEX function to make flexible graphs with financial data.
[wonderplugin_video iframe=”https://www.youtube.com/watch?v=RT0QpDF1bkI” videowidth=600 videoheight=400 keepaspectratio=1 videocss=”position:relative;display:block;background-color:#000;overflow:hidden;max-width:100%;margin:0 auto;” playbutton=”https://edbodmer.com/wp-content/plugins/wonderplugin-video-embed/engine/playvideo-64-64-0.png”]
Extracting Data from the Internet – Modifying the Financial Download Database
A participant in one of my courses from Switzerland told me he uses Market Watch and wanted an automatic way to download and update the data so he could automatically create financial models. I promised him I would do this. After about five years, I finally understood what he meant and worked on extracting historical financial statements from the internet. I am using companies in India to illustrate the process.
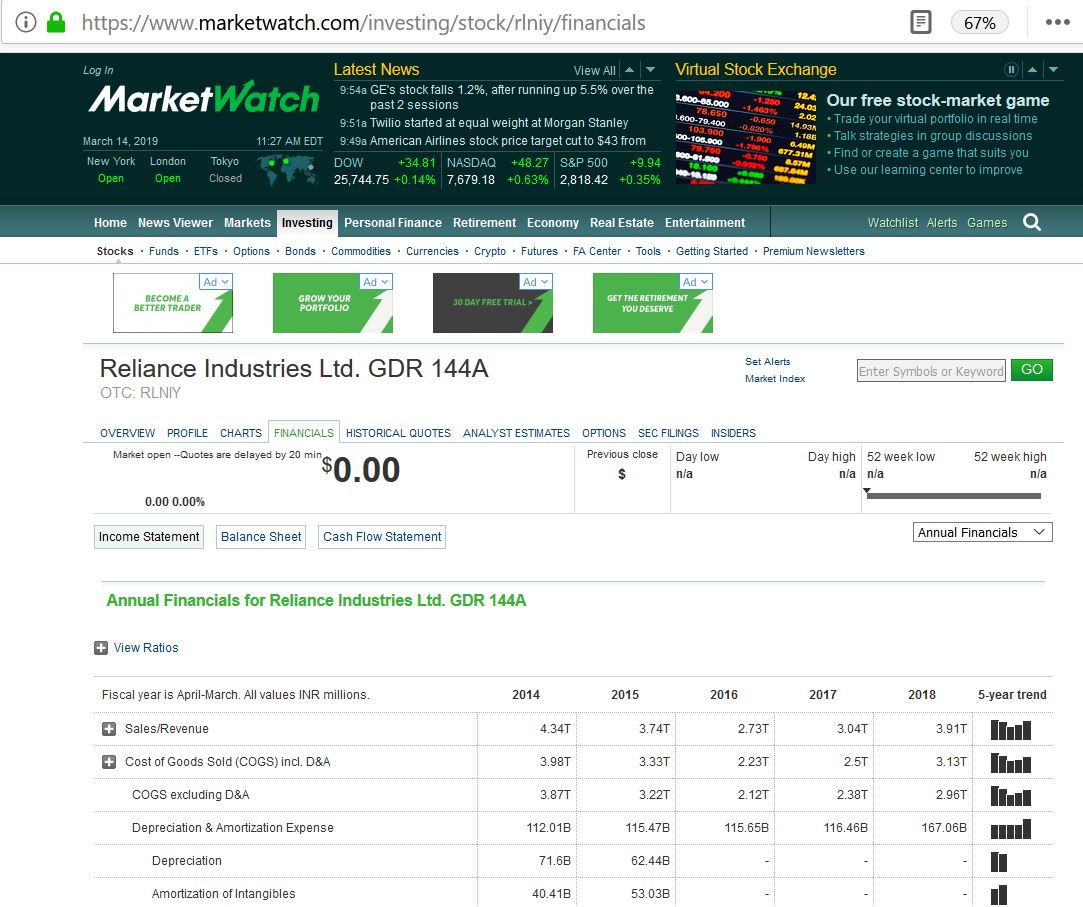
To operate the database that comes from the automatic database need to find a website that allows you to access their data in excel. In our case for Indian companies, any company with an ADR stock has detailed financials published in MarketWatch. You need to go and find the ticker symbols so that you read in the financial data. What I do is simply to go to google and put in the company name along with MarketWatch. Note in the screenshot below the symbol is rlniy in the url which is the same name as on the page. It takes a little while, but I suggest making sure the MarketWatch has financial statements as for some companies there is a Market Watch page, but no financials.
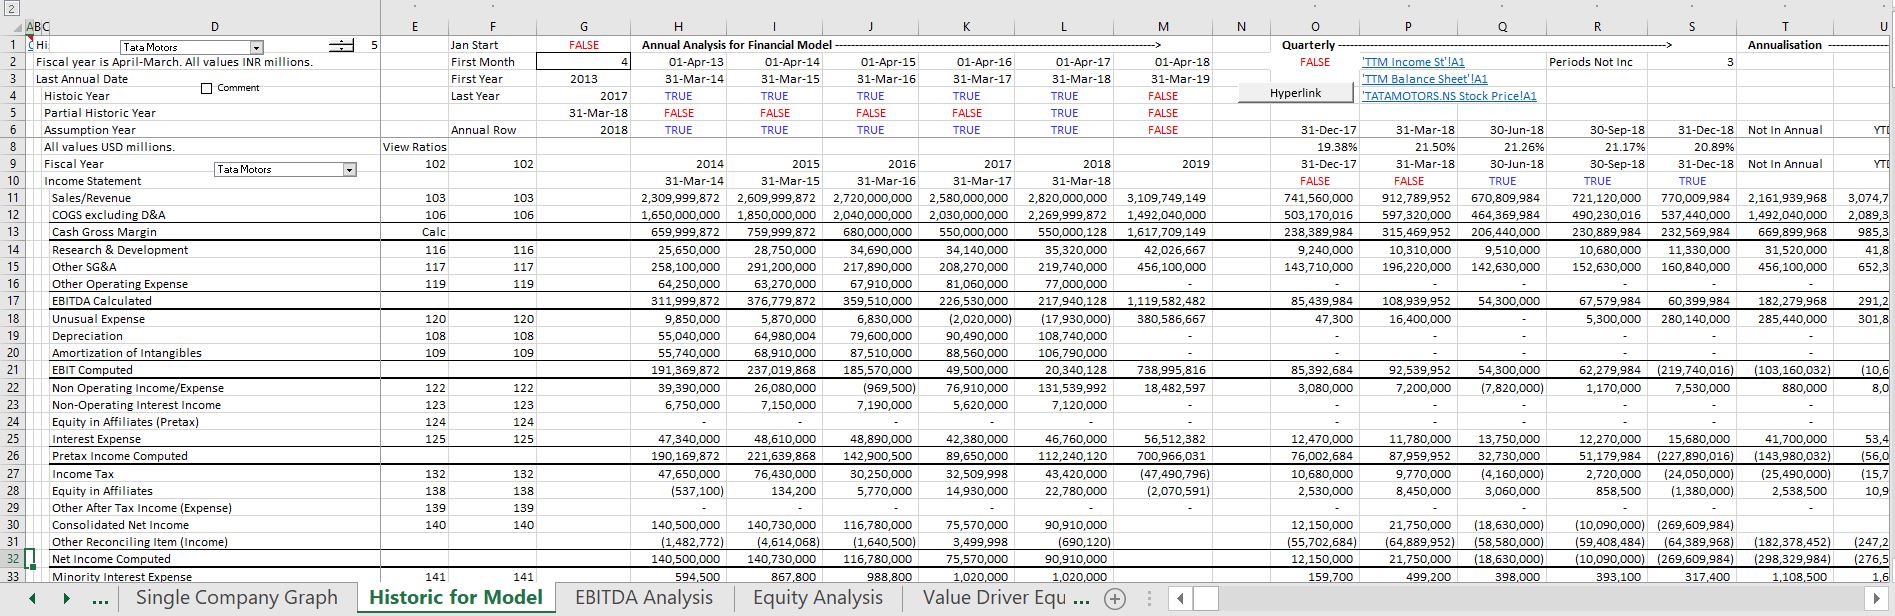
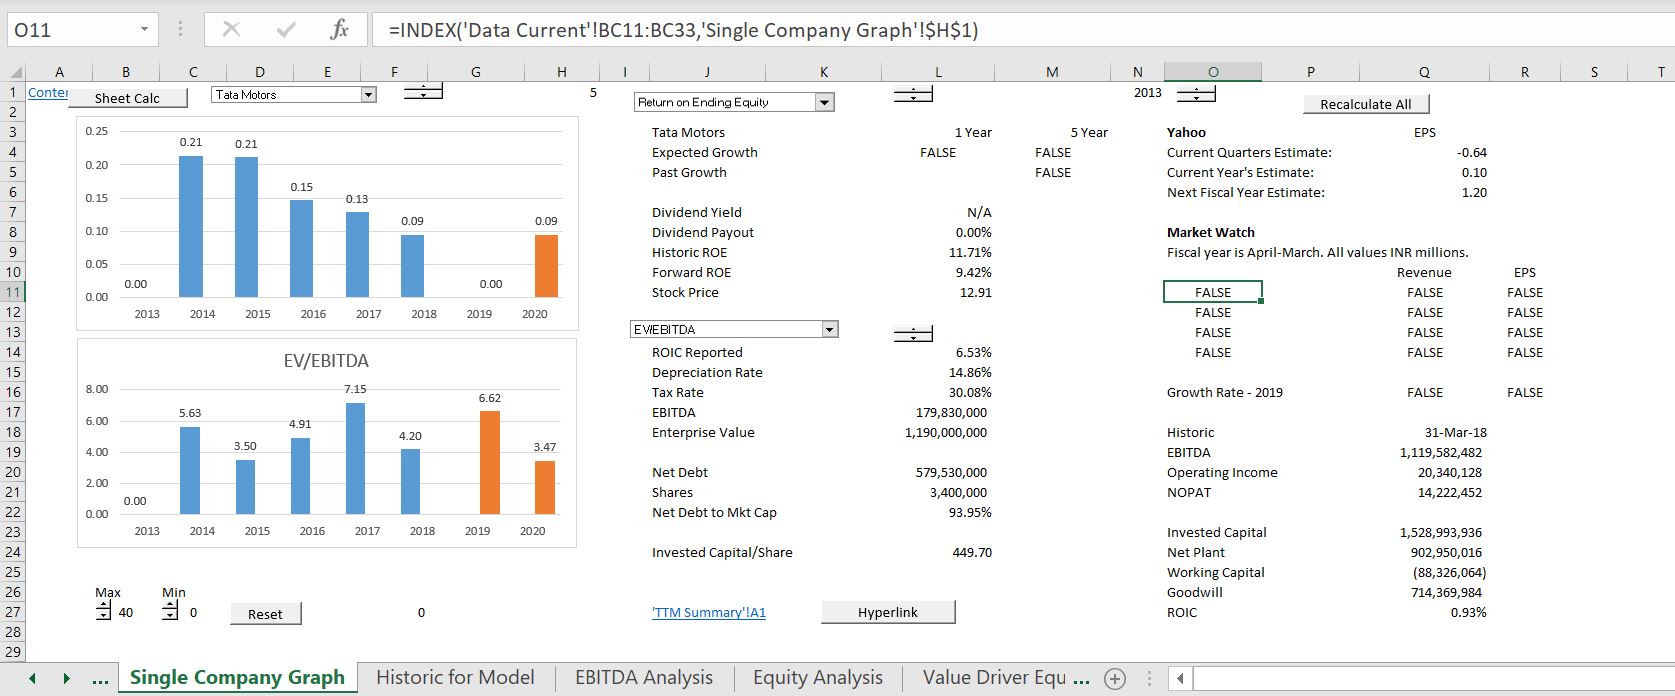
Here is some of the stuff you can get if you make an excel program that extracts the data. The first screenshot shows how you can get all of the financial data that is necessary to begin a financial model. The case of Tata Motors is used to illustrate that you can get data in different countries. The first screenshots illustrate some comparison financial ratios.
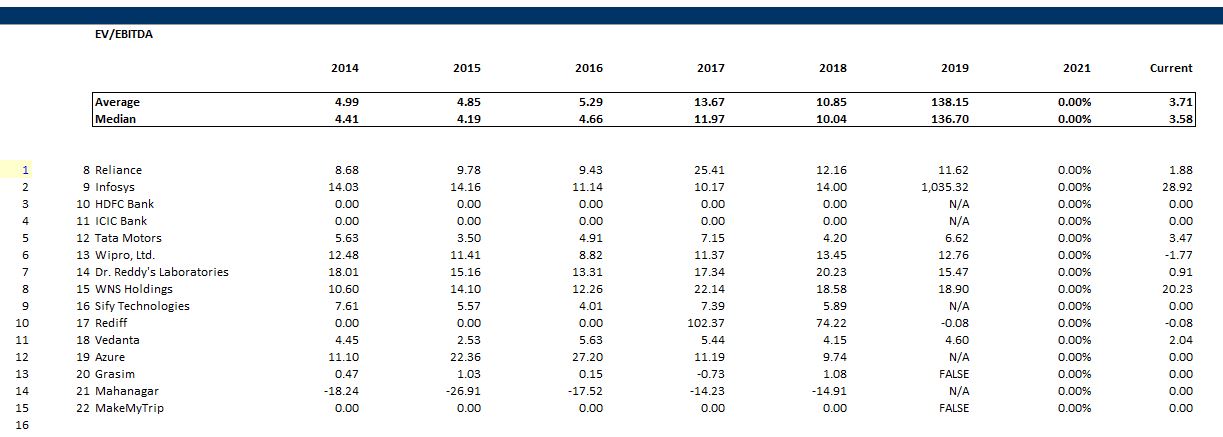
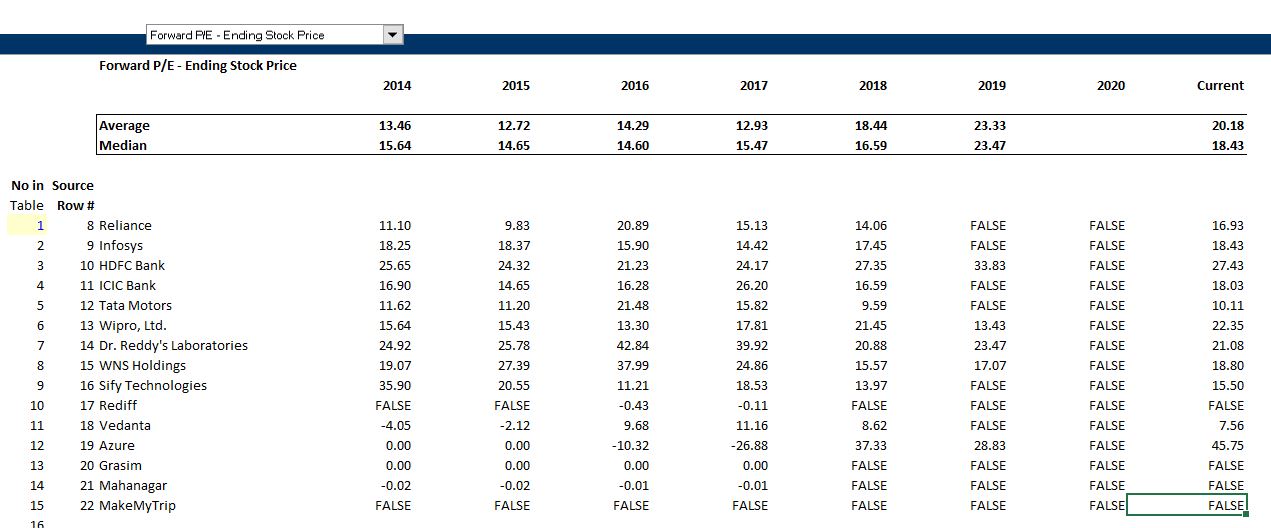
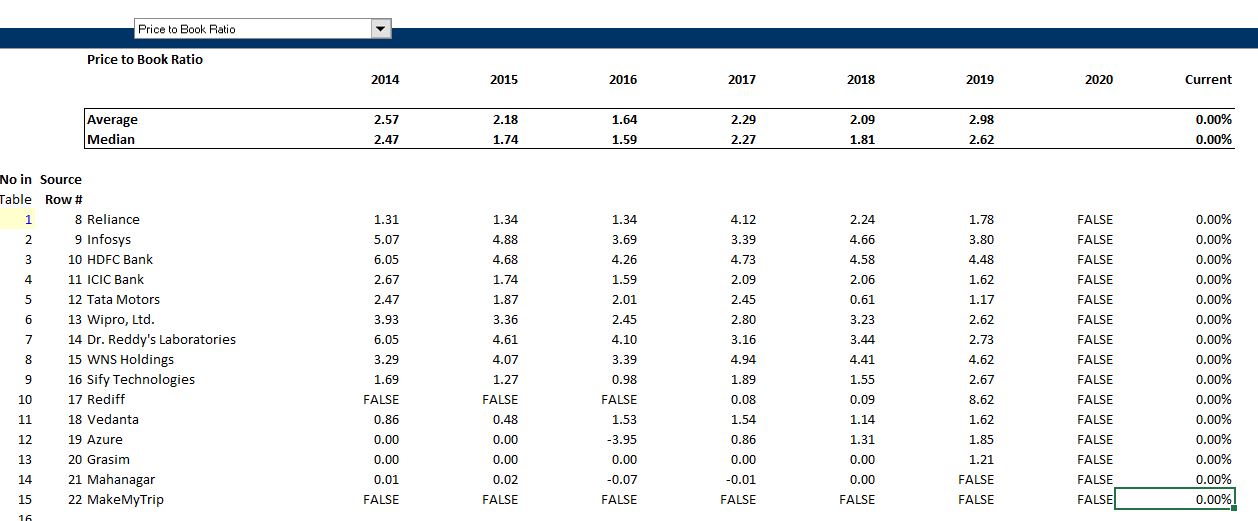
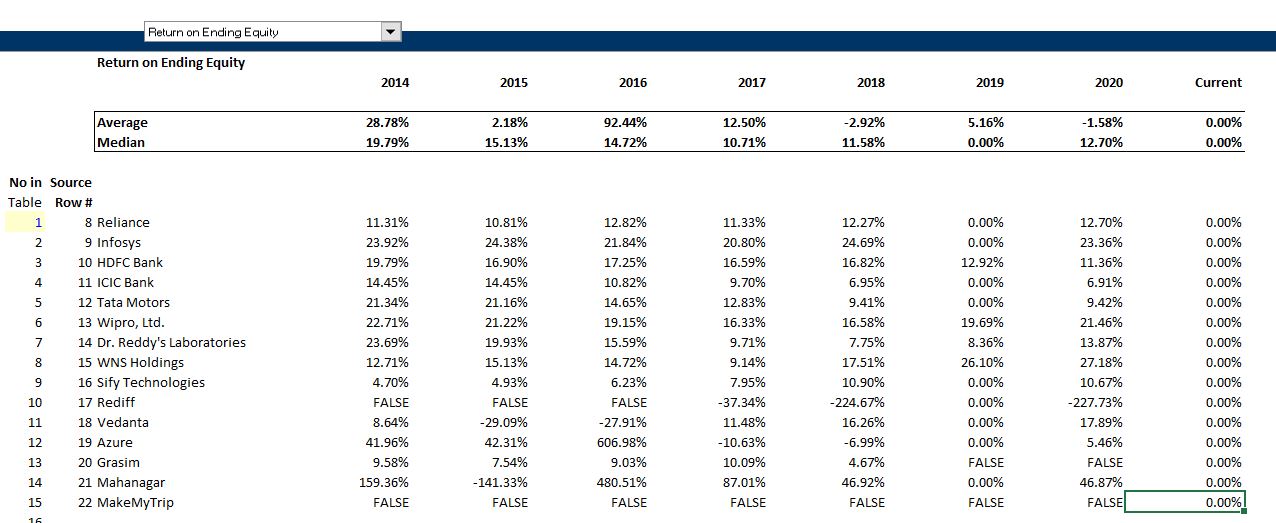
The next few screenshots illustrate how you can evaluate various different selected ratios for valuation assessment and for getting ready to make a financial model. The screenshot below illustrates the financial data you can extract for each company that you have entered ticker symbols.
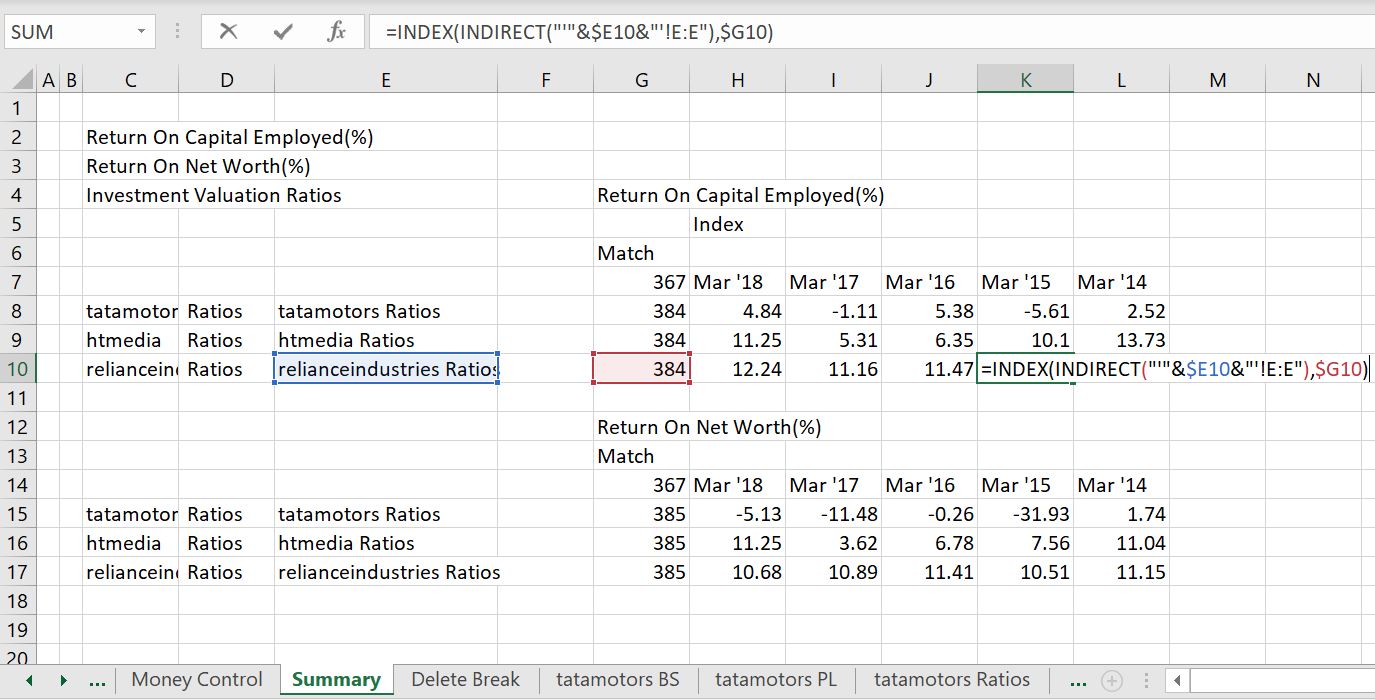
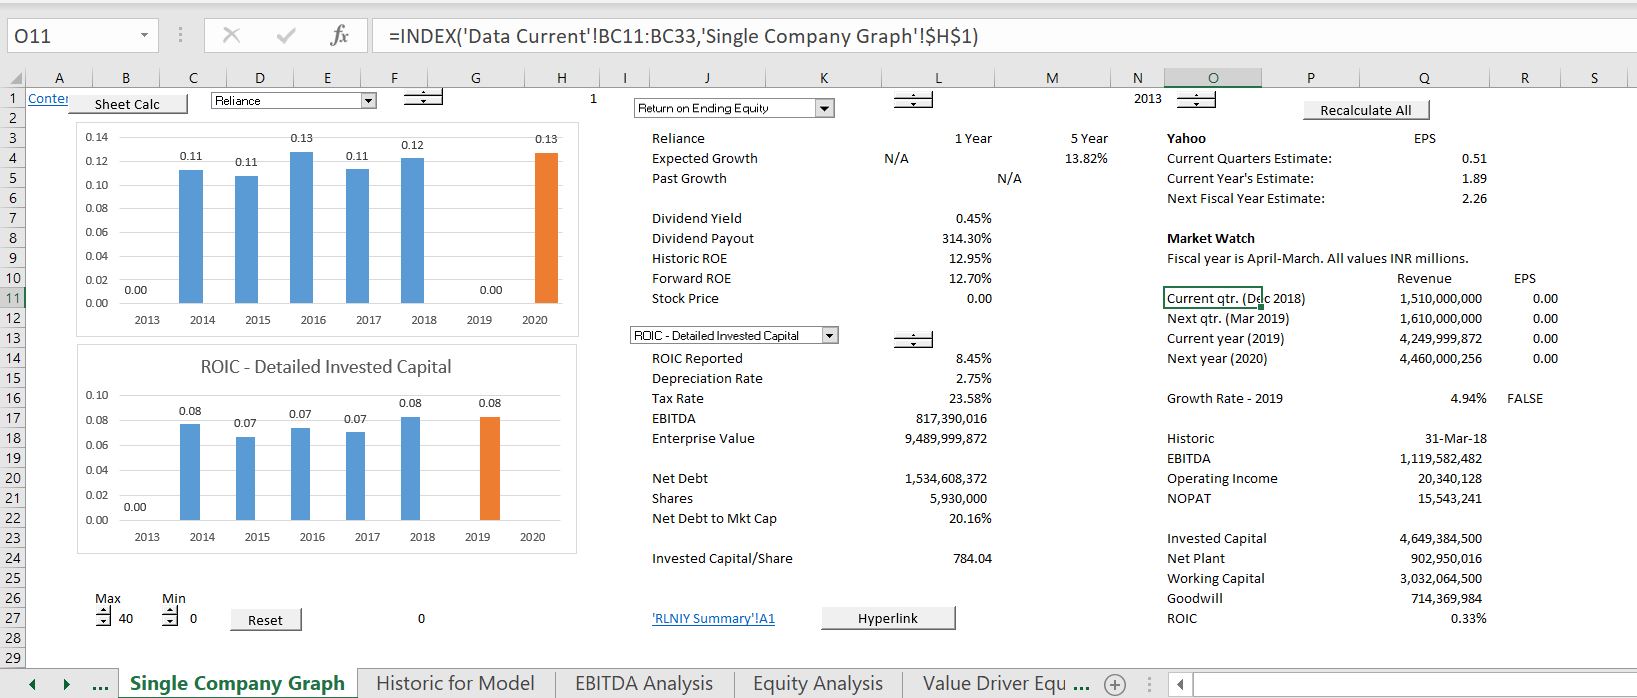
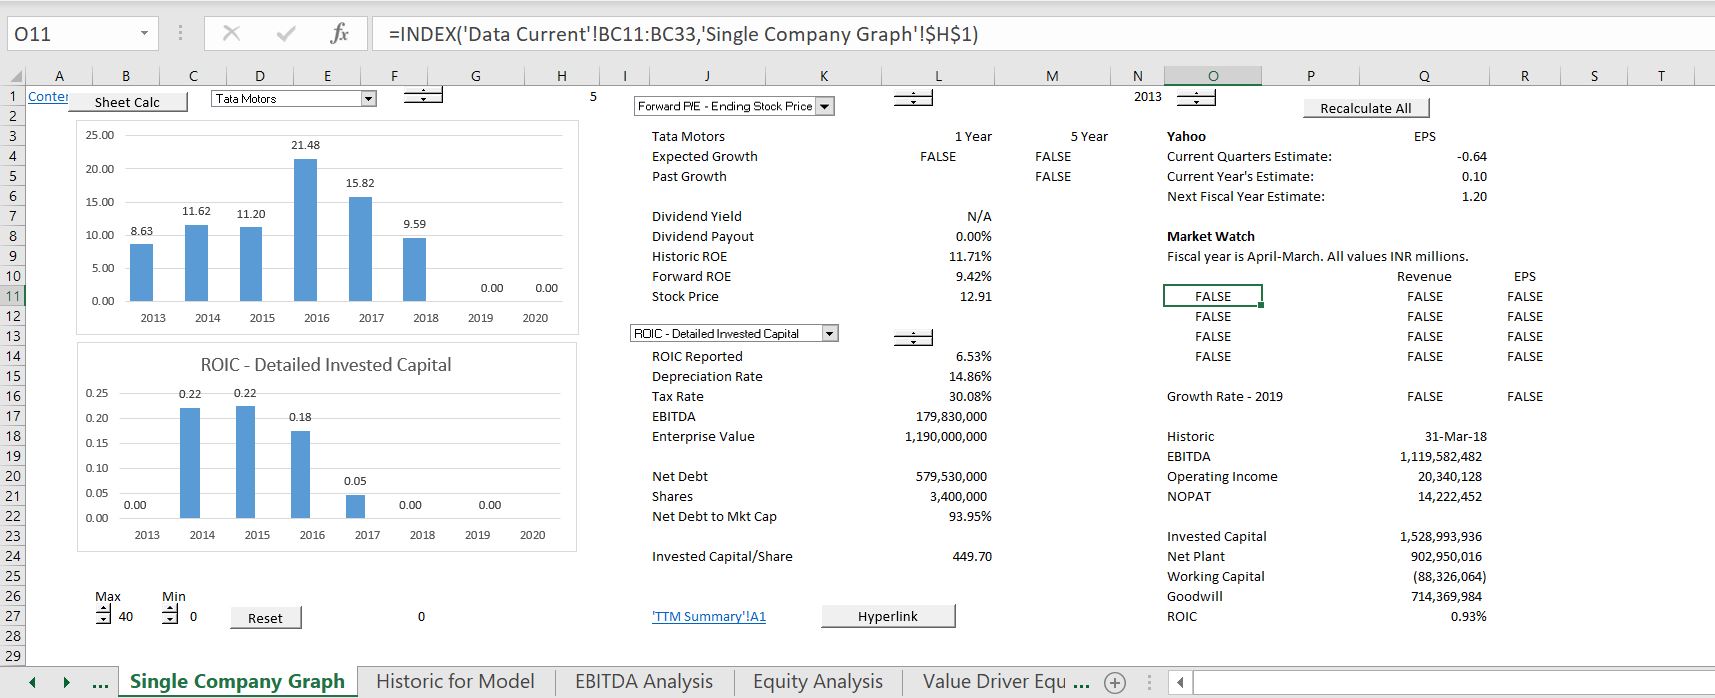
As you have collected data in a standard format from MarketWatch, you can use various techniques to evaluate various financial ratios. The first screenshot shows the ROE and ROIC for Reliance Industries while the subsequent screennshot illustrates results for Tata Motors.
Finding Ticker Symbols
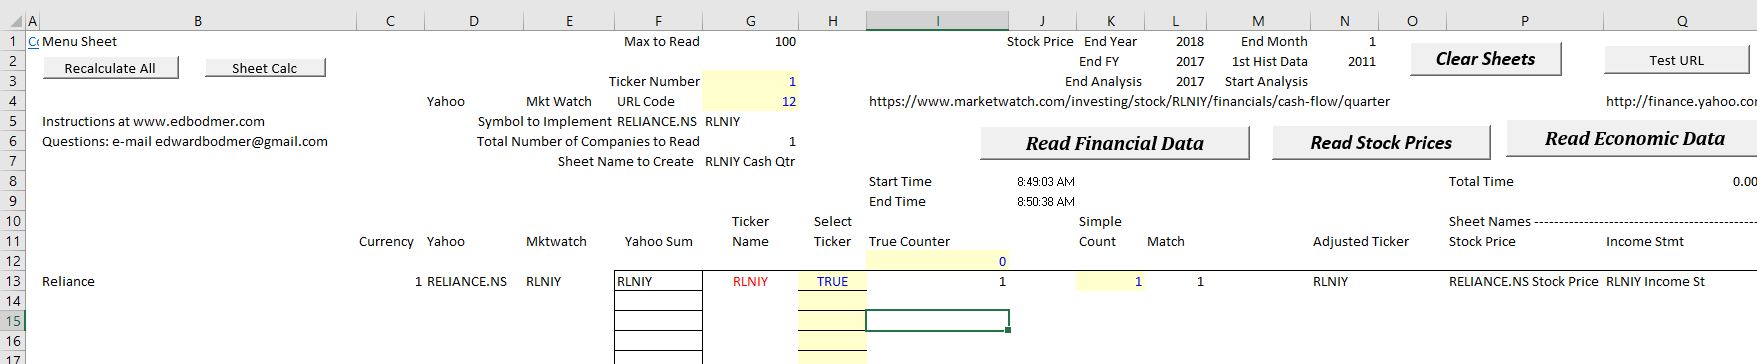
Once you have done the difficult job of getting the tickers, you stick the tickers into the database file and then start retrieving the data. As both annual data and quarterly data is downloaded for all of the companies, there can be a massive amount of data and cause little problems with excel. You can also make some mistakes like I do (for example not continuing to count the numbers in the yellow column). In this case you can just continue the reading of the financial data which takes much longer than anything else. The screenshot below illustrates the list of ticker symbols for the India case study after the painful process of finding the ticker symbols. To make this yourself you need to get the URL’s as shown below.
A-Z Exercise in Extracting and Summarising Financial Data
I have kept trying to explain the benefits of using the WORKBOOKS.OPEN statement in a macro combined with the INDIRECT function to summarise data. The next few paragraphs and screenshots walk through how to retrieve data from an Indian website name moneycontrol. The first step is getting URLS for a few different companies and different reports as demonstrated below. Note that each of the URL’s has the name of the company and also an abbreviation for the company.
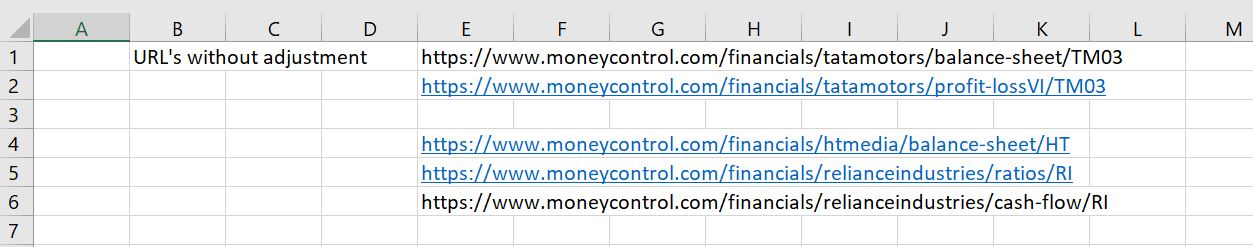
After finding the URL’s, you can split-up the URL’s so they can be re-combined with different ticker symbols that you collect. You can see that the URL’s have a consistent format and you can use the INDEX function to put URL’s back together with a long list of different ticker symbols.
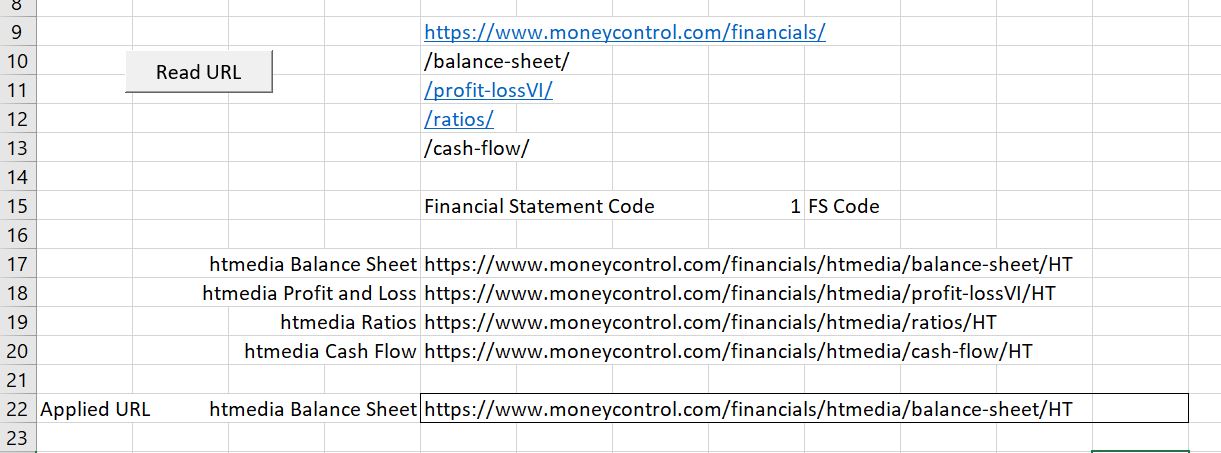
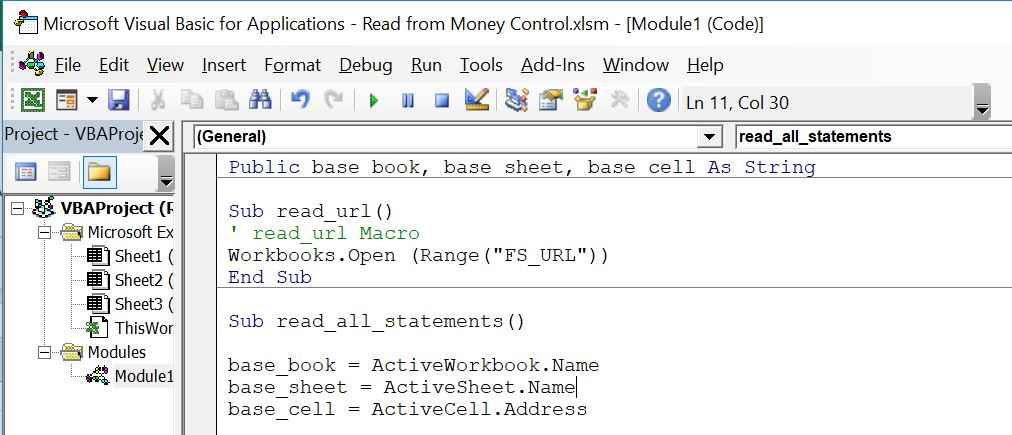
After you put together a list of different companies, you can create little macro with workbooks.open that is illustrated below. Results of reading one URL go into a new sheet as illustrated by the screenshot below the the macro.
.
Sub read_url()
' read_url Macro

Range("FS_URL").Calculate ' In case set to manual
Workbooks.Open (Range("FS_URL"))
End Sub


.
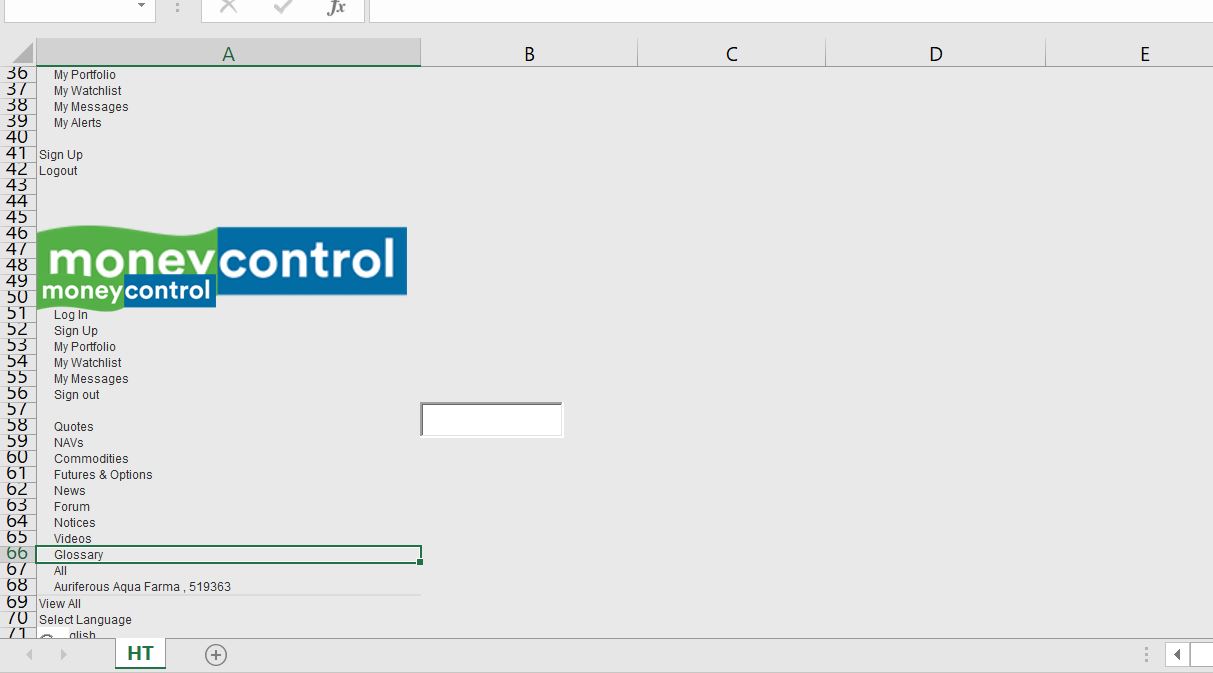
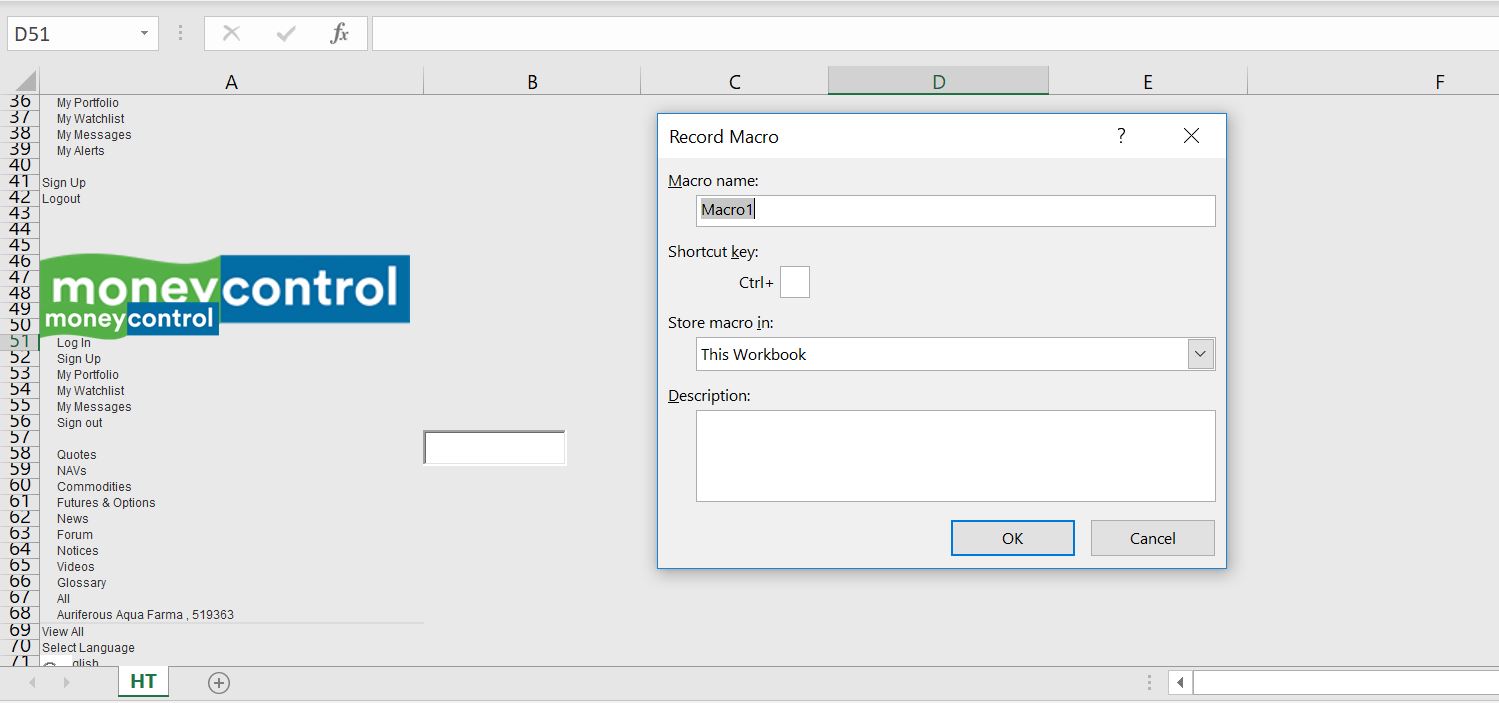
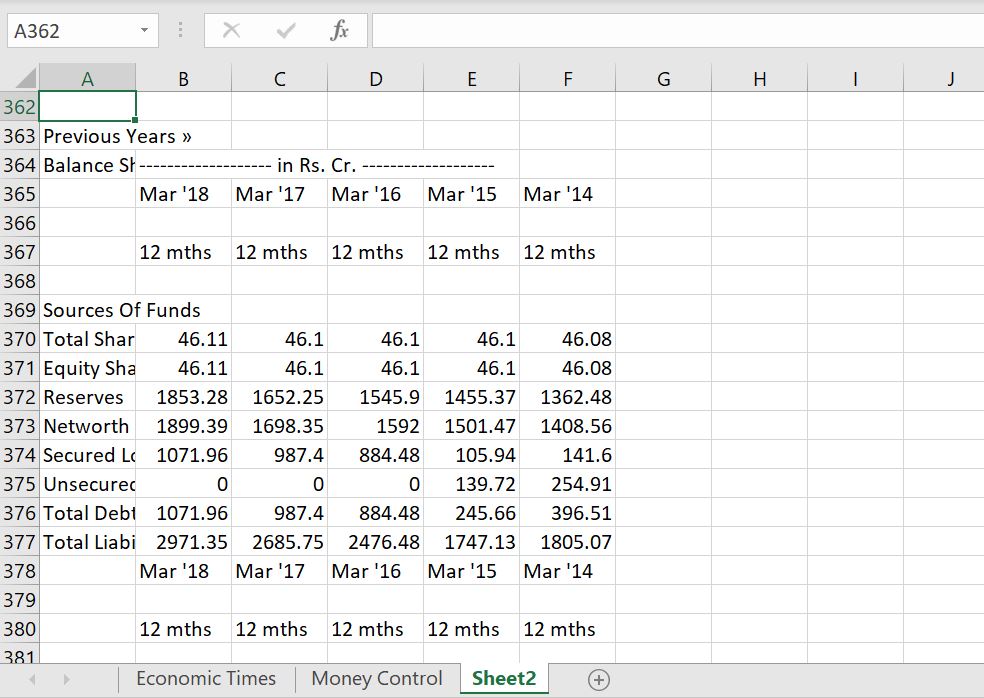
After you create the macro to read a single URL, you should create another macro to move the read in data back to your base workbook in a new sheet. To do this, go to the new sheet that has been created and then start recording a macro as shown in the first screenshot below. Then copy the sheet into an new sheet of your base file as illustrated in the second screenshot. Next, paste special the results without all of the advertisements into a new sheet of your file. Still with the macro on.
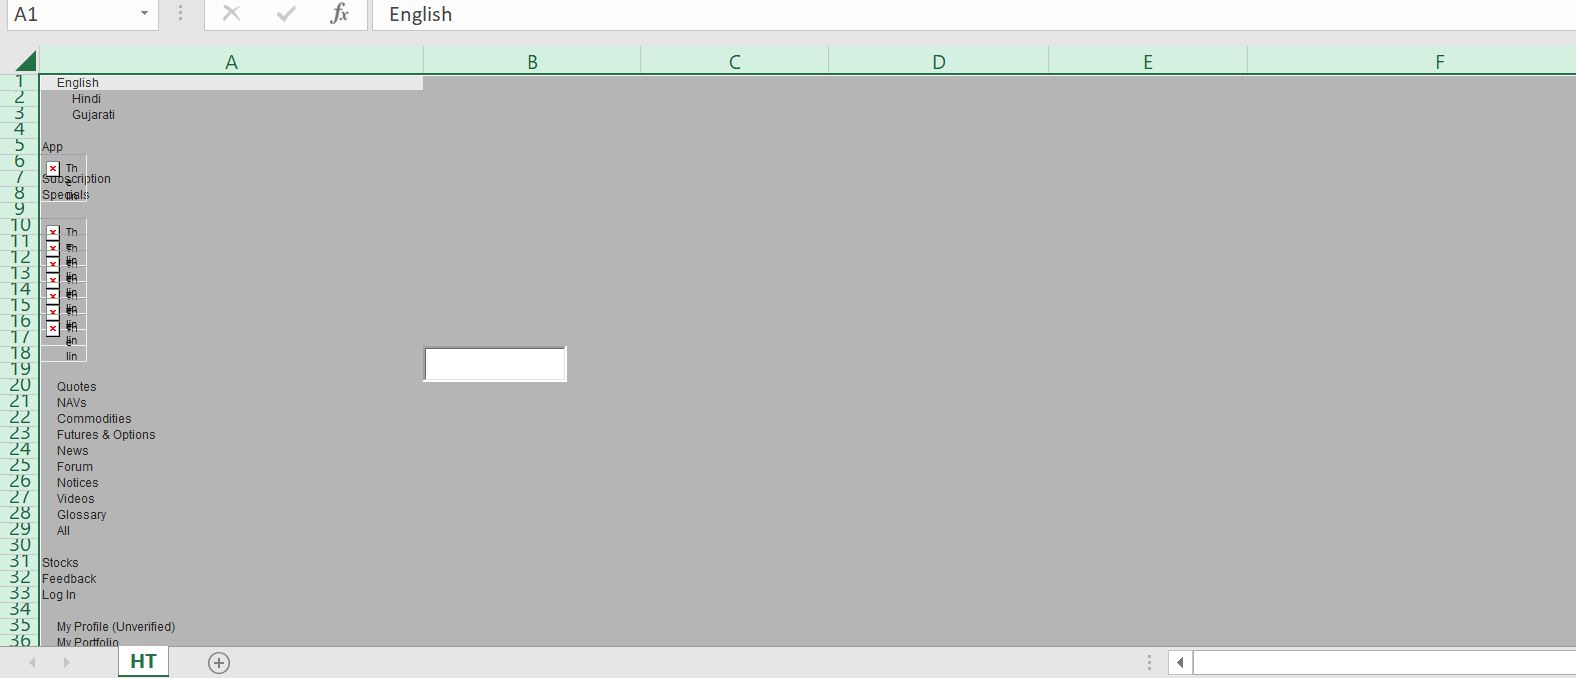
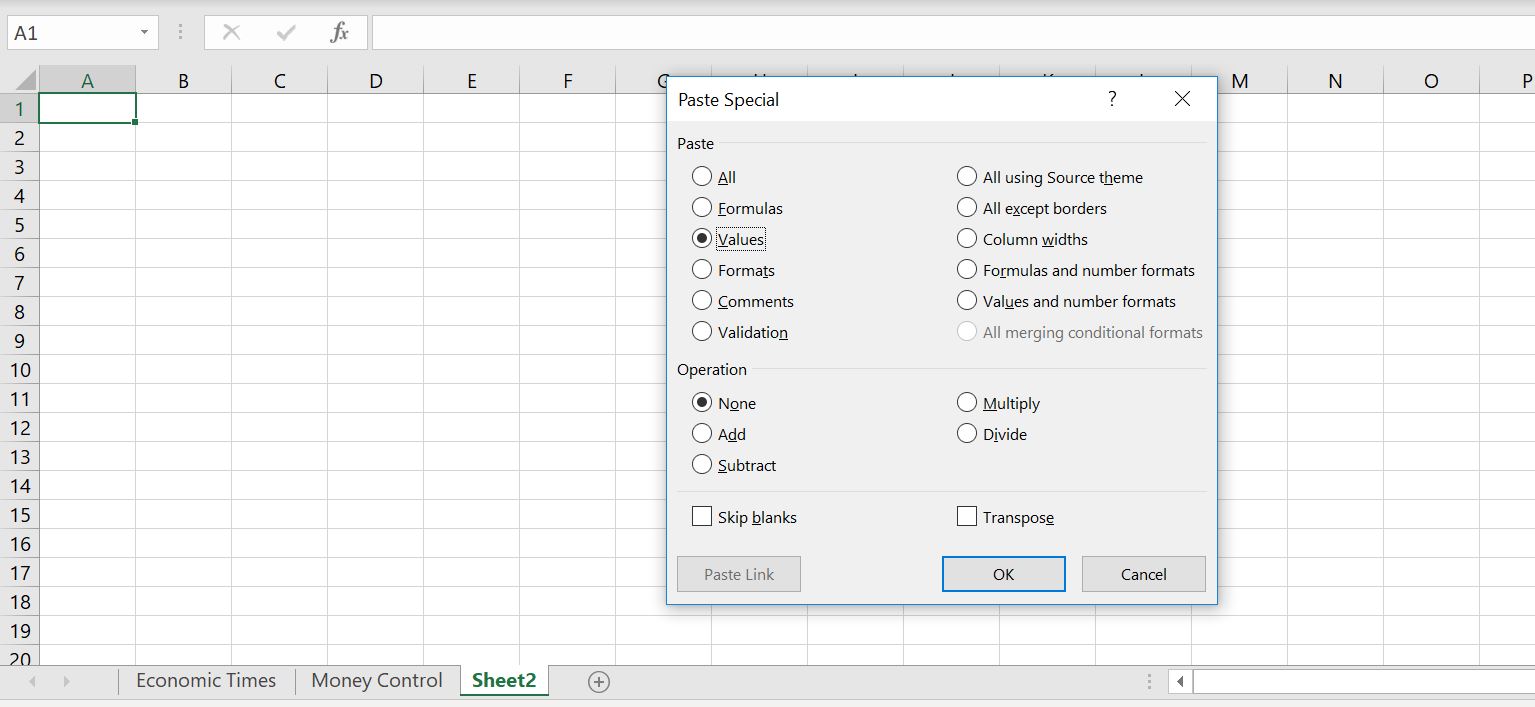
Results of the paste special with the macro still on are shown below in the screenshot.
Then, you re-name the sheet which will be modified when you edit the macro.
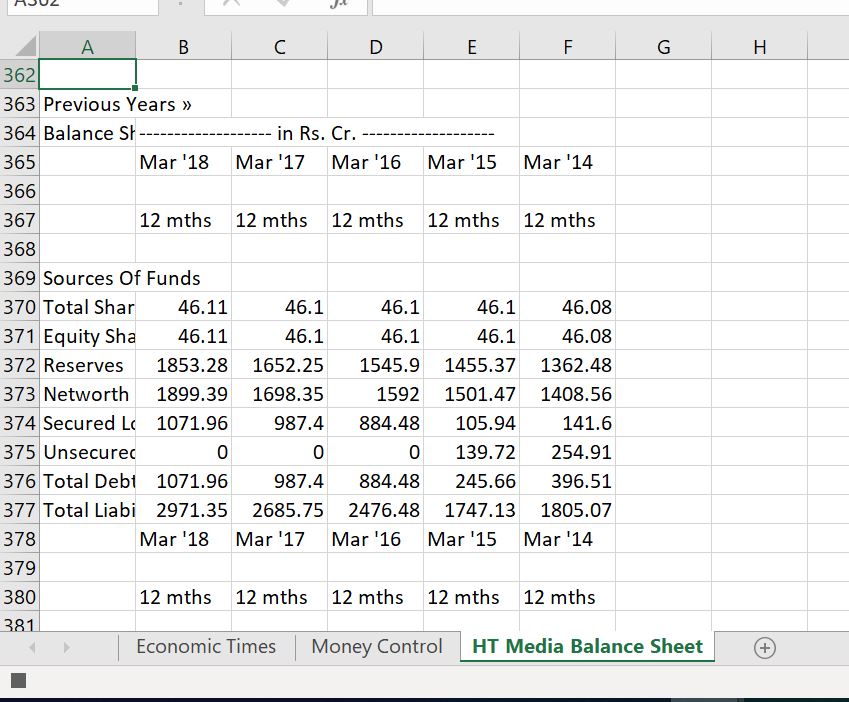
Once you have changed the name, you stop recording the macro and then you paste the macro into the base sheet. Note that when you copy the macro from the new sheet.
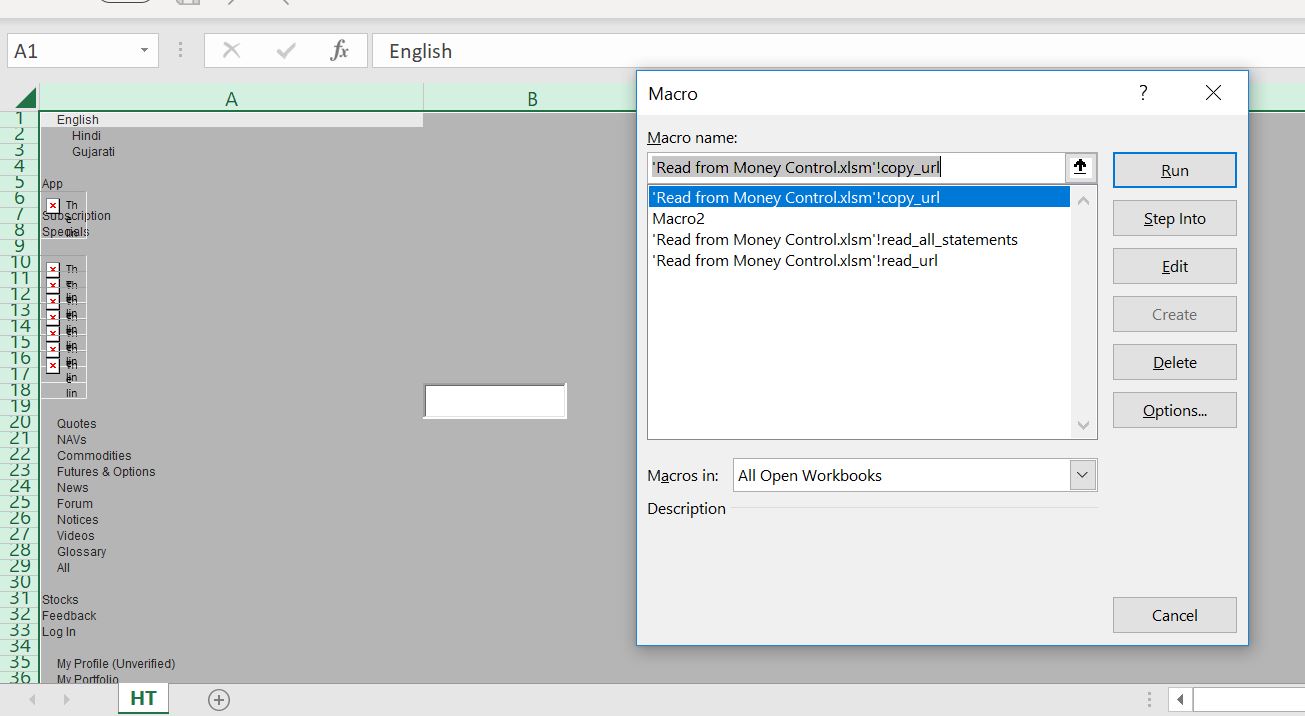
The next step is modifying the macro with range names from the base sheet. There are a few changes that you should make that are shown in the code below the screenshots.
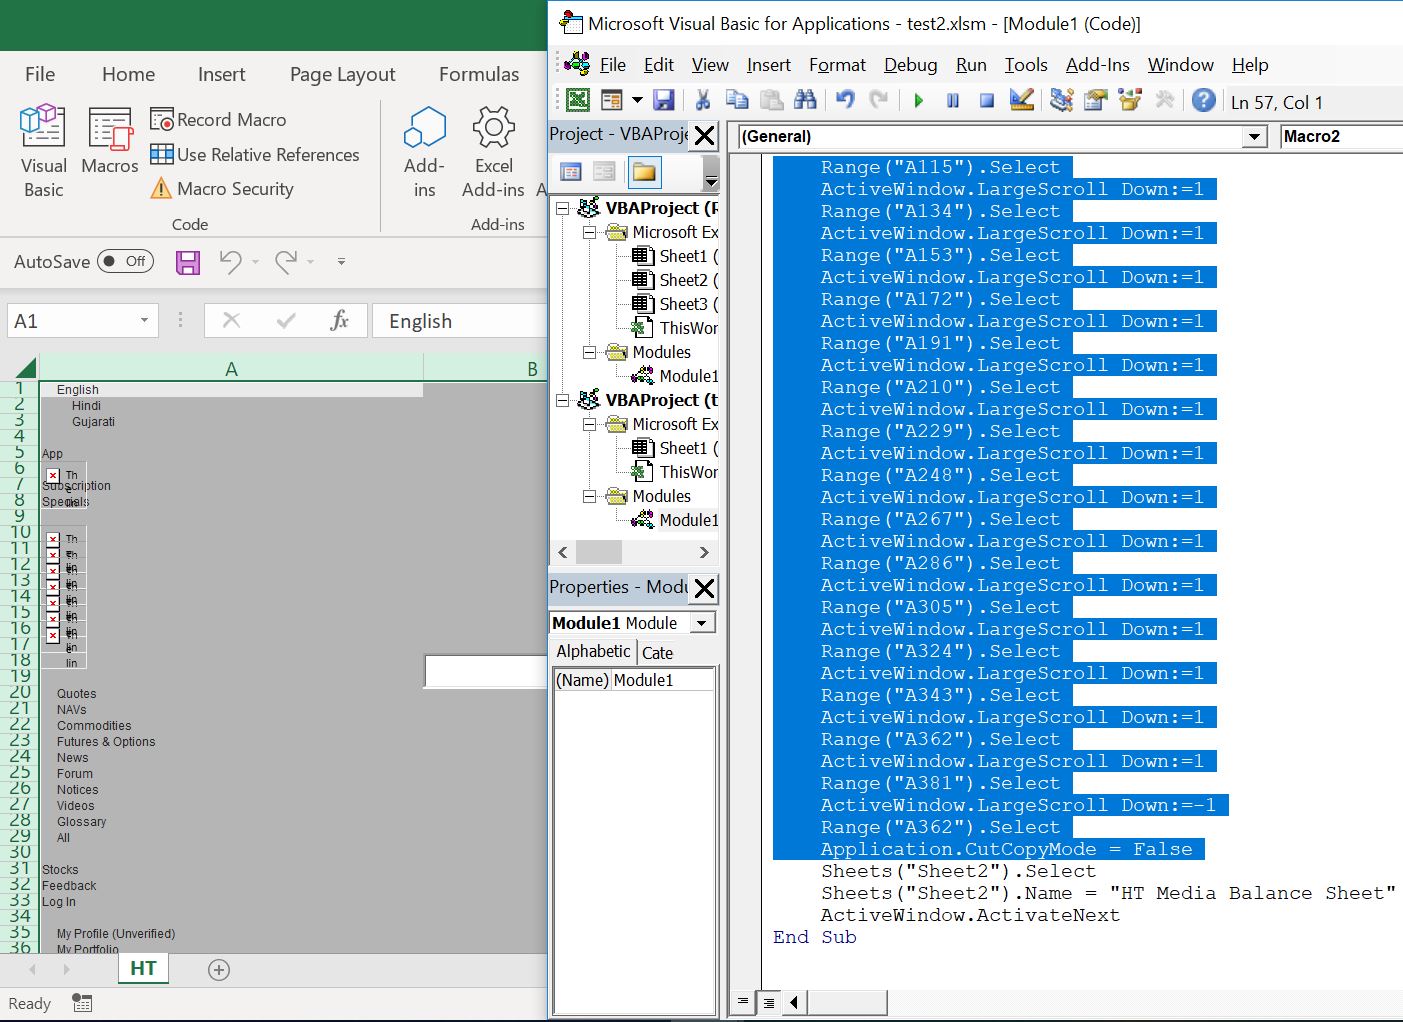
Before modifying the macro, delete the crap. There will be a lot of stuff as illustrated below from the scroll down. The modified code is shown below this screenshot.
.
Sub copy_url()

temp_book = ActiveWorkbook.Name ' Name the temporary book so can close

Cells.Select ' In new workbook
Selection.Copy

Workbooks(base_book).Activate ' Define base_book as a public variable

Sheets.Add After:=Sheets(Sheets.Count) ' Where to add the sheet. Rembember this

Cells.Select
Selection.PasteSpecial Paste:=xlPasteValues, Operation:=xlNone, SkipBlanks _
:=False, Transpose:=False

On Error GoTo error1:
Range("fs_name").Calculate

ActiveSheet.Name = Range("fs_name")

Application.DisplayAlerts = False ' Don't show message
Workbooks(temp_book).Close ' Close the temporary book

GoTo complete:
error1:

MsgBox " Clear the sheets before running"
End
Exit Sub

complete:
End Sub
.
The macros that are modified are shown below.
You should copy some code that clears the sheets. I made a sheet named Delete Break. The code for clearing the sheets is shown below.
![]()
.
Sub clear_sheet()

Application.ScreenUpdating = False
Application.DisplayAlerts = False

current_calc = Application.Calculation
Application.Calculation = xlCalculationManual

For sheet_num = Sheets.Count To 1 Step -1

If Sheets(sheet_num).Name = "Delete Break" Then
Application.Calculation = current_calc
Exit Sub
End If

Sheets(sheet_num).Delete

Next sheet_num

Application.Calculation = current_calc

End Sub
.
The final part is the use of INDIRECT with MATCH and INDEX to put together the summary from different pages. This is created by making a macro work with loops around the financial statements and around the companies that have been defined. This is shown in the code below.
.
Sub read_all_statements()

base_book = ActiveWorkbook.Name
base_sheet = ActiveSheet.Name
base_cell = ActiveCell.Address
Application.EnableEvents = True

For company = 1 To 3
Range("company_code") = company

Range("sheet_names").Calculate
Sheets(base_sheet).Calculate

For Statement = 1 To 4
Range("fs_code") = Statement
Range("symbol").Calculate
Range("company").Calculate

read_url

copy_url
DoEvents ' Only for display
Next Statement
Next company

End Sub


.