This page explains how you can adjust the report outputs in the UDF. We have found it essential that the reporting is completely flexible if the parallel model is to be useful for you and particularly if you are going to make little changes for things like income tax details or particularities of financing. Transparency and seeing how your equations work is an essential part of the UDF (and in any financial model) and in this explanation I will try to show you how you can carefully change the reports. I want to convince you that modelling is about the concepts and not about excel. The style is a little different, but if you understand how project finance models are supposed to work, I am completely confident that you can work through the reporting and other technical issues in writing a little VBA code to adjust reporting and other details. Being able to work efficiently with the reports is an essential part of finding problems with the UDF. Specifically, you can work backwards and find the problems. Before getting into the details, one more point about any financial model is crucial for me and something I did not apply over the years. This is the point to not be stingy with rows in your financial model. The same principle applies to line items in the parallel model report. Please make sure the digital VBA signature is checked.
Finding the Report and Report Problems
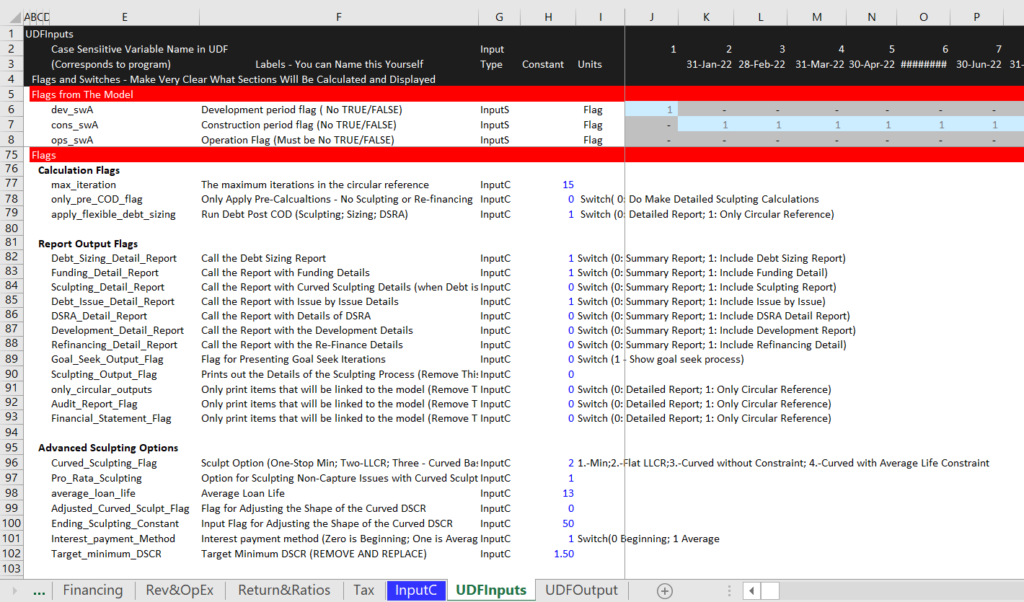
Let’s go through some of the basics. When you want to make a report using the parallel model to evaluate different issues, you can select different report options in the UDFInput page. As shown in the screenshot below, you can choose different reports (you could also make your own report once you see how the VBA works). You just choose 1 to select a report. In the example below, the debt sizing report; the funding report and the debt issue detail report is selected. If you are not getting all of your reports, the problem may be very simple. You have to have enough rows as part of the UDFOutput sheet for the function.
The Summary Report for Transferring Variables
The summary report is intended to include variables that you will use in your model. If you select this report, it will be the first report that will be put in the UDFOutput. This report should be standard and always there so that if you choose to print other reports, you will still be able to link the fundamental variables. For example, there is a detailed debt sizing report that you may or may not want to display. If the key ultimate variables that you need for your model like the IDC, the fees and the DSRA was below this report, then you would have to change the link every time your re-run the model.
Modifying the Report
This section illustrates how you can change the reports. It is a little more difficult than making a report in excel, but once you get used to it, it is not much more difficult than adding rows to excel. We have tried to make this process as flexible and easy to modify as possible. It even has some advantages in terms of flexibility, structure and transparency because you can very easily put all of the debt issues together when making a report. You can just pull out variables and put them wherever you want. To illustrate how to do this I begin with a simple case study.
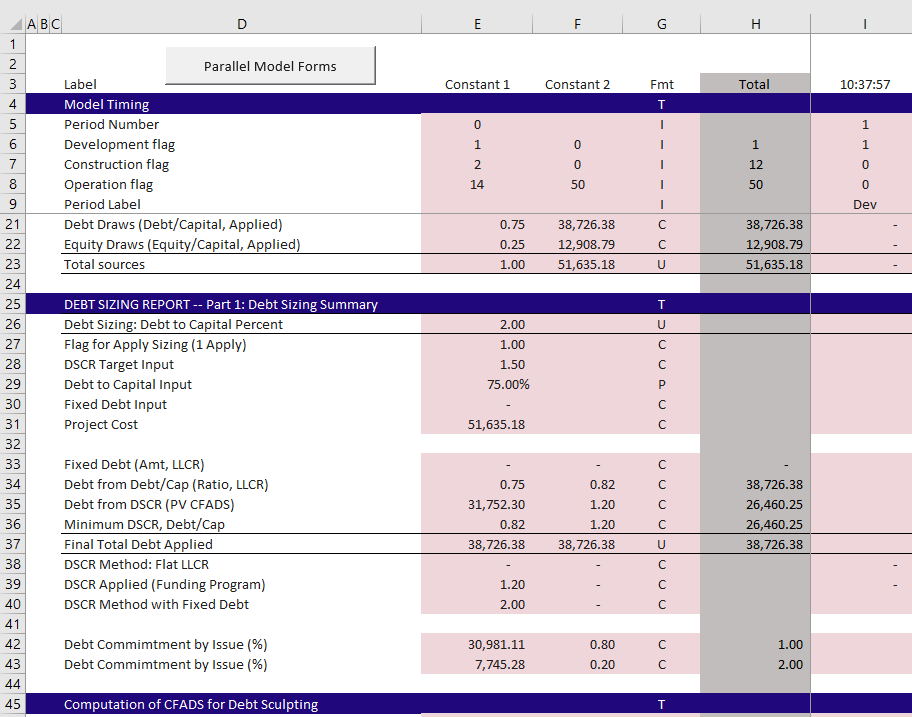
In the screenshot below, note how the debt commitment is shown in lines 42 and 43 of the UDFOutput page. But you would like to know what the issue numbers are for these issues (there could be 10 different debt issues) and you want to see how much of the debt comes from each issue. In the screenshot below the issue number is not shown in issues 42 and 43.
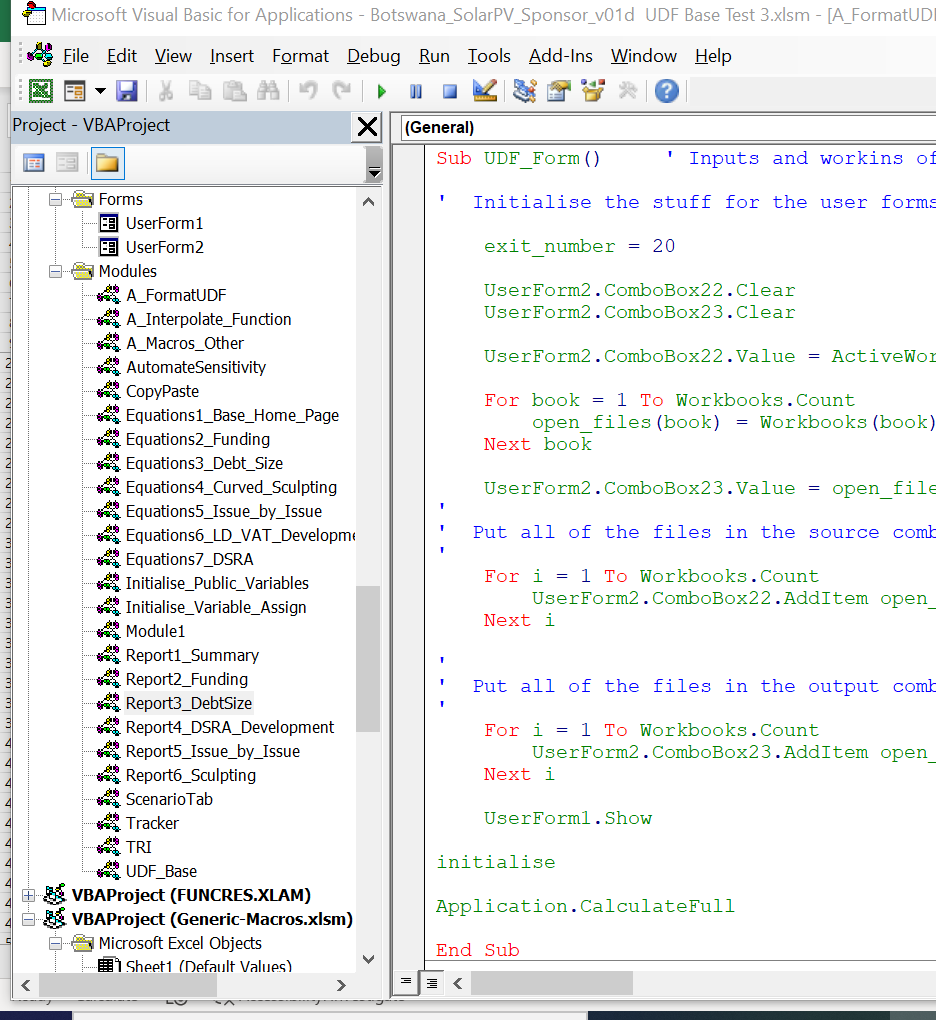
The first step is to go to the button at the top of the page so you can start to modify the VBA code. There are many ways to do this. and then right click. You can then see the list of different modules. As this is the debt size report, you go to the debt size report module and look for what you want to change.
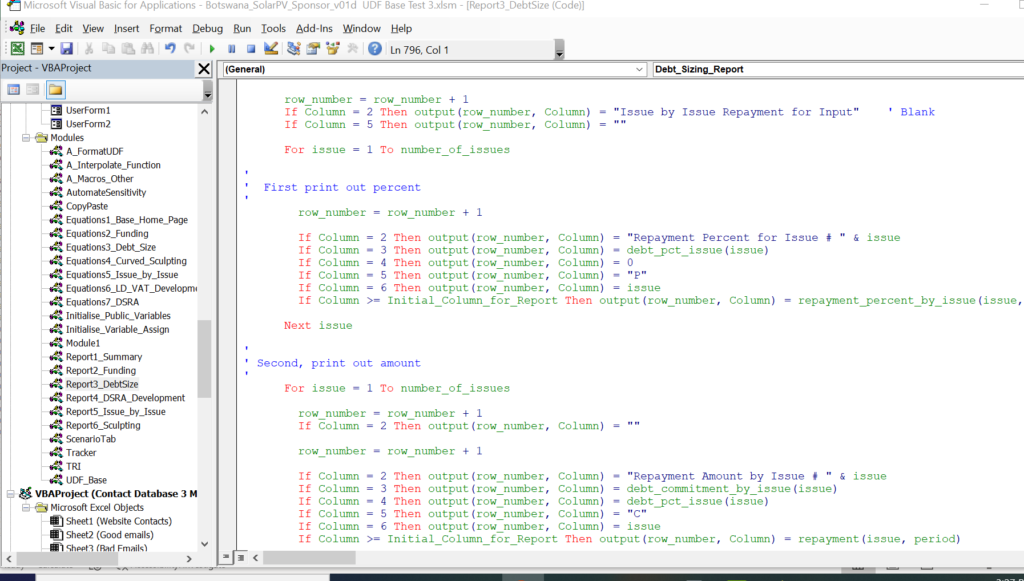
To show the debt issue as part of the title, I have added the variable “issue” in the report. This is a lot like making a title in an excel file. You may need to get used to changing the different outputs that go into the reports. For example, in the screenshot below, the debt commitment by issue with the array variable issue — debt_commitment_by_issue(issue) is defined in the funding equations. This is the same with the debt_pct_issue(issue). Similarly, the variable is defined in the debt size with the variable DSCR_Applied(period). This variable is defined and then output by period in the report. So, you need to find the variable and then you can print it out.
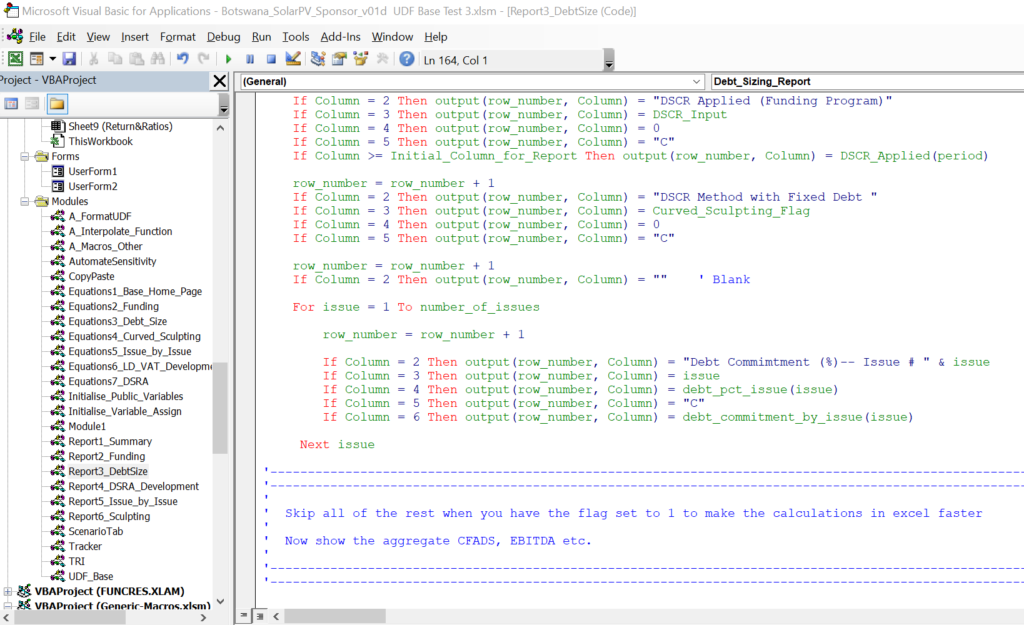
To print out a new variable, you can copy the block. You need to include the row_number = row_number + 1 and the other statements that start with If Column = 1 then …
Simple Example — Adding a Space
You want your report to look good and I certainly do not have good taste. In this example I just explain how to add a blank line in a report to fix the format. In the example below, I show the repayment amount and the repayment percent. I think it would be good to have as space underneath line 113 to split the percent from the amount.
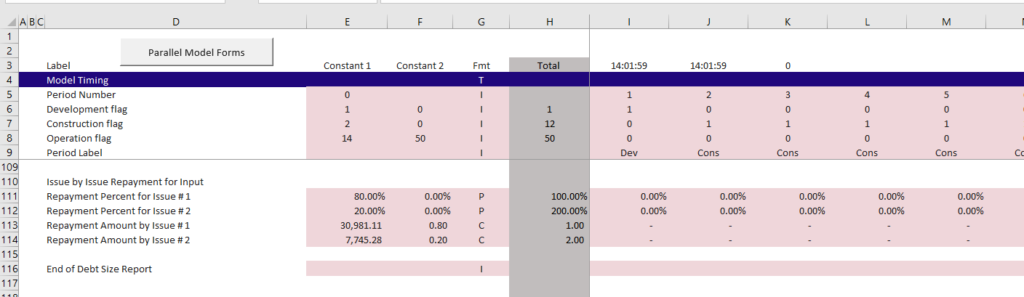
To skip a row put the equation row_number = row_number + 1 as shown in the excerpt below. I include a space as well, but this is not really necessary.
Formatting the Reports with Colours, Number Formats and Underlines
You can format the reports and put in your own colours. We have not made this as easy as the generic macros.
Sub UDF_Format() current_cell = ActiveCell.Address StyleKiller Cells.Select Selection.ClearFormats ActiveWindow.DisplayGridlines = False ' This is not used column_test = 7 start_row = 4 end_row = 185 final_column = 93 ' Find the start column to format For Row = 1 To 10 For Column = 1 To 10 If Cells(Row, Column) = "Constant 1" ThenCells(Row, Column).Select formatrow = Row formatcolumn = Column Exit For End If Next ColumnNext Row ' Find the start column to format For Row = 1 To 10 For Column = 1 To 10 If Cells(Row, Column) = "Label " ThenCells(Row, Column).Select Labelrow = Row labelcolumn = Column Exit For End If Next ColumnNext Row ' FMT Column For Row = 1 To 10 For Column = 1 To 10 If Cells(Row, Column) = "Fmt" ThenCells(Row, Column).Select fmtrow = Row fmtColumn = Column Exit For End If Next ColumnNext Row ' Find the start Total to format For Row = 1 To 10 For Column = 1 To 10 If Cells(Row, Column) = "Total " ThenCells(Row, Column).Select totalrow = Row totalcolumn = Column Exit For End If Next ColumnNext Row ' Cells(formatrow, formatcolumn).SelectSelection.End(xlDown).Select end_row = Selection.Row' MsgBox "Format row " & formatrow & " Formatcolumn " & formatColumn ' MsgBox "Fmt row " & fmtrow & " Formatcolumn " & fmtColumn ' MsgBox "Total row " & totalrow & " totalcolumn " & totalcolumn ' MsgBox "End Row " & end_row ' Find the number of rows to work through from the size of the UDF ' Selection.End(xlRight).Select ' final_column = Selection.Row ' ' Date format on top row ' Range(Cells(totalrow, 9), Cells(totalrow, 10)).Select Selection.NumberFormat = "[h]:mm:ss;@"For Row = start_row To end_row If Cells(Row, fmtColumn) = "C" Then ' Comma Formatting Range(Cells(Row, formatcolumn), Cells(Row, final_column)).Select Selection.Style = "Comma" With Selection.Interior .Pattern = xlSolid .PatternColorIndex = xlAutomatic .ThemeColor = xlThemeColorAccent1 .TintAndShade = 0.799981688894314 .PatternTintAndShade = 0 End With End If' Integer FormatIf Cells(Row, column_test) = "I" Then ' Integer Formatting Range(Cells(Row, formatcolumn), Cells(Row, final_column)).Select Selection.NumberFormat = "0" With Selection.Interior .Pattern = xlSolid .PatternColorIndex = xlAutomatic .ThemeColor = xlThemeColorAccent1 .TintAndShade = 0.799981688894314 .PatternTintAndShade = 0 End With With Selection .HorizontalAlignment = xlCenter .VerticalAlignment = xlBottom End With End If If Cells(Row, column_test) = "P" Then ' Percent Formatting Range(Cells(Row, formatcolumn), Cells(Row, final_column)).Select Selection.NumberFormat = "0.00%" With Selection.Interior .Pattern = xlSolid .PatternColorIndex = xlAutomatic .ThemeColor = xlThemeColorAccent1 .TintAndShade = 0.799981688894314 .PatternTintAndShade = 0 End With End If' ' This is the underline test ' If Cells(Row, column_test) = "U" ThenRange(Cells(Row, formatcolumn), Cells(Row, final_column)).Select ' the formatcolum starts with later Selection.Style = "Comma" With Selection.Interior .Pattern = xlSolid .PatternColorIndex = xlAutomatic .ThemeColor = xlThemeColorAccent1 .TintAndShade = 0.799981688894314 .PatternTintAndShade = 0 End With' ' Selection.Borders(xlDiagonalDown).LineStyle = xlNone ' Selection.Borders(xlDiagonalUp).LineStyle = xlNone ' Selection.Borders(xlEdgeLeft).LineStyle = xlNoneRange(Cells(Row, labelcolumn), Cells(Row, final_column)).Select ' the lablecolumn is where to start With Selection.Borders(xlEdgeTop) ' this is where are the underlines .LineStyle = xlContinuous .ColorIndex = 0 .TintAndShade = 0 .Weight = xlThin End With With Selection.Borders(xlEdgeBottom) .LineStyle = xlContinuous .ColorIndex = 0 .TintAndShade = 0 .Weight = xlThin End With End If Next Row' Format the Total ColumnRange(Cells(totalrow, totalcolumn), Cells(end_row, totalcolumn)).Interior.Color = RGB(193, 189, 189)' Range(Cells(totalrow, totalcolumn), Cells(end_row, totalcolumn)).Font.Color = RGB(252, 252, 252) Range(Cells(totalrow, totalcolumn), Cells(end_row, totalcolumn)).Font.Color = RGB(1, 1, 1) ' This is blank ' ' This is a title row 'For Row = start_row To end_row If Cells(Row, column_test) = "T" Then ' Title Row Range(Cells(Row, 1), Cells(Row, final_column)).Interior.Color = RGB(32, 7, 124) ' Dark Blue Range(Cells(Row, 1), Cells(Row, final_column)).Font.Color = RGB(252, 252, 252) With Selection '.Font.Color = RGB(123, 201, 191) ' .Interior.Color = RGB(0, 0, 0) '.ThemeColor = RGB(123, 201, 191) End With End If If Cells(Row, column_test) = "S" Then Range(Cells(Row, 1), Cells(Row, final_column)).Interior.Color = RGB(255, 0, 0) Range(Cells(Row, 1), Cells(Row, final_column)).Font.Color = RGB(252, 252, 252) With Selection '.Font.Color = RGB(123, 201, 191) ' .Interior.Color = RGB(0, 0, 0) '.ThemeColor = RGB(123, 201, 191) End With End If Next Row' Center the first RowRange(Cells(totalrow, formatcolumn), Cells(totalrow, 100)).Select With Selection .HorizontalAlignment = xlCenter .VerticalAlignment = xlBottom End With' ' Centre the format column 'Range(Cells(1, fmtColumn), Cells(end_row, fmtColumn)).Select With Selection .HorizontalAlignment = xlCenter .VerticalAlignment = xlBottom End WithCells(5, 1).Select Cells(5, 1).Activate 'Cells(1, 1).Select Cells.Selectrange_true_cells = "=A1=TRUE" range_false_cells = "=AND(A1<>"""",A1=FALSE)" ' False language is more complicated because blank is false range_zero_cells = "=AND(A1=0,A1<>"""")" ' Zero is also complicated because blank is zero range_one_cells = "=A1=1" Selection.FormatConditions.Add Type:=xlExpression, Formula1:=range_true_cells Selection.FormatConditions(Selection.FormatConditions.Count).SetFirstPriority With Selection.FormatConditions(1).Interior .PatternColorIndex = xlAutomatic .Color = 16777215 End With Selection.FormatConditions(1).StopIfTrue = FalseRange(current_cell).Activate Range(current_cell).Select End Sub