This page demonstrates a few different ways that you can make tornado diagrams and waterfall charts from a scenario analysis. Issues include how to sort the tornado diagram so it shows the highest risks at the top; how to create a tornado diagram from a two way table; how to set-up scenario analysis for making a waterfall chart and how to create flexible tornado diagrams that can show different output variables. The more advanced methods are included in the file below.
Sorting Tornado Diagram
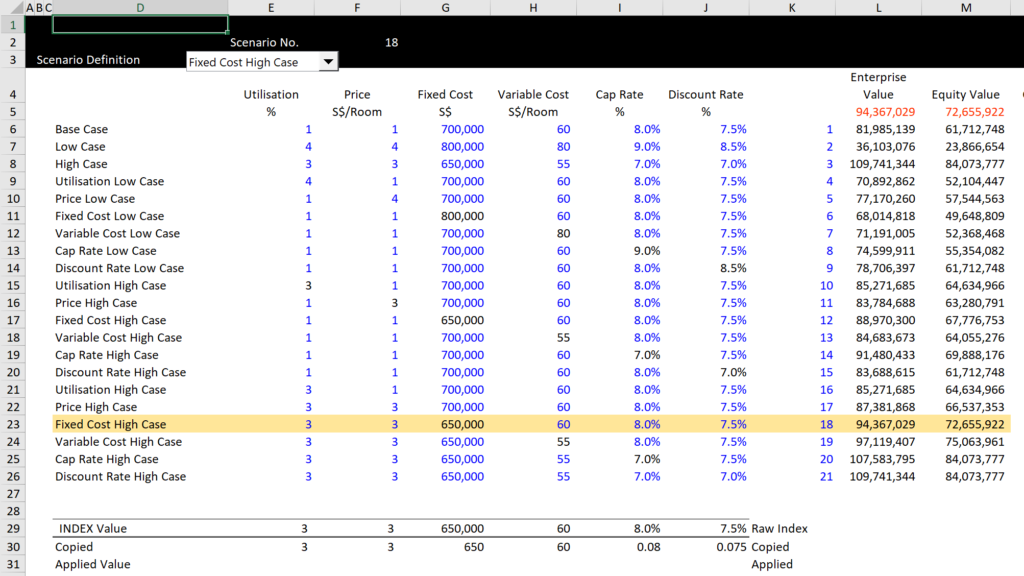
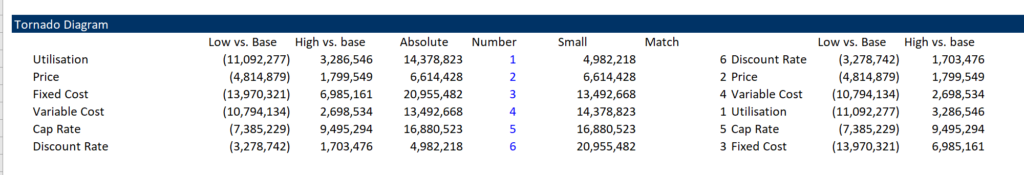
To sort, you can use an absolute value, then sort the absolute value using the SMALL function. To use the SMALL function, you can create a list as shown in the column with the blue numbers. The sorted absolute values are shown is the next column. To use this, you may have to use the RAND() function. Once you have computed the match function that matches the sorted numbers with the absolute column. This column that is titled MATCH can be used with the INDEX function for the rest of the columns. When you use the INDEX function, you can use the F4 for the columns. The tornado with the sorted data is shown below the table.
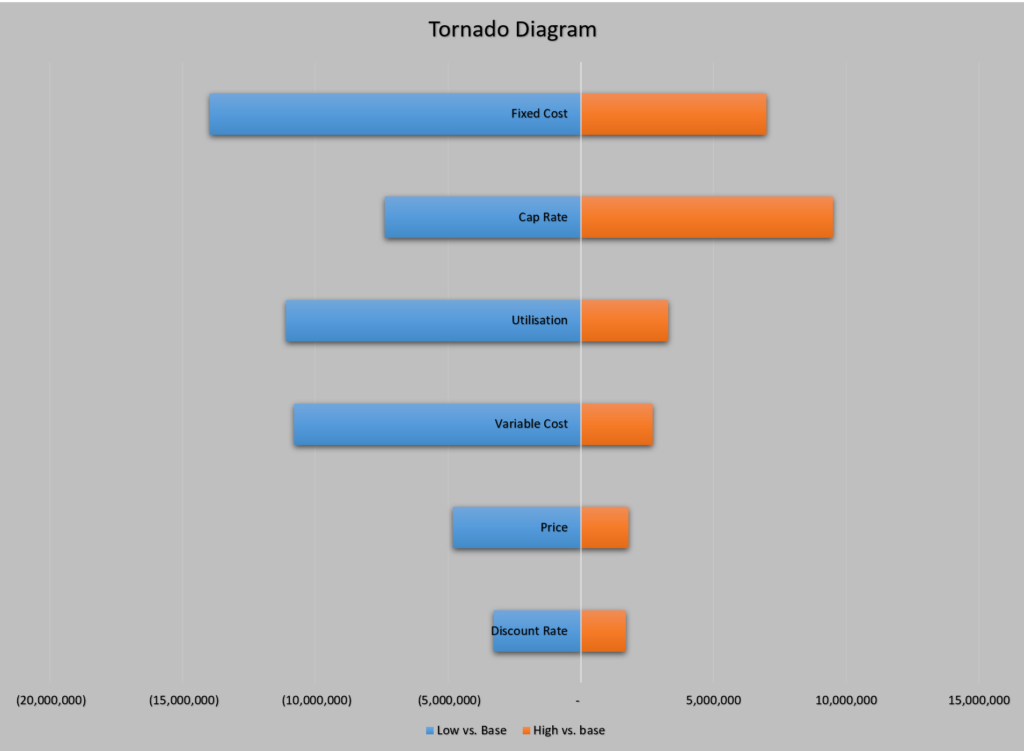
Sorting the Tornado Diagram from the Highest from the Lowest
[wonderplugin_video iframe=”https://www.youtube.com/watch?v=kH41VDGakqM” videowidth=600 videoheight=400 keepaspectratio=1 videocss=”position:relative;display:block;background-color:#000;overflow:hidden;max-width:100%;margin:0 auto;” playbutton=”https://edbodmer.com/wp-content/plugins/wonderplugin-video-embed/engine/playvideo-64-64-0.png”]
Making a Flexible Tornado Diagram that can Select Different Variables over Time from a Financial Model
[wonderplugin_video iframe=”https://www.youtube.com/watch?v=JO-SbCoqXqk” videowidth=600 videoheight=400 keepaspectratio=1 videocss=”position:relative;display:block;background-color:#000;overflow:hidden;max-width:100%;margin:0 auto;” playbutton=”https://edbodmer.com/wp-content/plugins/wonderplugin-video-embed/engine/playvideo-64-64-0.png”]
Creating a Tornado Diagram with a Two-Way Data Table
[wonderplugin_video iframe=”https://www.youtube.com/watch?v=fdO6p22ngow” videowidth=600 videoheight=400 keepaspectratio=1 videocss=”position:relative;display:block;background-color:#000;overflow:hidden;max-width:100%;margin:0 auto;” playbutton=”https://edbodmer.com/wp-content/plugins/wonderplugin-video-embed/engine/playvideo-64-64-0.png”]
The file associated with this video is attached to the button below and you can download the file by clicking on the button.
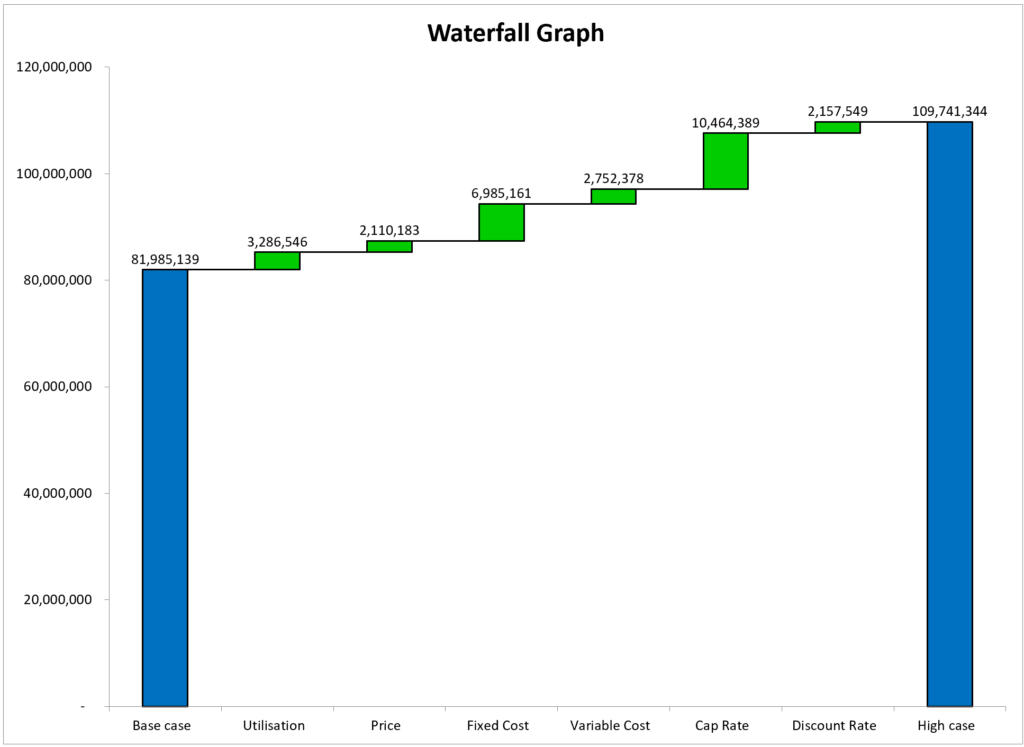
Waterfall Diagram and Base Case versus High or Low Case
You can use almost the same method to create a waterfall chart that moves from the base case or some other case to an alternative case. The results of this are illustrated on the screenshot below. Note that you can use the waterfall chart template to do this. The main point about creating a waterfall chart is creating scenarios that accumulate in the scenario table. You can start with the first single variable for the alternative case — for example you can change the utilization variable. For the next variable, say the price variable, create a scenario that combines the utilization variable and the price variable.