This page describes the calculaton, meaning of and problems with Return on Invested Capital or ROIC. The calculation of ROIC is compared to Return on Assets and Return on Equity. Once the mechnics and theory is addressed, distortions in ROIC involving write-offs, timing, service companies and other factors are discussed along with potential ways to resolve the issues through making alternative calculations.
A couple of files that you can download with explanations of the ROIC below. ROIC problems and issues are demonstrated by the case of Vestas. You can download the Vestas financial model below. This model has issues related to service income without investment.
Vestas Corporte Finance Model and Problems with Measuring ROIC
Simple Example of Computing ROIC Using the Case of Apple
General Meaning of ROIC versus ROA and ROE
Any rate of return measures the amount you get back relative to the amount of investment you made. Return on equity investment measures the amount of periodic income you recieve compared to the amount you originally invested. The income is net income on the profit and loss statment. The investment you made is either paid in capital and/or retained earnings on the equity part of the balance sheet. Return on assets can be defined as the operating income that you receive divided the total assets that were paid for with all of the funding sources on the balance sheet.
Return on invested capital is supposed to focus on the fundamental operations of the business and EBITDA. Income in the ROIC formulation begins with the EBIT and then deducts taxes on EBIT to derive net operating profit after tax or NOPAT. In terms of an equation, the formula is NOPAT = EBIT * (1-t). The NOPAT would be the same as net income if there was no cash on the balance sheet, no debt on the balance sheet (so I in EBIT is zero). Similarly if every asset on the balance where used to generate EBIT or NOPAT, then the total assets on the balance sheet would be the same as the equity on the balance sheet. In this case if every asset is used to generate EBITDA (or EBIT, or NOPAT), the ROIC which is NOPAT divided by invested capital, would be the same as ROE.
The ROIC is supposed to allow investors to focus on the real activities of a company and to exclude activities that are reported on the financial statements but have nothing to do with the fundamentals of operating the business. The general idea of ROIC is to find investment that has been made to generate EBITDA and exclude investment for things like long-term cash investments, investments in assets that will be disposed, invetments in financial derivatives and so forth. From an income perspective, non-operating activities can include income from cash, interest expense, gains on asset dispositions, changes in the fair value of derivatives, income from associated investments not included in EBITDA and extraordinary items. The return on assets and return on equity for Apple reported by Yahoo finance is shown below.
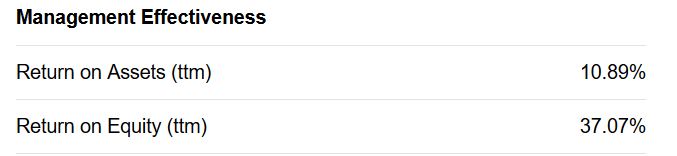
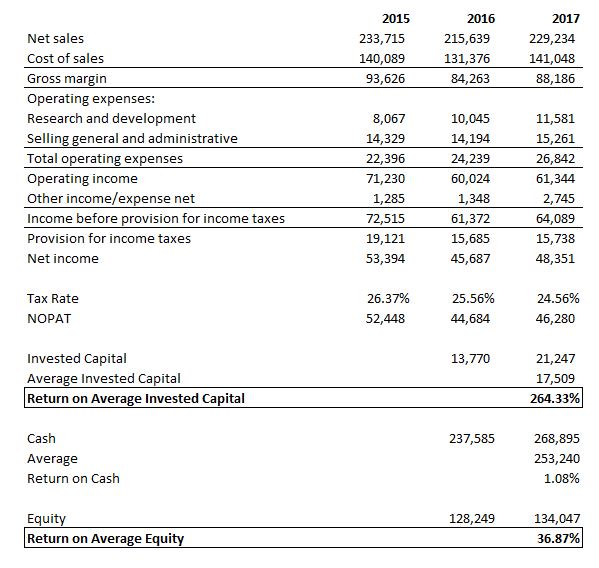
To think about ROIC, consider the case of Apple. Let’s say you want to find out just how Apple earns in profit from I-phones, I-pads and Mac’s relative to the amount of money it invested in factories that make these things and the working capital needed to support the operations. When you look at Apple’s balance sheet you see an gigantic amount of cash and long-term investments. You do not care about the return on the cash and investments; you want to focus on the capital that has been invested to earn money on the key products. Invested capital for I-phones is net investment in plant less accumulated depreciation. The amount of working capital (Accounts Receivable plus Inventories less Accounts Payable) is negative and the negative and the net plant and equipment is low. This means the ROIC is 264% as shown below. The balance sheet analysis in the next sections shows all of the profits from I-phones, I-pads and Mac’s are made without investment on the balance sheet. The 264% ROIC contrasts with ROI and ROE shown above that are not as spectacular because the cash and long-term investents that earn about 1% are mixed up with the operations (note also that an adjustment can be made for research and development).
Splitting-Up the Balance Sheet to Measure Invested Capital
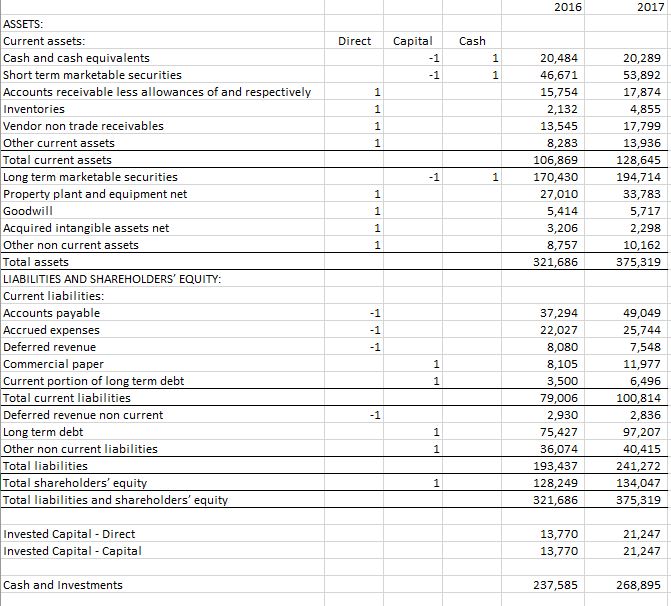
The case of Apple and Vestas are used to illustrate the process of splitting-up the balance sheet to compute ROIC. To do this you can look at each item on a balance sheet and consider whether the balance sheet category is related to the generation of EBITDA or not. You need some judgement and assign all items that are not sub-totals a +1 or -1. You can make two columns. One for the direct asset method and another column for the net capital invested. The assets that are related to EBITDA and included in invested capital are assigned a value of 1. The assets that are not related to EBITDA such as cash, long-term investments, fair value of investments have a value of -1 on the indirect side. These are assets that are deducted from equity and debt capital that is invested. The reason these are deducted if because some of debt and equity capital is investment in cash assets and not in assets related to EBITDA. These assets must be deducted from invested capital. The company has massive amount of cash on its balance sheet in the billions of USD.
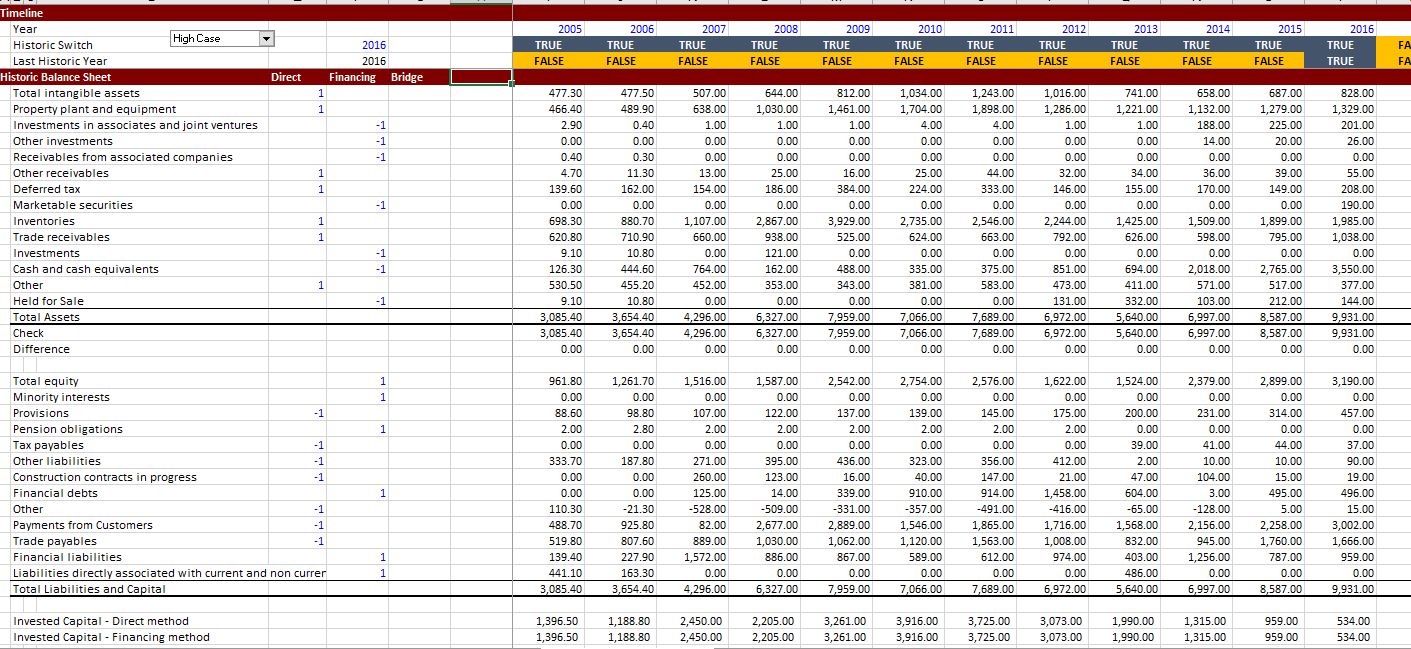
The excerpt below illustrates this process for Vestas. If the balance balances and each account has a +1 or -1, the invested captial will be the same using either method. The invested capital can be computed with the SUMPRODUCT function.
Distortions in Return on Invested Capital from Asset Impairments
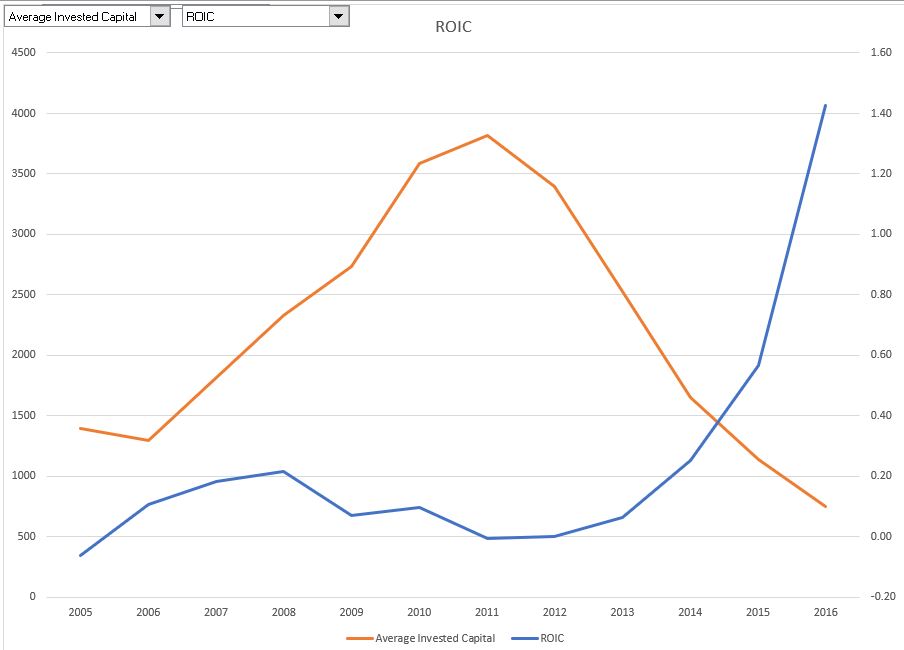
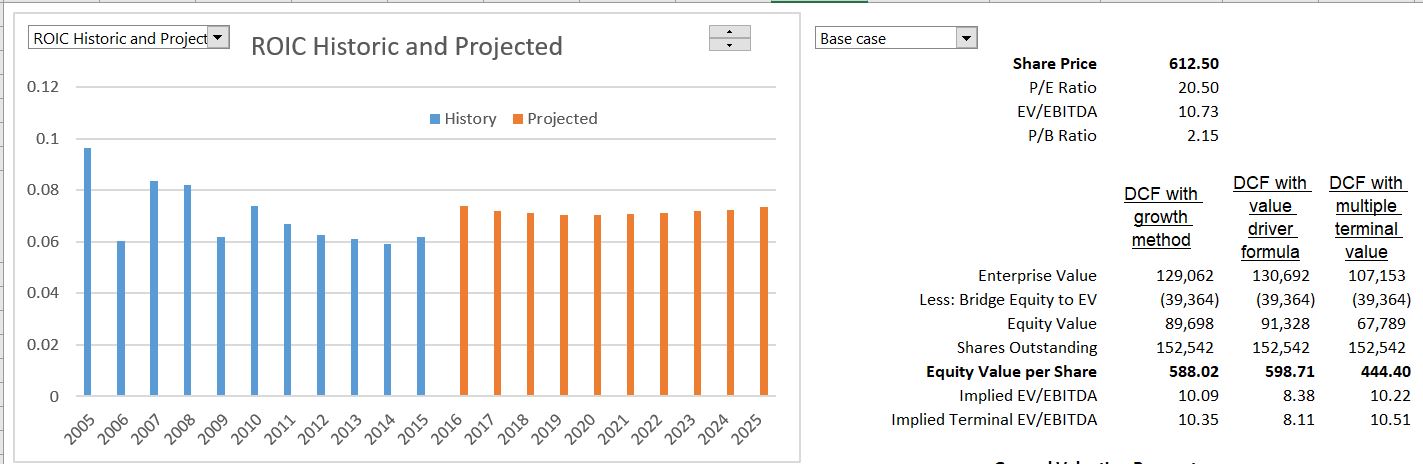
The Vestas case demonstrates problems with computing return on invested capital. This is because the invested capital has been falling because of write-offs, reduced capital expenditure and high depreciation expense. This has led to extremely high returns.
Return on Invested Capital and Goodwill
Return on assets versus return on invested capital
BS Comments on ROIC from McKinsey Book
In many of my pages I comment on BS that is in typical financial analysis. One of these comments is the following statement made in the McKinsey book on valuation: “The median large U.S. company earned a 19 percent ROIC in 2013, while the median large Asian company earned 8 percent.But for the most part, Asian companies historically have focused more on growth than profitability or ROIC, which explains the large difference between their average valuation and that of U.S. companies.”
There is so much simplistic BS in this statement I hardly know where to start. First, of course no company can choose its ROIC. An ROIC of 19% suggests massive monopliy profit in 2013 when the cost of equity capital was somewhere around 5% to 7%. If the ROIC is not distorted from service businesses, from write-offs, the age of assets or other items, the 19% ROIC suggest inefficiency in U.S. businesses as they could well be foregoing positive NPV investments. This is becase all of the babbling on about ROIC versus WACC, the basic idea that value is increased from making positive NPV investments. If the ROIC is 19% and a positive NPV investment can be made that earns 8% versus a cost of capital 6%, then value is being destroyed by managment.
To illustrate the NPV idea consider the NPV on your first, second and third child. Your NPV on the first child may be positive as having a child may help you when you are old and senile and the child may provide happiness to you before he or she becomes a teenager. The marginal return from the second child may be much less. You don’t need more happiness and you already have somebody to take care of you when your are older. But don’t think that the NPV of the second child will necessarily be negative as the lower benefits may still outweigh the costs (that is NPV when the cost includes the cost of capital). Foregoing the second child just because the ROIC is not as high as the first is what companies do when they don’t make positive NPV investments.
[wonderplugin_video iframe=”https://www.youtube.com/watch?v=fvrqoTfaWHw” videowidth=600 videoheight=400 keepaspectratio=1 videocss=”position:relative;display:block;background-color:#000;overflow:hidden;max-width:100%;margin:0 auto;” playbutton=”https://edbodmer.com/wp-content/plugins/wonderplugin-video-embed/engine/playvideo-64-64-0.png”]