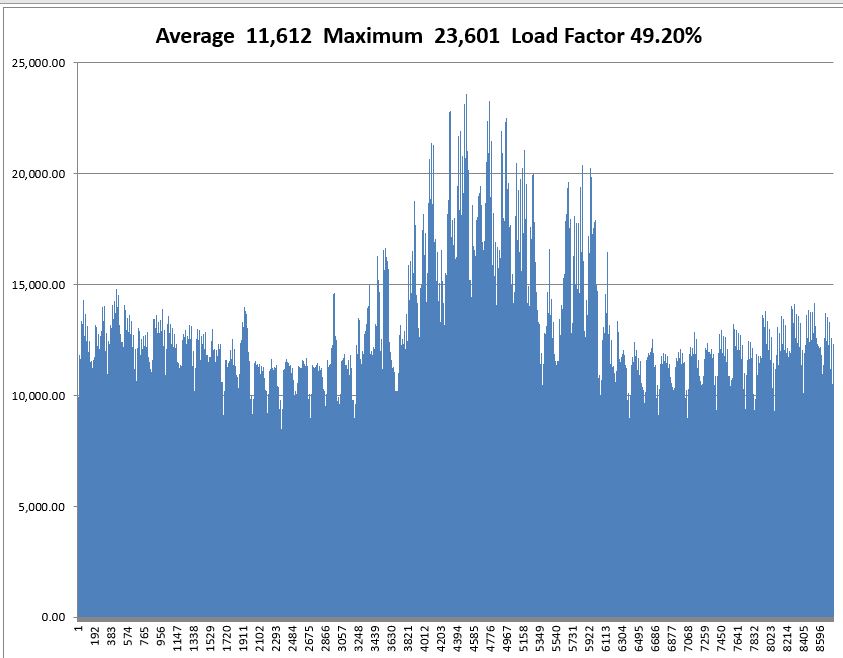
This page describes how to make an hour by hour simulation of electricity cost for many years using the supply curve and demand analysis. The discussion includes how to work with hourly demand data and how to make a simulated cost analysis over many hours and then even many years.
These issues include transmission analysis, incremental heat rate analysis, incorporation of renewable, outages and Monte Carlo simulation.
Hour by Hour Simulation
After creating a simulation for one hour, you can extend the analysis to multiple hours. To do this you can either use a data table (that could be pretty slow) or alternatively write a little VBA code that uses the CELLS function and a FOR NEXT loop. A few files that simulate hourly marginal cost are available for download below.
Excel File Evaluating Various Different Marginal Cost and Demand Evaluation in Electricity
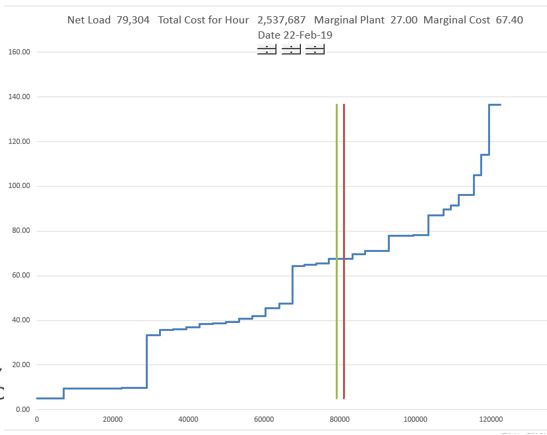
Compute the generation and the total cost
- 1. Computing the total generation is a little tricky because the plant that is on the margin does not produce its full output
- 2. To differentiate between plants that are on the margin and those operating at full capacity, you can create two switches
- 3. The full dispatch switch is a TRUE/FALSE switch that is TRUE when the plant number is less than MATCH for the dispatch unit computed above
- 4. The marginal dispatch switch is a TRUE/FALSE switch that is TRUE when the unit number equals the MATCH for the marginal dispatched unit
- 5. The total generation is dispatch switch multiplied by the capacity plus the marginal dispatch switch multiplied by the difference between the total load and the previous accumulated capacity
Excel File with Issues in Electricity with Focus on Africa Issues Including Marginal Cost
Excel File that Simulates Supply and Demand on an Hour by Hour Basis Using VBA Instead of Data Table
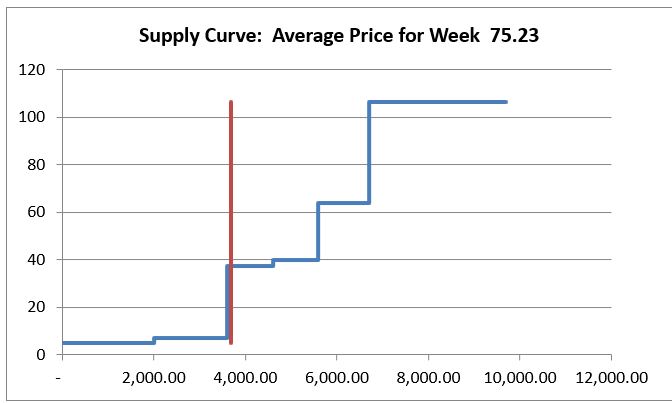
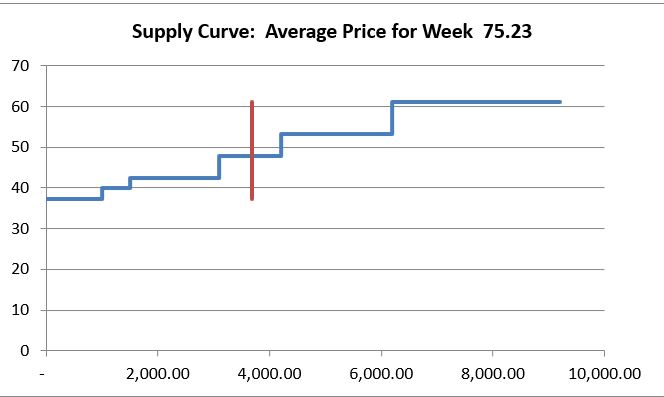
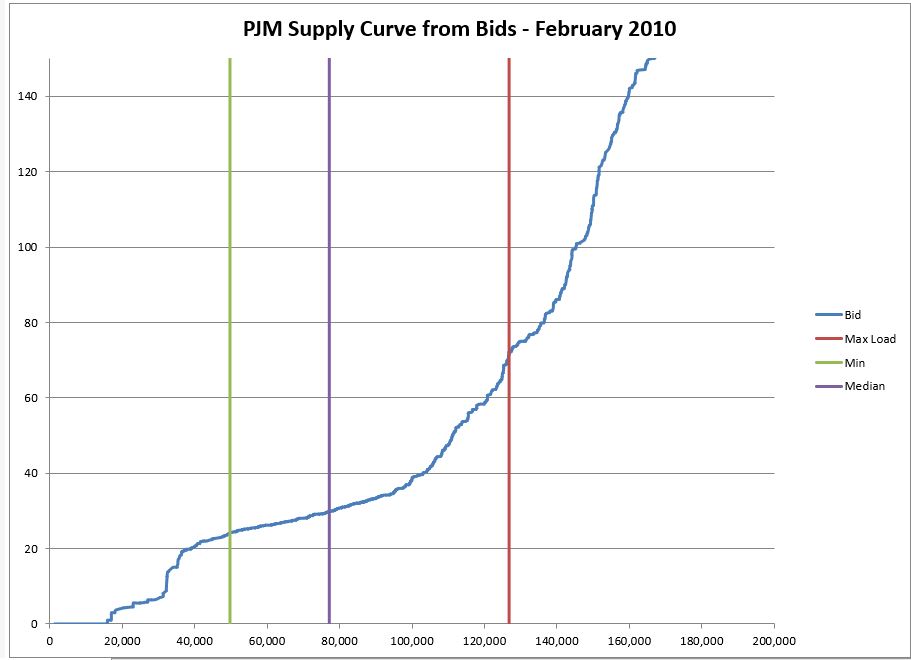
A key idea of the course is the economics of different strategies depend on the shape of the supply curve. For example, the economics of nuclear power is much higher if the gas price is high. Alternative supply curves are illustrated below to demonstrate the importance of how the shape of the supply curve affects the supply and demand analysis.
Using a Data Table to Compute Hour by Hour Marginal and Total Cost
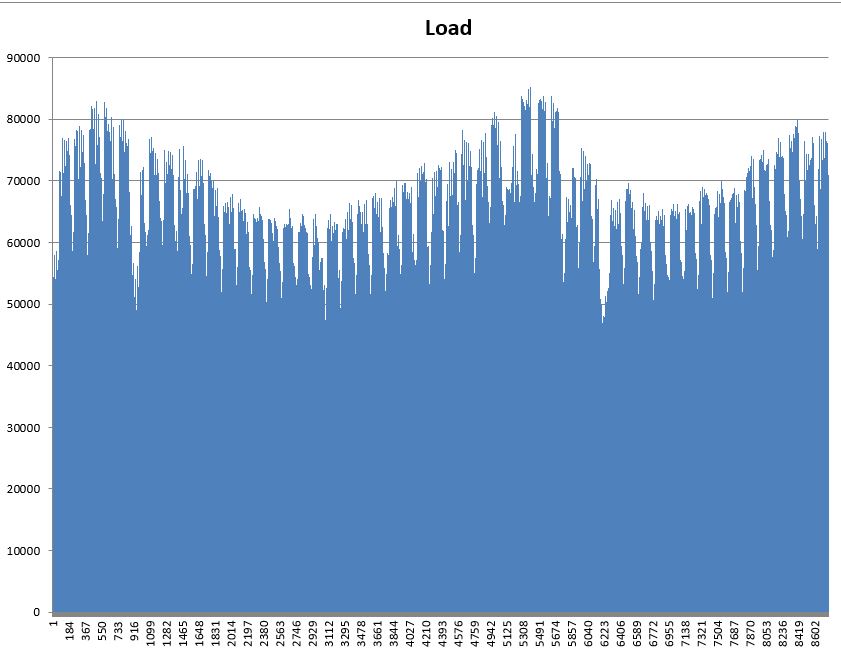
Once you have the supply stack build with the marginal cost and the total cost for a single hour, you can repeat the process for many hours.
- To extend the analysis to multiple hours, you can use a data table.
- A data table takes a variable output like the total cost for an hour and can repeat the calculation as many times as you want.
- In this case, you want to repeat the calculation of marginal cost and total cost many times for different amounts of load.
- A data table must be structured in a particular manner where the output such as the total cost or the marginal cost must be put in one place and the load such as on a row. The load then must be in a column.
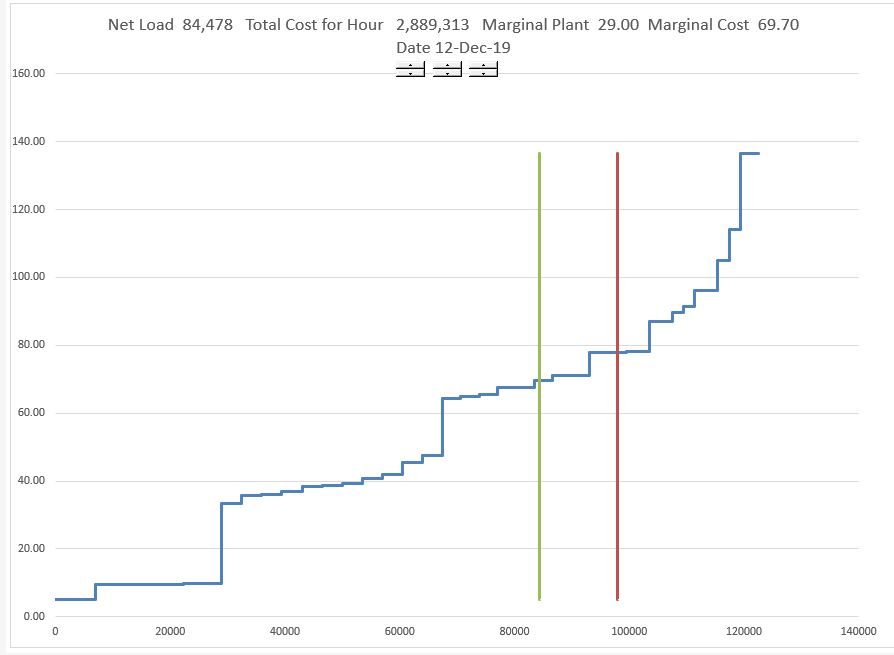
Using a data table is illustrated below. The demonstrates how you can make a data table that simulates costs on an hour by hour basis using a data table. The number on the top and the right is from the supply curve analysis. The demand is the Column Input in the data table.
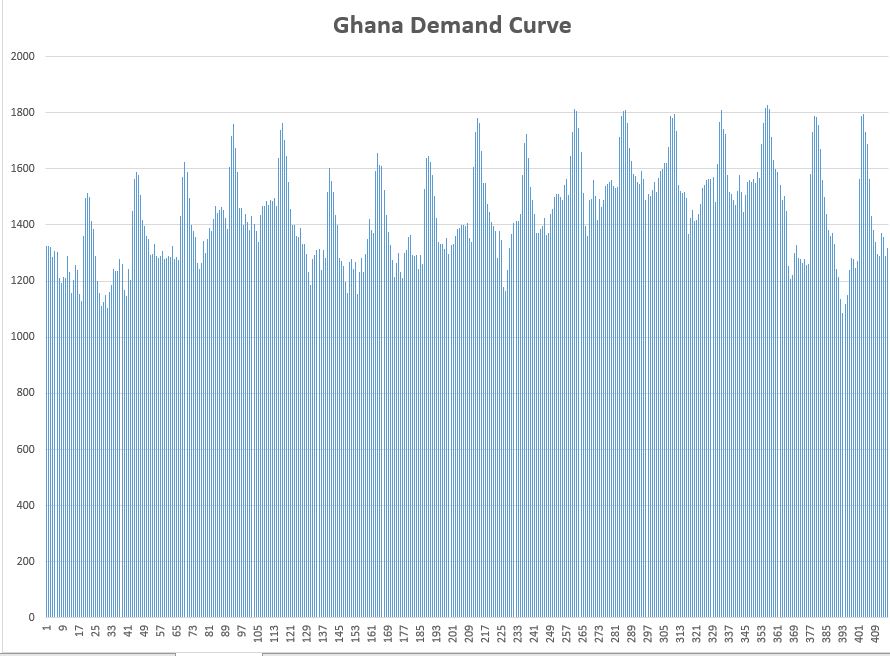
The effect of different demand curves can be significant. Three demand curves are illustrated in the screenshots below. The issue addressed is how to combine the demand curve with the supply curve. The first demand curve is for Chicago in the U.S. The second demand curve is for Korea and the third is for Saudi Arabia.
Data tables have a number of problems for simulation. Instead of using the data tables you create VBA code. The VBA code avoids the necessity to put the data table in a single sheet and it can be used to make the tables more flexible. The code below is an illustration of how to create the VBA.
.

Sub table()

Dim temp_out(9000, 1) As Single
range_name = "P" & Range("row_start") & ":P" & Range("row_end")
num = 1

For Row = Range("row_start") To Range("row_end")
   Range("gross_load") = Cells(Row, Range("column"))
   temp_out(num, 1) = Range("total_cost_for_hour")
   num = num + 1
Next Row

Range(range_name) = temp_out

End Sub

.

The file that you can download from the button below includes a simulation of different prices with different demands and cost structures. It also includes many other electricity issues.
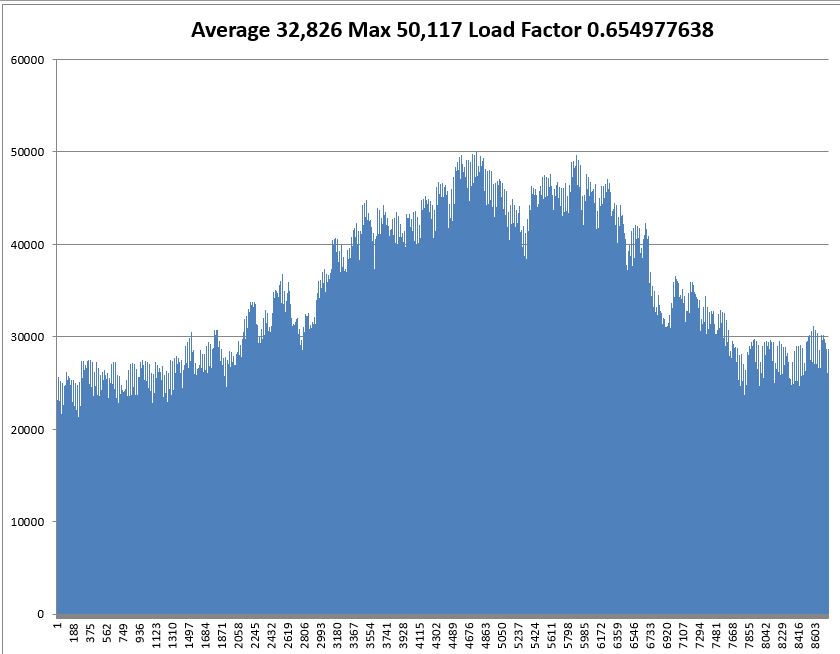
Incorporating Renewable Capacity into the Demand and Supply Analysis
In working through the details of an hour by hour production simulation, you need the amount of the load and also the hour by hour amount of the load reduction caused by solar, wind and hydro.
- For solar, you can get the solar patterns of the day from websites and then adjust for the amount of the capacity
- For wind, you can do something similar, but the analysis is more complex because of power curves
- For hydro, the analysis depends if the hydro is run of the river or storage hydro.
If you want to measure how much solar, wind or hydro power will save for people in the country, you can do the following:
- First, allocate the amount of solar, wind or hydro power to each hour using weather data as explained below.
- Second, incorporate the renewable energy as a reduction in demand so the thermal will dispatch against the net demand and not the gross demand as illustrated on the charts of supply and demand below.
- Third, add up the cost for each hour with and without different renewable strategies. When you add up the cost with a lot of solar, and the cost with not much solar, you can see the effect on costs.
- Fourth, compare the cost savings from solar with the fixed cost of solar where the fixed cost of solar includes the capital cost (cost/kW x CCR) and the fixed O&M cost – Cost/kW-year.
http://re.jrc.ec.europa.eu/pvg_tools/en/tools.html
http://re.jrc.ec.europa.eu/pvgis/apps4/pvest.php?map=africa
http://pvwatts.nrel.gov/
In working through the details of an hour by hour production simulation, you need the amount of the load and also the hour by hour amount of the load reduction caused by solar, wind and hydro.
For solar, you can get the solar patterns of the day from websites and then adjust for the amount of the capacity
For wind, you can do something similar, but the analysis is more complex because of power curves
For hydro, the analysis depends if the hydro is run of the river or storage hydro.
You can illustrate production issues in a single hour with a supply and demand graph. In this case there is a relatively small amount of renewable energy.
With more renewable capacity, the costs decline by different amounts that again depend on the shape of the supply curve.
Demand and Supply with Different Supply Curves and Volatility in Gas Price, Demand and Outages
Sometimes it is better to demonstrate things with a little excel model rather than a gigantic production cost analysis. The point here is the risks from gas price changes, demand changes, outage rate changes are dramatically less when there is a flat supply curve than a steep supply curve.
Excel File with Monte Carlo Simulation of Various Items in the Demand and Supply Curve
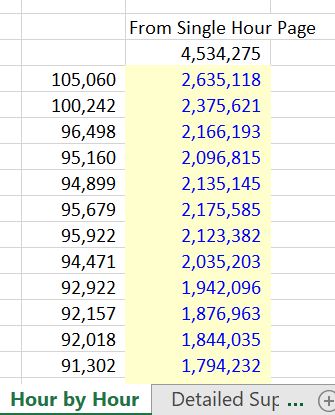
Creating a Simulation from Hourly Bid Data Rather than Cost Data
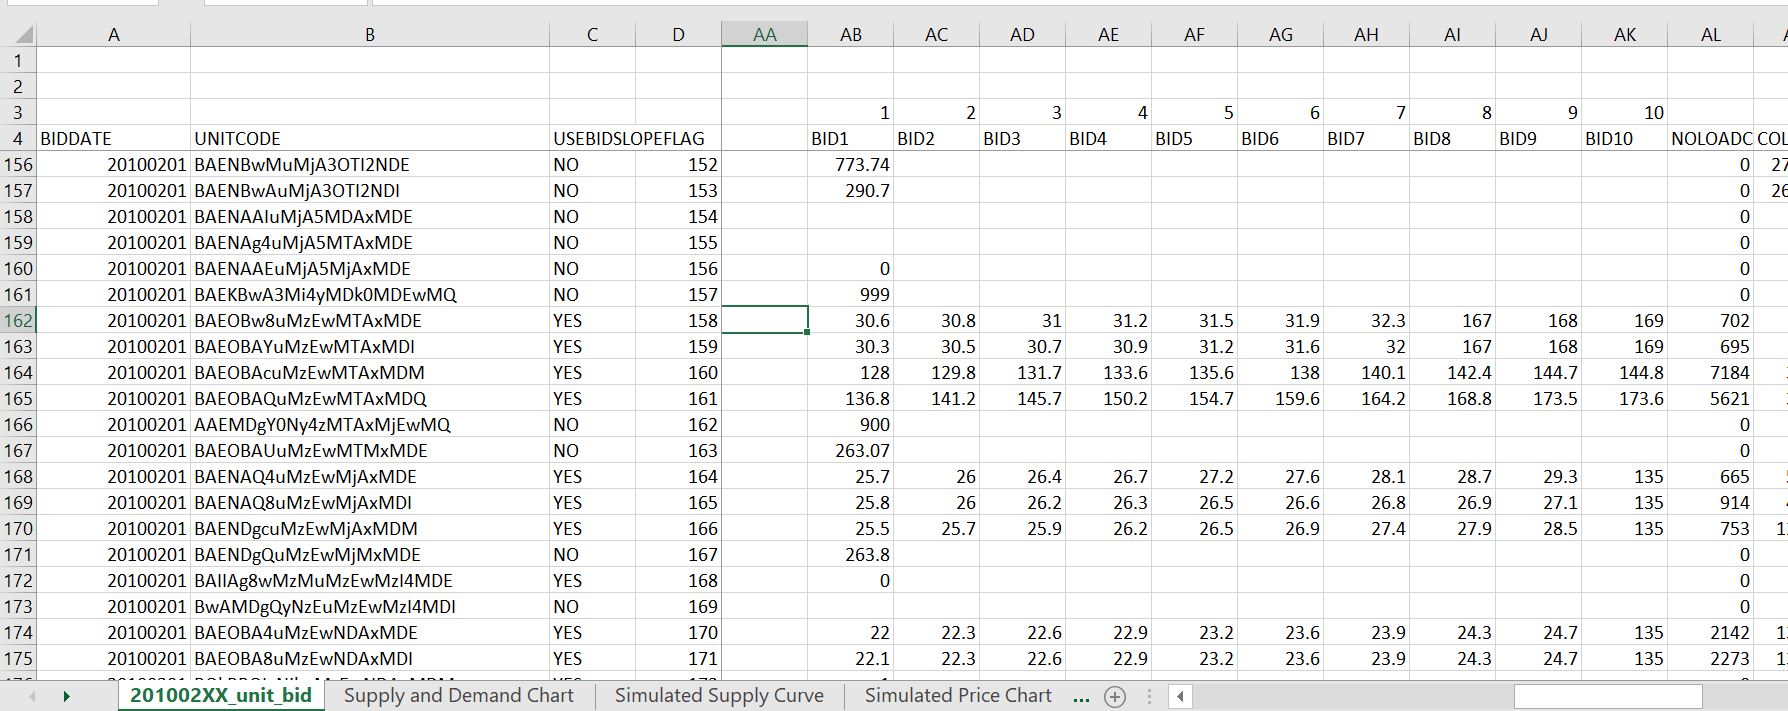
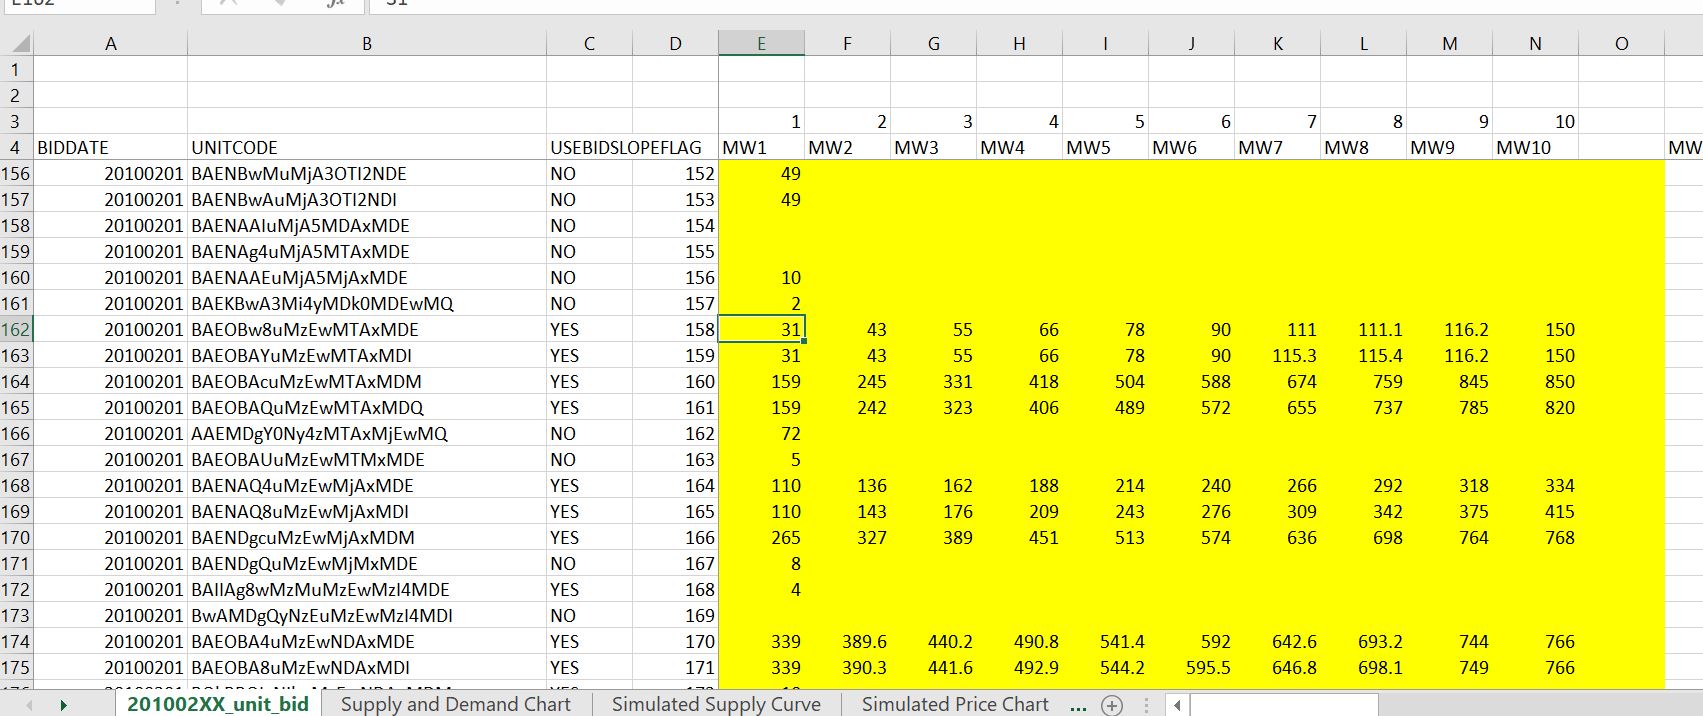
You can create a supply and demand analysis with bids rather than variable costs. In sum markets bids are published a few months after the markets are finished. These bids and capacities can be sorted just like for variable costs. Then you can put the bid supply curve together with loads and simulate prices on an hour by hour basis.
File that Contains the URL Links for Hourly Bids from the PJM Pool and from the NE ISO Websites
The format of the bid data that you can use in creating the supply curve is shown in the two screenshots below.
In working through the details of an hour by hour production simulation, you need the amount of the load and also the hour by hour amount of the load reduction caused by solar, wind and hydro.
For solar, you can get the solar patterns of the day from websites and then adjust for the amount of the capacity
For wind, you can do something similar, but the analysis is more complex because of power curves
For hydro, the analysis depends if the hydro is run of the river or storage hydro. This is explained below.
LCOE and Seven Factors.xls
Price Analysis Exercises.zip
Exercise 1 – Statistical Aspects of Stock Price vs Electricity Prices.xlsx
Exercise 2 – Electricity and Gas.xlsx
Exercise 3 – Hourly Price Analysis (Large File).xlsx
Exercise 4 – Price and Heat Rate Simulation Exercise.xlsx
Exercise 5 – Simple Supply and Demand.xlsx
Exercise 6 – Supply and Demand Simulation.xlsx
Exercise 8 – Maintenance Outage Analysis.xls
Exercise 9 – Incremental Heat Rate Curves.xls
Exercise 10 – Hydro Run of River Analysis.xls
Exercise 11 – Hydro Analysis.xls
Exercise 11a – Peak Shave Exercise.xlsx
Exercise 12 – Price Analysis with Demand Repsonse and Demand Elasticity.xlsx
Exercise 13 – Carrying Charges Analysis.xls
Exercise 14 – Long-term Screening Analysis.xls
Exercise 15 – Equilibrium Prices.xls
Exercise 16 – Transmission.xls
| Subject | Excel File | Video Link | Chapter Reference | Page Reference | ||||
| Simulate Simple Supply and Demand | https://www.youtube.com/watch?v=nM1_vztq6x0 | 33 | 417 | |||||
| Creating Supply Curve with Step Function | LCOE and Seven Factor | https://www.youtube.com/watch?v=OwukvugMCj8 | ||||||
| Incremental Heat Rate Analysis | PJM Analysis | https://www.youtube.com/watch?v=mUvWD2On3ms | ||||||
| Supply Curve Analysis | ||||||||
| Transmission and Locational Marginal Cost | ||||||||
| Load Duration Curve | LDC Exercise | https://www.youtube.com/watch?v=hJ21Ie2NjIY | ||||||
| Long-term Marginal Cost | Long-term Marginal Cost | https://www.youtube.com/watch?v=8YP6FifxcVM | ||||||
| Full Load Duration Curve Example | ||||||||
| ……………………………………………………………………………………………. | … | …………………………………………………….. | … | ………………………………………………………………………………………… | … | ………………………………………. | … | ……………………………………….. |