On this webpage I discuss a number of problems with data tables, and how to repair the problems using simple VBA programs. I demonstrate that relatively simple and short VBA code can be used as an alternative to data tables that the problems. The main principle when using the VBA alternative to data tables is using a FOR and NEXT loop along with the CELLS tool. You can quickly make a one-way or a two-way data table by going around and changing a row or a column cell in the loop and then using the same loop to show the output. You can make the VBA code very flexible so that it can start on different rows and different columns. When making the code flexible, you can use the .ROW and .COLUMN things in VBA (I don’t know the official name) along with .ROWS.COUNT and .COLUMNS.COUNT. You can also make the code flexible so you can use alternative range names for inputs and outputs. The VBA method to make data tables is also a good way work through the fundamental ideas of creating VBA programs. So, on this page I present two different methods to program the data tables. The first method that I present is using an output range and deriving the rows and columns from the range name. The second method uses definitions of row start and row end along with a FOR and NEXT loop.
Instructions for Downloading Files with Macros
.
Some Problems with the Excel Data Table Tool
When you use VBA code instead of data tables you can fix many of the problems. You can illustrate the scenario analysis with a graph because you don’t have to fill in the blank with a number. If you have a big database file while your little file with a data table is open (even with the calculation method adjusted). This will slow things down a lot. Say you do not want to use code numbers but you want to put your sensitivity analysis in another sheet. You will be stuck. If you have a goal seek and would like to make your sensitivity analysis work with the goal seek you will also be frustrated. You can use a crude and unflexible method with row numbers and column number input as illustrated below. In this case, a data table is made with a copy and paste routine.
Sub table2()

For Row = 72 To 74
      Range("leverage1").Value = Cells(Row, 6).Value
       For col = 7 To 9
            Range("idc_1").Value = Cells(71, col)
            copy_paste_fee
            Cells(Row, col).Value = Range("debt1")
        Next col
Next Row

End Sub
VBA code can fix problem with data tables. These problems involve writing a macro that should take two minutes:
- Inputs for the data table must be in same sheet as the data table itself. This is fixed by using range names and changing the inputs with the CELLS function.
- Data tables slow you down when save and open even if using automatic except data tables calculation option is selected
- When you press the F9 to re-calculate, you can mess things up even if you have a large data table
- Because of the restricted formatting when you make a data table, you cannot easily make a graph with the F11 key.
- You cannot use the goal seek with a data table where excel would somehow magically know to run the goal seek function every time the sensitivity tables are run.
- It can be a pain to put the input variables in different sheets when do not use code numbers.
- Data tables cannot be used with copy and paste macros (they can be used with the UDF method).
The code below is for a one way data table that uses the range name OUTPUT. Note how you can create a lot just from the range name using the .ROWS.count. In this case, a scenario number is being used to drive the results and the results are in a single line.
Sub One_Way_Table()

total_rows = Range("output").Rows.Count
total_cols = Range("output").Columns.Count

    For Row = 1 To total_rows

       Range("scenario").Value = Row

       For col = 1 To total_cols
           Range("output").Cells(Row, col).Value = Range("results").Cells(1, col).Value
       Next col

    Next Row

End Sub
Output Range Method of Computing Data Tables
In my revised method, I simply define a range named output that is a square with rows and columns. You can use this square to find the number of rows and columns as well as the starting row and the starting column. You can use the total rows and the total columns in the FOR and NEXT loop and you can also use the starting row and the starting column to create sensitivity ranges for the data table. You can download the file with VBA code by clicking on the button below. The screenshot below the button demonstrates the output of the data table. The key things to add to your VBA include:
The code below is for a two way data table. It includes some colouring and other items. Here the start row and the end row and the start colum and end colum are used with the .ROW and .ROWS,COUNT.
Sub table5()

Range("output1").Clear
Range("output1").Interior.Color = 60000

row_start = Range("output1").Row
row_end = row_start + Range("output1").Rows.Count - 1
col_start = Range("output1").Column
col_end = col_start + Range("output1").Columns.Count - 1

For Row = row_start To row_end

   Range("leverage1").Value = Cells(Row, col_start - 1).Value

   For col = col_start To col_end
     Range("idc_1").Value = Cells(row_start - 1, col)
     copy_paste_fee Cells(Row, col).Value = Range("debt1")
   Next col
Next Row
End Sub
.
.
| rows = range(“output”).rows.count |
| columns = range(“output”).columns.count |
| row_start = range(“ouptut”).row |
| col_start = range(“output”).col |
| row_sensitivity = row_start – 1 |
| col_sensitivity = col_start – 1 |
.
Excel File with VBA Code for Creating a Data Table from the an Output Range with Efficiency Tests
.
[wonderplugin_video iframe=”https://www.youtube.com/watch?v=qHBDGRmUwtA&feature=youtu.be” videowidth=600 videoheight=400 keepaspectratio=1 videocss=”position:relative;display:block;background-color:#000;overflow:hidden;max-width:100%;margin:0 auto;” playbutton=”http://edbodmer.com/wp-content/plugins/wonderplugin-video-embed/engine/playvideo-64-64-0.png”]
.
.
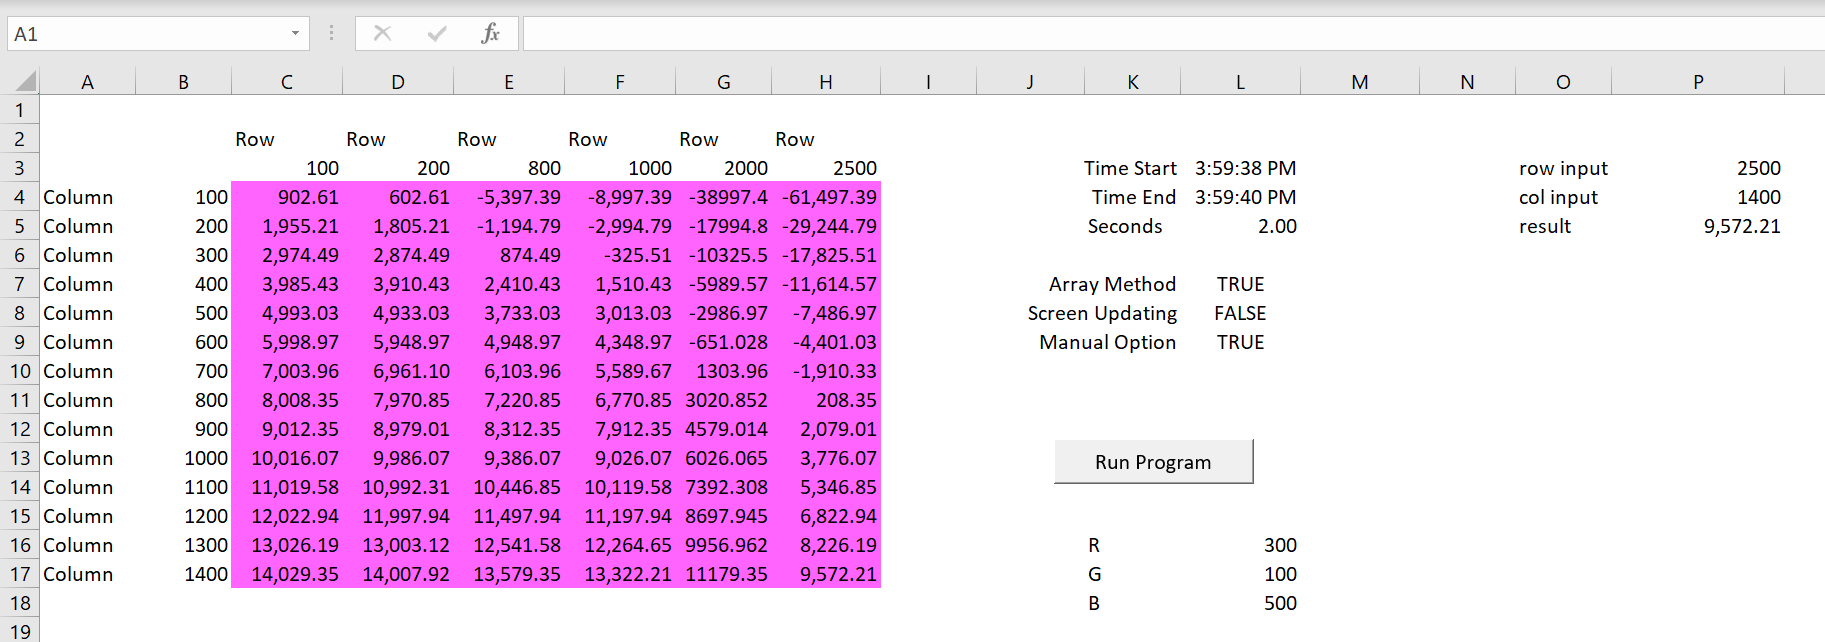
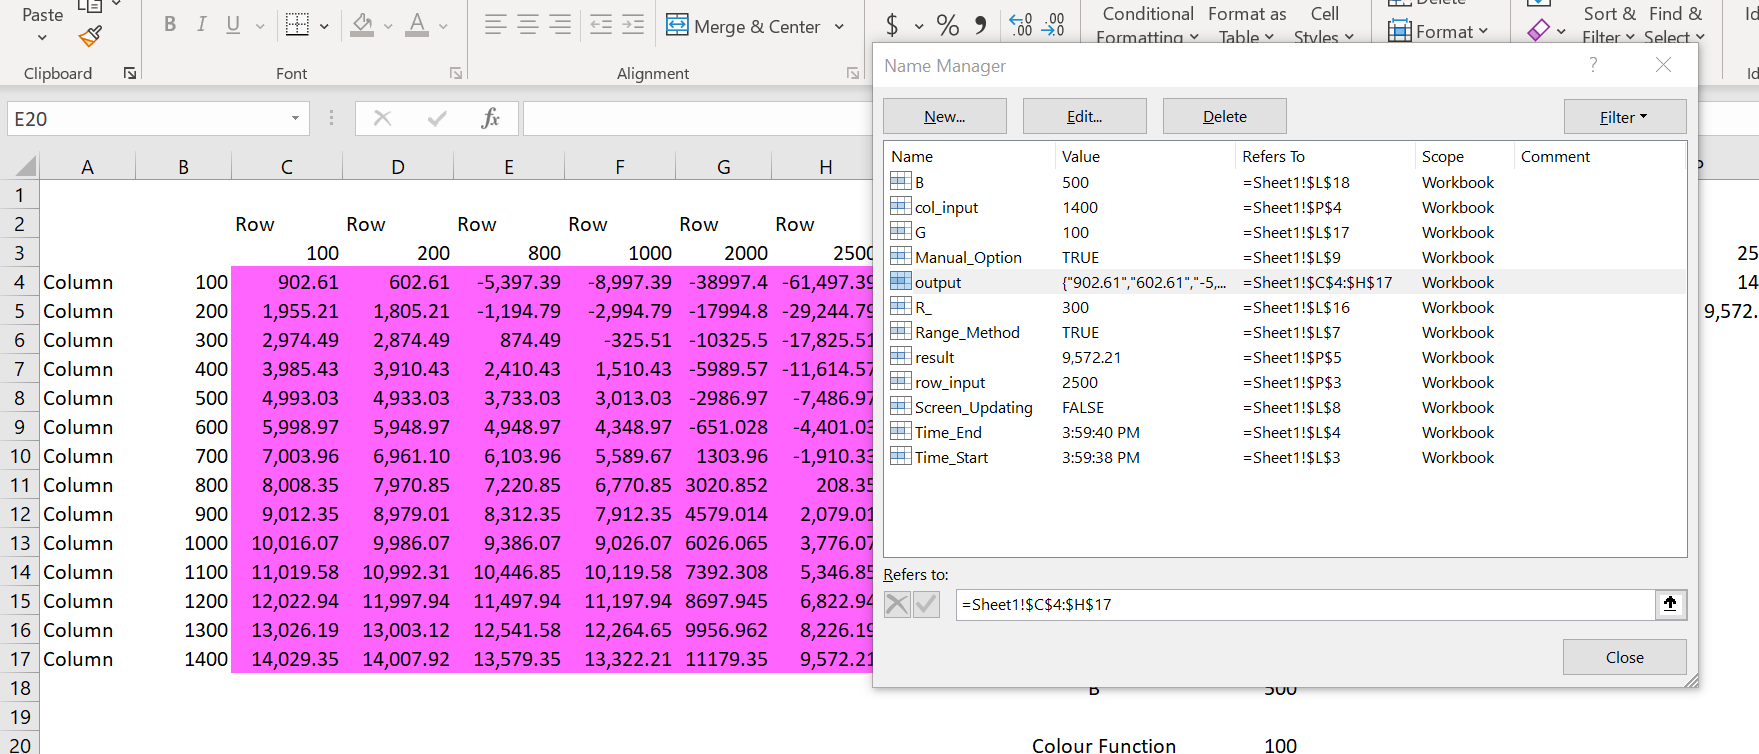
The method works by creating a range name that is illustrated on the screenshot below. You can use CNTL, F3 to change the dimensions of the range name and the data table will change as hopefully shown on the screenshot. This changes the dimension of the FOR and NEXT loop from the range(“output”).rows.count and the range(“output”).columns.count. The VBA code is shown at the bottom of this section.
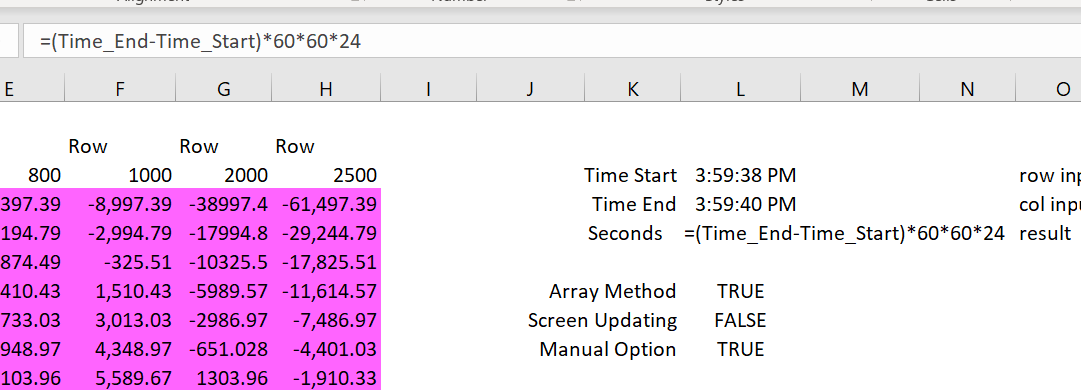
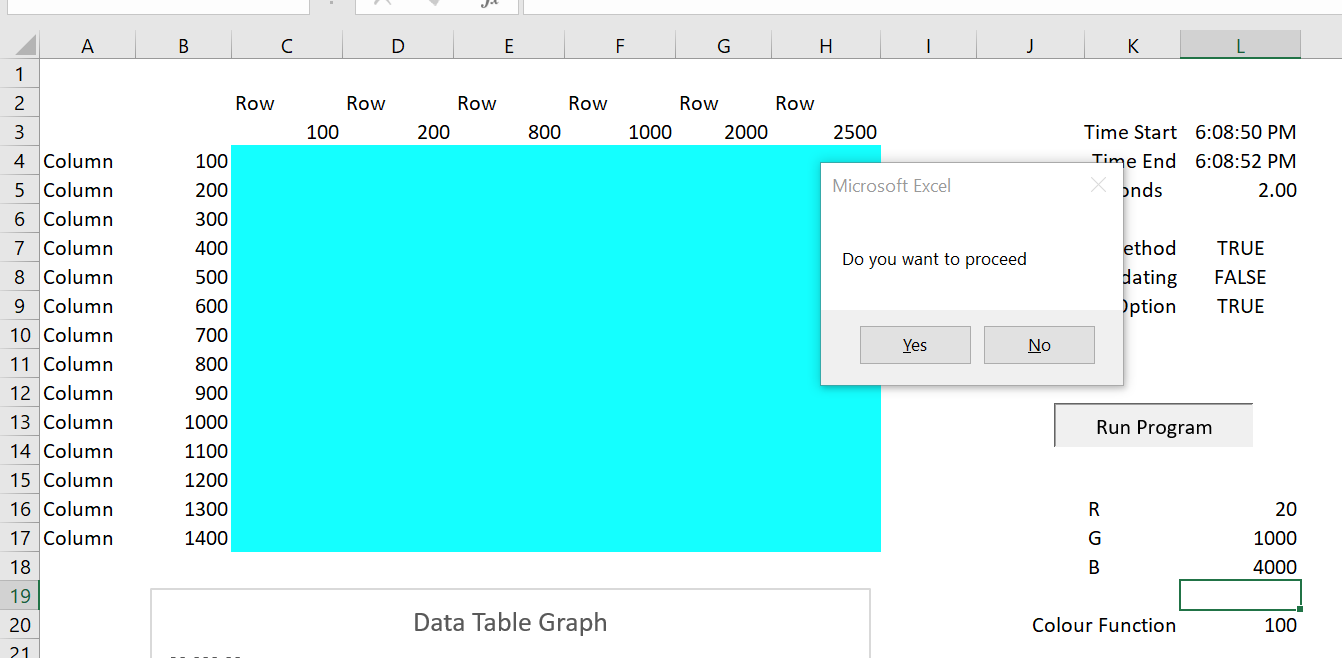
In testing alternative VBA code including only re-calculating the calculation of calculated cell; using the application.screenupdating =false and using an array variable rather than directly writing to the output variable. In evaluating the alternative strategies I have printed the length of time it takes to run the loop. The manner in which the time can be converted to seconds is illustrated in the screenshot below. To present the time, you can use the Range(“Start_time”) = time before the loop and the statement Range(“End_time”) = time after the loop. This is illustrated in the screenshot below.
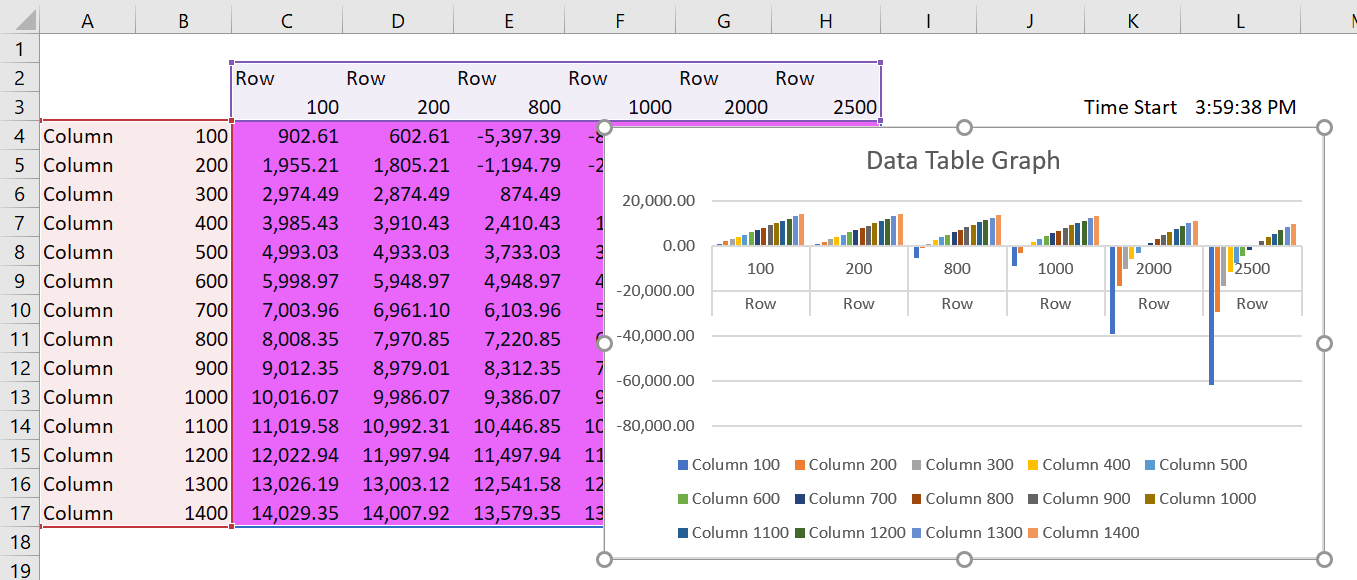
The screenshot below illustrates how you can make a graph from the data table. This is not possible with the normal data table because of the formula between the row and the column. Remember that the row and the column title must be blank for the x-axis to be used.
The screenshot below illustrates how you can change the colour of the output range with the code range(“output”) = RGB( red number, green number, blue number). In this case the red, green and blue codes are read in from the excel sheet. The code for this is shown in the VBA code below.
.
test


Sub table()

 ' When you change to manual and define the calculation area you can speed up a lot

    current_status = Application.Calculation
 ' Get the current calcluation method

    If Range("Manual_option") Then Application.Calculation = xlCalculationManual

' Change to manual

    Application.ScreenUpdating = True
  ' To show the cleared area

    MsgBox " Before clear "
 ' Standard mgsbox

    Range("output").ClearContents
 ' Clear out the range

    Application.ScreenUpdating = False
    If Range("screen_updating") Then Application.ScreenUpdating = True

    range_method = Range("range_method")
 ' read the true or false from the sheet

    Dim result() As Variant
  ' sets-up a flexibe array variable

    test = MsgBox(" Do you want to proceed ", vbYesNo)
' put a question in msgbox

    If test <> 6 Then Exit Sub
' exit the sub if not equal to 6=true

    Range("output").Interior.Color = RGB(Range("R_"), Range("G"), Range("B"))
' try the RGB with the output

    Total_Rows = Range("output").Rows.Count
 ' Use the .rows to find the total rows

    Total_Columns = Range("output").Columns.Count
 ' Use the .columns to find the total rows

    ReDim result(Total_Rows, Total_Columns)
    ' Used for the range method

    start_row = Range("output").Row
 ' The start row for the range name

    start_col = Range("output").Column
  ' The start column

    Range("time_start") = Time
              ' put the start time in the sheet

    For Row = 1 To Total_Rows
 ' Start of nested loop

        Range("col_input") = Cells(Row + start_row - 1, start_col - 1)
' Key -- define the column input

        For col = 1 To Total_Columns
' loop around columns

            Range("row_input") = Cells(start_row - 1, col + start_col - 1)  ' Go around columns and set the row input

            Range("result").Calculate
' Only calculates the output cell -- the key to making the model work fast

             If range_method = False Then Range("output").Cells(Row, col) = Range("result")  ' Simple methood

             If range_method = True Then result(Row, col) = Range("result")  ' Puts output into an array to make faster

        Next col

    Next Row

    If range_method = True Then Range("output") = result
 ' If put into array, fill up output with value

    Range("time_end") = Time

    Application.Calculation = current_status
 ' Reset the calculuation method to the original

End Sub
Data Table using Prior Method with Row Start, Row End, Column Start, and Column End
I have made a simple file that demonstrates how to make multiple data tables and solve the problems with data tables in excel. This file includes the VBA code that is demonstrated in the video below and creates four different flexible data tables from the valuation analysis.
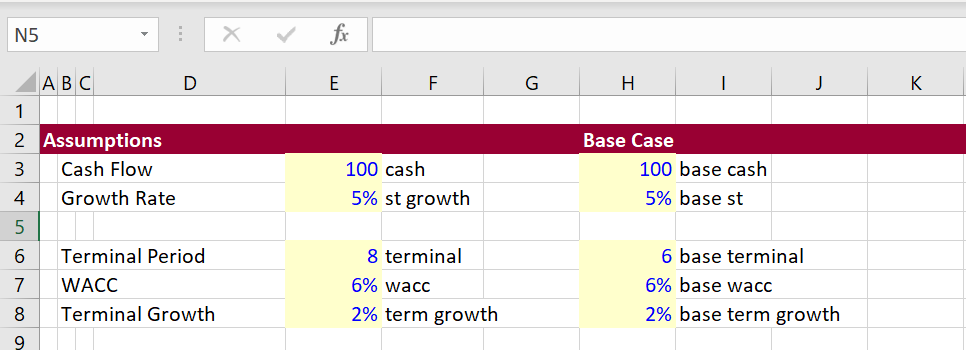
I am using the case of building data tables with VBA to demonstrate some VBA principles of FOR/NEXT and using VBA with the INDEX function in excel. In the exercise, I use a very simple valuation example where we want to investigate the effect of WACC, Terminal Growth, Short-term Growth and the length of the explicit period. The screenshot below illustrates the inputs. Note that I put names next to the inputs and I used the SHIFT, CNTL, F3 keystrokes to make named ranges. I also put the base case values with range names next to the values that are used in the model. The range names are important because they are used in the VBA code.
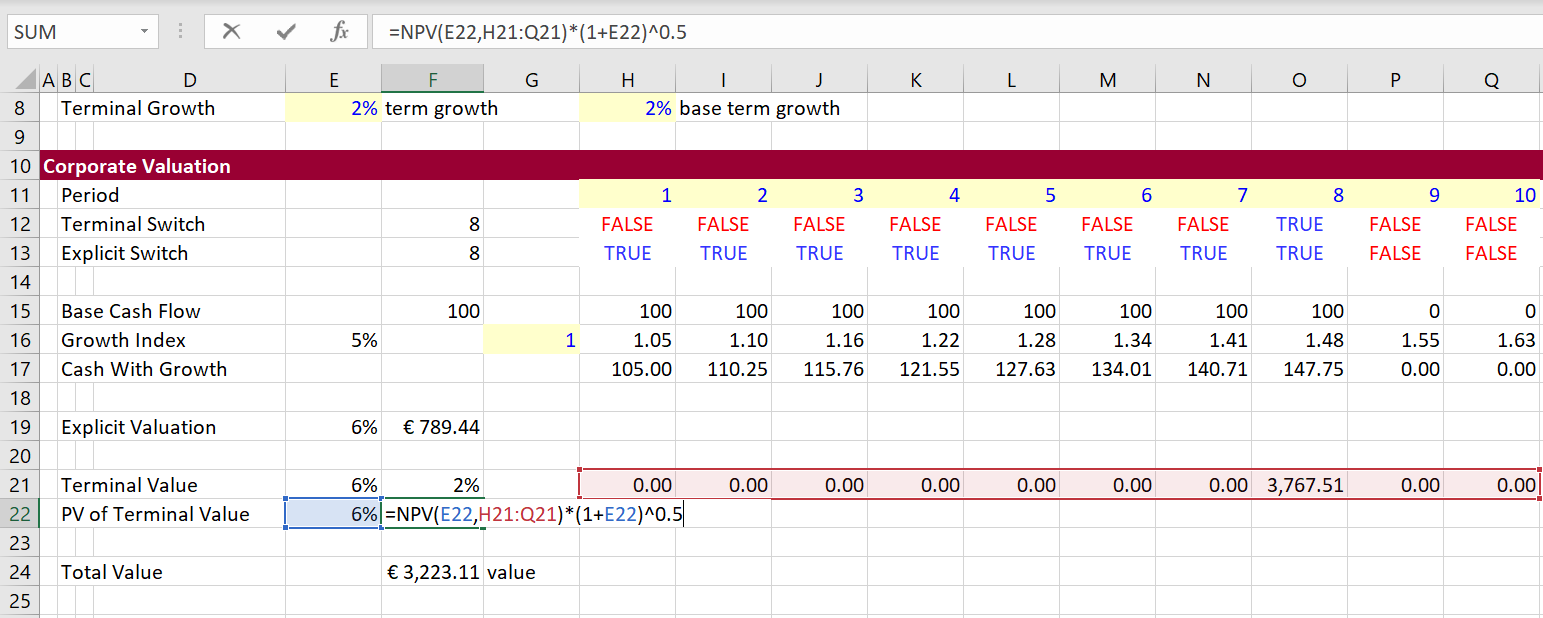
The second screenshot demonstrates the model with outputs that will be used in the data tables. Note that I put a name next to the total value and next to the terminal value which will be outputs of a series of data tables. The model allows you to use alternative terminal value dates and includes a half-year convention. I pretend that you want a whole lot of data tables with different explicit periods; different short-term growth rates as well as the WACC and the terminal growth which are in almost every sensitivity table.
Now let’s move to creation of the data tables in a new sheet. The data tables will not have the irritating thing in the middle that prevents you from making graphs. The format of the graphs is shown in the screenshot below. Note that I have chosen different variables for the row and column input.
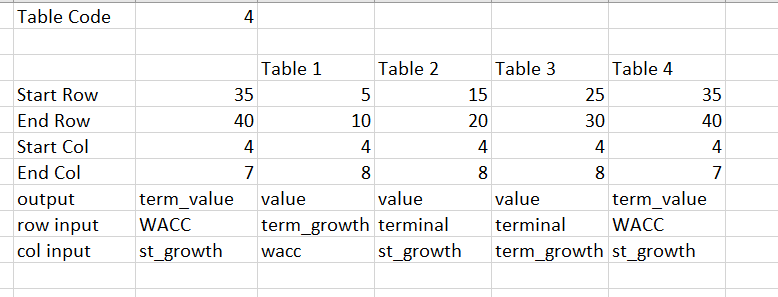
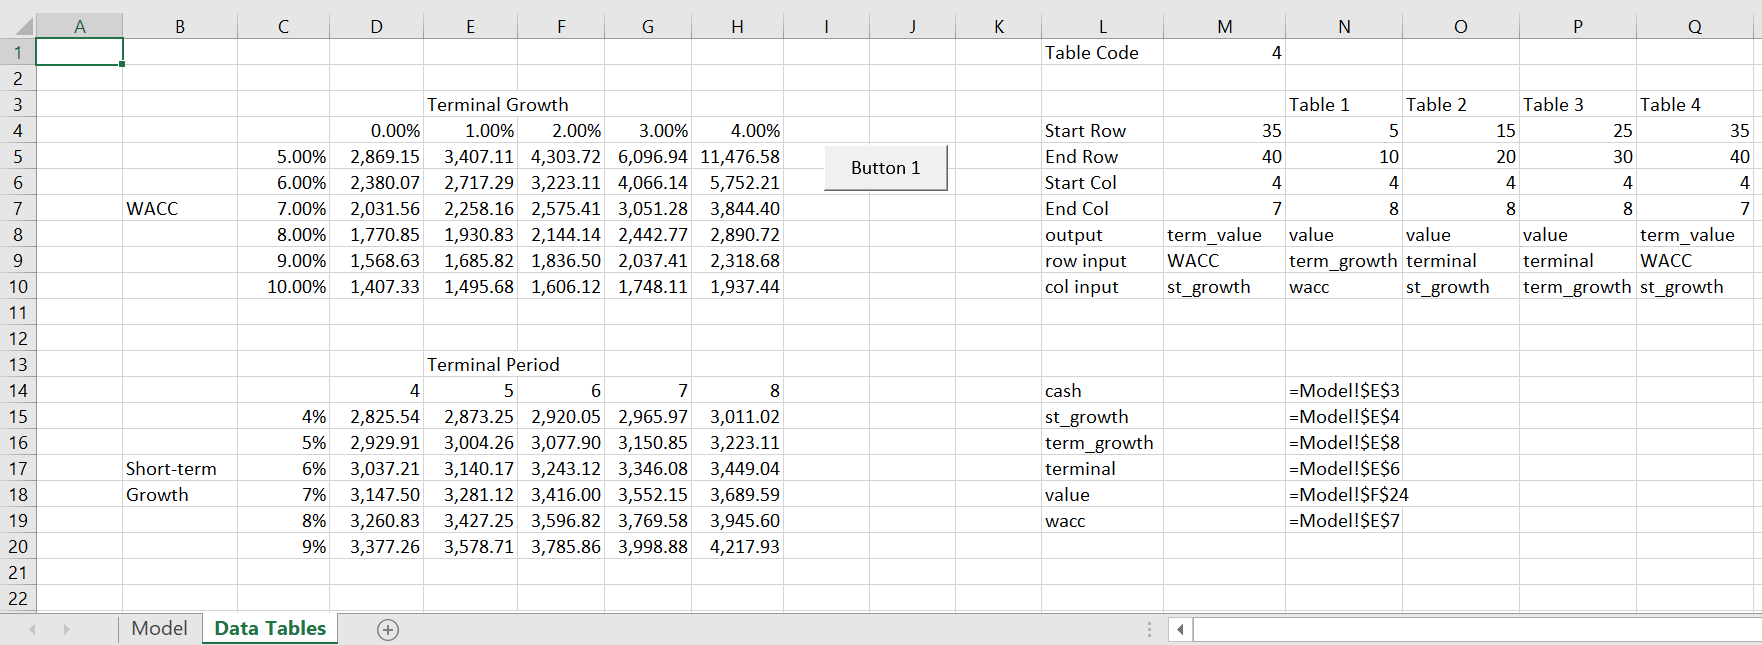
To make the data tables, define the row start, row end, column start and column end. Then also define the range names that will be used for the row input and column input. When entering the data, use in INDEX function so that you can choose alternative data tables. The VBA code will move through the different data tables by changing the code number. The values that are currently in use are in the left hand side of the table. As the data table 4 is in place, the start row is 35 and the start column is 40 and the output is the terminal value. You can make as many data tables as you want and this will work with by changing code number that is shown is 4 in the example below.
Now lets run the data table. This is done with VBA code that loops through the rows and columns of the data table defined from the range names shown in the screenshot above. The VBA code is illustrated at the bottom of this explanation.
The VBA code is shown below. There are two programs. The first program creates one data table with FOR/NEXT and the CELLS statements. You go up one row from the start row to define the series of row scenarios. You go one to the left to get the column scenarios associated with the column input. The code includes an error check and at the end of the data table I re-assigned the data to the base case.
.
Sub table()

'cash
'st_growth
'term_growth
'terminal
'Value
'wacc

For Row = Range("start_row") To Range("end_row")

Range(Range("col_input")) = Cells(Row, Range("start_col") - 1)

For col = Range("start_col") To Range("end_col")
Range(Range("row_input")) = Cells(Range("start_row") - 1, col)

On Error GoTo out_of_loop:
Cells(Row, col) = Range(Range("output"))

back_to_loop:

Next col
Next Row


'
' Reset the values to base case
'

Range("cash") = Range("Base_cash")
Range("st_growth") = Range("Base_st")
Range("term_growth") = Range("Base_terminal")
Range("wacc") = Range("Base_wacc")
Range("term_growth") = Range("base_term_growth")


Exit Sub

out_of_loop:

Resume back_to_loop:

End Sub

.
The second VBA code demonstrates how to create multiple data tables from this code. You define the code used in the INDEX excel function. Then you use a FOR/NEXT loop to change the index code number.
.
Sub all_tables()

For table_no = 1 To 4

Range("table_code") = table_no
table

Next table_no

End Sub

.
.
Graphs with Data Tables made by VBA
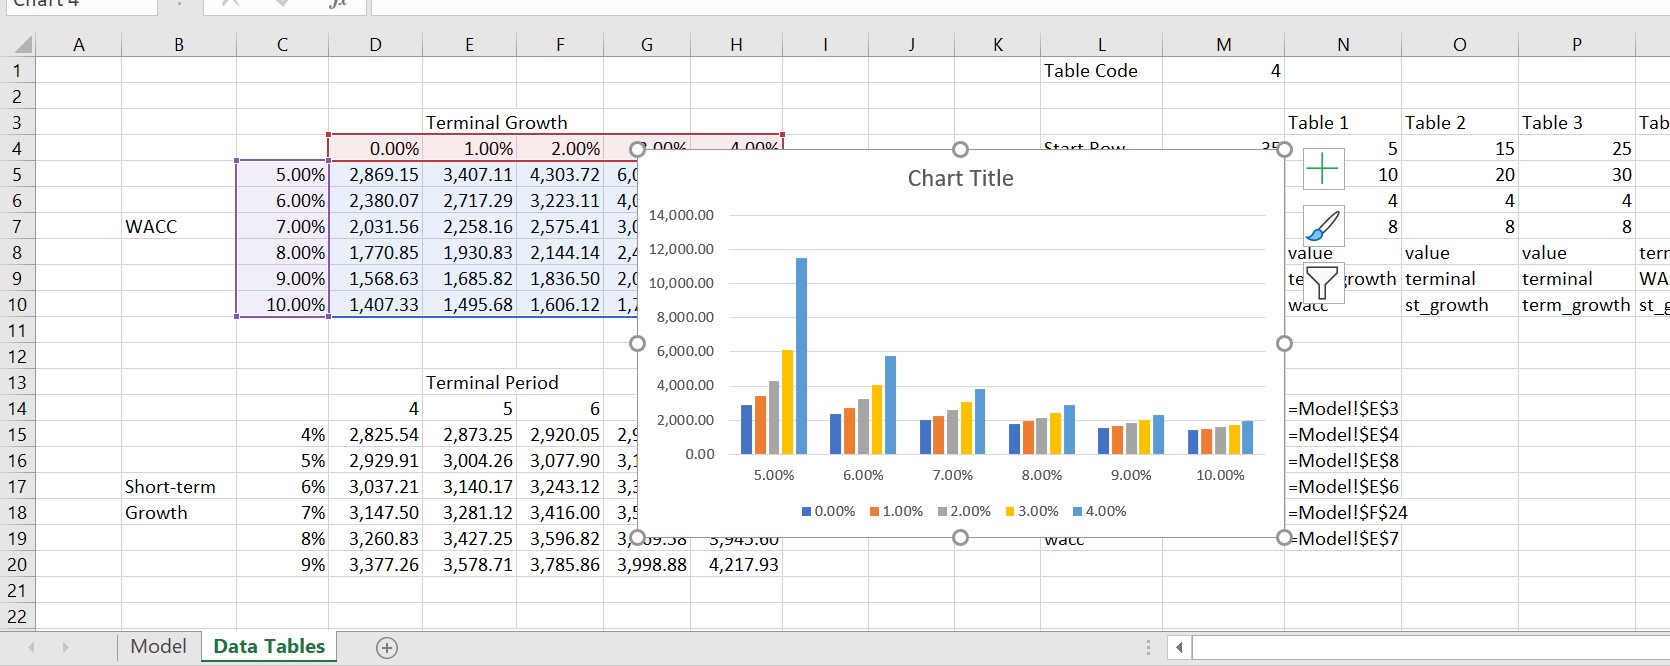
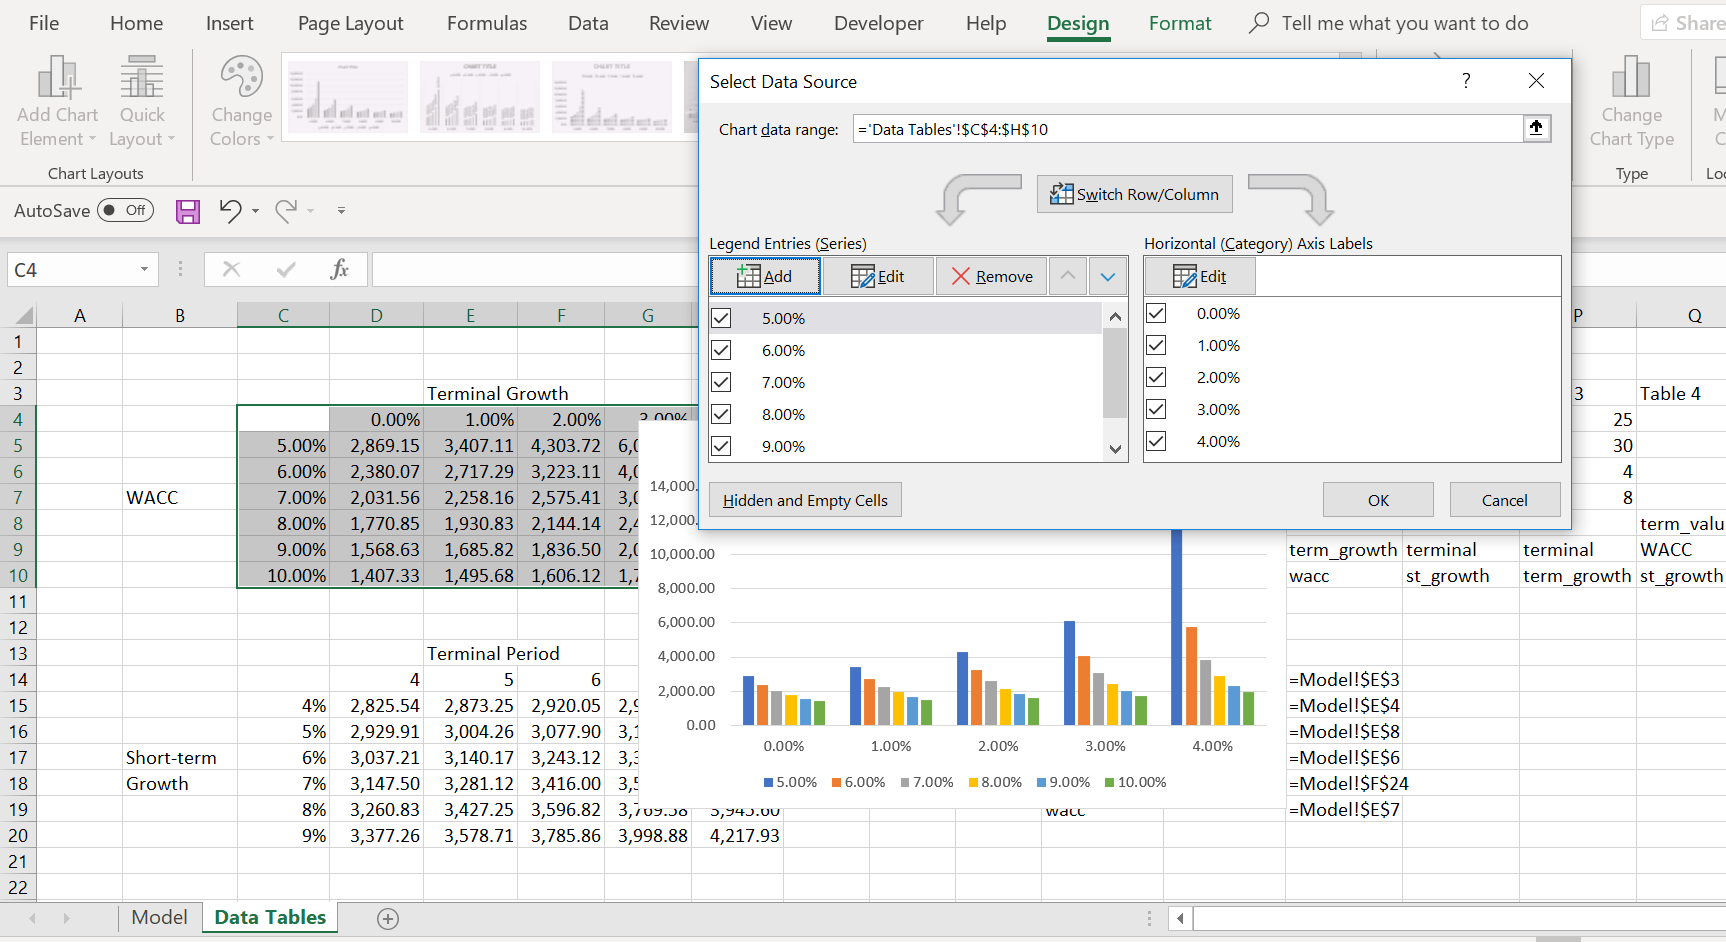
One of the things I really hate about data tables made with excel is that you cannot quickly make graphs because of the number at the top left of the table. With the VBA method you have much more flexibility. With the data tables created from the code shown in the associated file, you can select the area of the table including the row and column sensitivity variables. Then you can press F11 or press ALT and F9. This will create a graph that shows the inter-relationships between the variables. This is demonstrate in the screenshots below. The second screenshot shows how you can change the row and column variables by clicking on the select data thing.
Video Explanations
[wonderplugin_video iframe=”https://www.youtube.com/watch?v=UIeSTdiPNik” videowidth=600 videoheight=400 keepaspectratio=1 videocss=”position:relative;display:block;background-color:#000;overflow:hidden;max-width:100%;margin:0 auto;” playbutton=”http://edbodmer.com/wp-content/plugins/wonderplugin-video-embed/engine/playvideo-64-64-0.png”]
.
.
[wonderplugin_video iframe=”https://www.youtube.com/watch?v=GfhlYG5rxRc” videowidth=600 videoheight=400 keepaspectratio=1 videocss=”position:relative;display:block;background-color:#000;overflow:hidden;max-width:100%;margin:0 auto;” playbutton=”http://edbodmer.com/wp-content/plugins/wonderplugin-video-embed/engine/playvideo-64-64-0.png”]
Speeding up Data Tables by Assigning the Output to a Range Name
Going around rows and columns can take some time. To speed things up you can assign the output to an array variable. This is demonstrated in the little test VBA code below.
.

Sub table()

Dim temp_out(9000, 1) As Single

num = Range("row_end") - Range("row_start") + 1

range_name = "P" & Range("row_start") & ":P" & Range("row_end")

num = 1

For Row = Range("row_start") To Range("row_end")

Range("gross_load") = Cells(Row, Range("column"))

temp_out(num, 1) = Range("total_cost_for_hour")

num = num + 1

Next Row

Range(range_name) = temp_out


End Sub


.
.