This webpage includes a database of merchant electricity spot prices in the Philippines. Spot prices in the Philippines are named wholesale electricity spot market prices or WESM. With this database you can see the story of building new plants and correlation with natural gas and oil prices. My general idea in compiling this data is that you should be able to find historic electricity prices and evaluate things in the same way that you can find stock prices and try to understand why things have changed. As you can find stock prices for just about any publicly listed company in the world, my question is why cannot you find similar historic data for electricity prices in major markets for countries with large populations such as the Philippines. If you could find this stuff easily, then I would not need this website. You can also see the prices in USD/MWH so you can compare the prices to prices in other regions. Specifically, when the prices are a lot higher for the Philippines then for other regions, you have the right to ask whether this is sustainable as investors can build the same kind of plants in the Philippines as in other markets. For this you have to find exchange rates for the Peso an the USD which is not published in the same manner as other exchange rates. The file below includes a database that begins in 2006 when the market began. As with other merchant market pages, there is a step by step explanation of how to update the prices. The WESM prices are converted to USD as with other prices and compared to coal and oil prices.
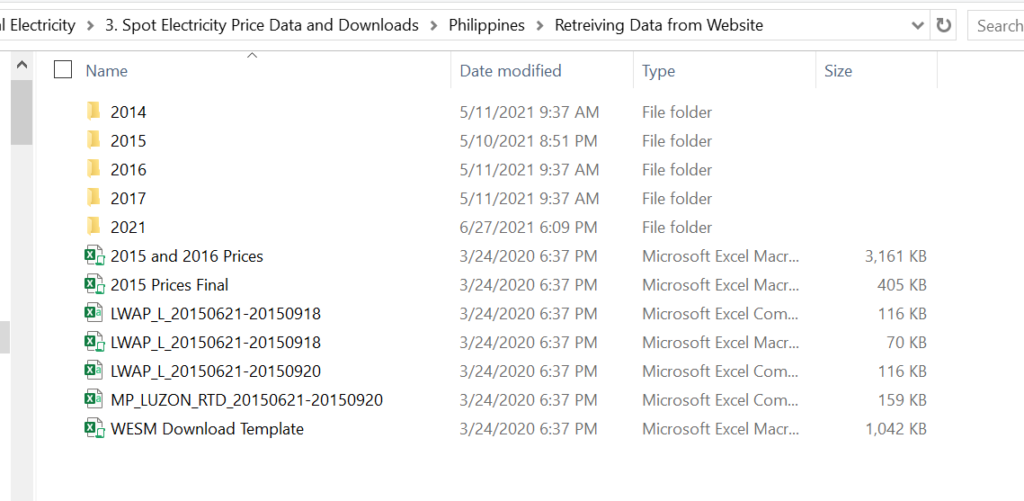
The Philippines has had a merchant electricity market since 2006. There are different prices for different regions (islands), the largest of which is Luzon. These prices are updated periodically (when I have the honour to go and visit Philippines). It is a bit painful to get hourly data for WESM electricity prices in the Philippines because you cannot read directly from one single source and use an automated download technique. The files that contain the hourly prices for WESM merchant prices are shown below. I don’t think you cannot go anywhere else and find excel files with all of the hourly data. Before continuing, I note that the historic data I collect is named GWAP. I believe this stands for generalized weighted average price.
.
.
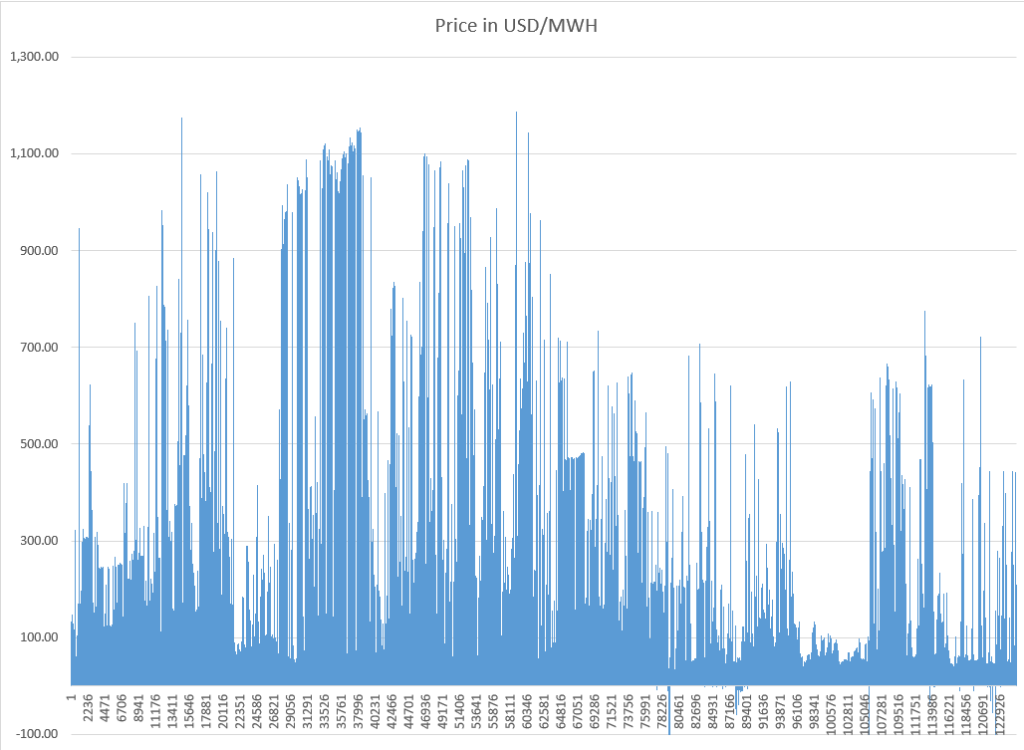
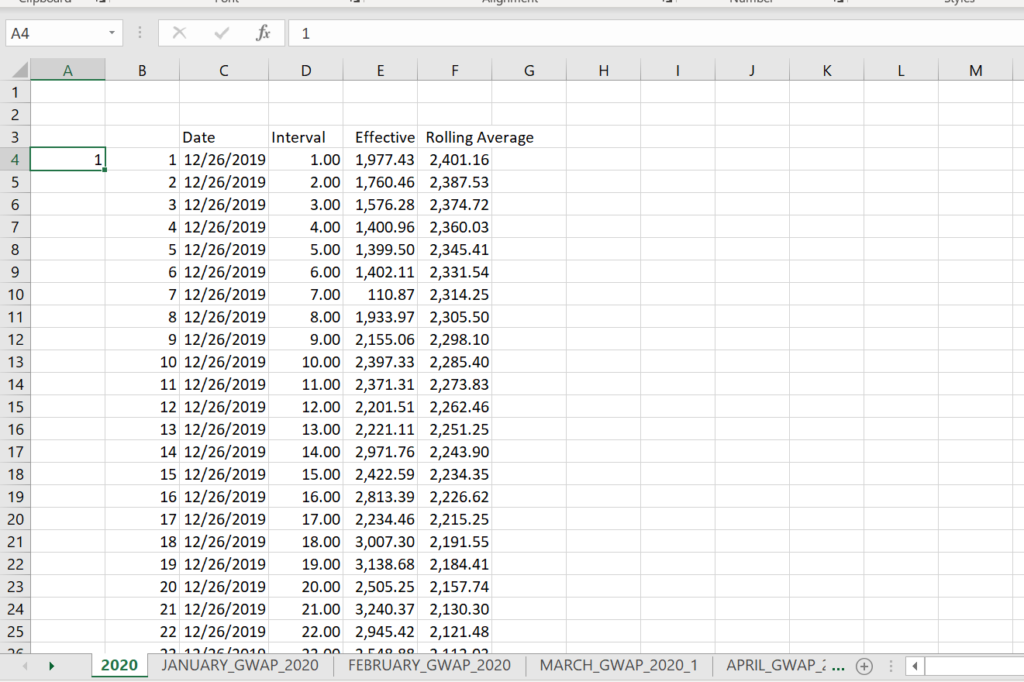
The hourly prices over time are shown below. You can see a general tendency to of decreasing prices. But there are still a lot of price spikes.
.
.
.
.
.
.
Updating the Database
In developing a database of merchant prices, I think the aim is to make an hour by hour file that is flat. This means that prices of electric power in different currencies as well as natural gas prices and coal prices are in a single column with multiple rows. After you get this, you can use all kinds of LOOKUP’s, AVERAGEIF’s, MATCH’s and INDEX’s to put together different kinds of analysis. For me, when I update the files and maybe for you, I begin by describing how to update (and create) this big flat file which is a page in all of the merchant plant databases. As with many things in life, you can try different things in different files on a kind of random basis and then find something that is really effective. A few of these things are to created a column with the year so you can navigate with the CNTL up and CNTL down. Also using ALT, E,I S with 8760 or 8784 to count the hours in a year is very helpful. Finally, using date counters when you add 1/24 instead of 1 to count by hour is very helpful. As I wrote above, every time I go to the Philippines, I sit in a little hotel room and I update the database. As with other merchant electricity prices, I initially tried to make the process automatic where I could just press a button and the whole thing would be updated immediately. The general website for WESM prices is:
In updating the database, I use the following steps which are pretty manual:
- Find the website with GWAP monthly files (which can be a pain)
- Download each monthly file separately, they will come with names like June_2021
- Put the monthly files together into an annual file using Alt, E, M (for example, make a file for 2021)
- Compile the data into a single column for the entire year in the annual file. You can use the EIS a lot and copy the left hand columns with the month and hour counters from a previous non-leap year or leap year file.
- Insert the yearly files in the main database and create row numbers of 8760 or 8784 to link in the data. You don’t need to get too fancy with INDIRECT as the process is manual.
So, here is the step by step process for updating the UK price data. As with other databases it is helpful to use the following data format for the hours and the days. I use this so that I am not confused by U.S. date formats. Press CNTL, 1 to get the format etc.
d-mmm-yy h:mm;@
STEP 1: Put Together the GWAP Prices from Monthly Files
Go to the WESM website and download month by month data in separate CSV files. Your can keep them in a different folder if you want. The URL for retrieving the these prices — the Generalized Wholesale Average Price (GWAP – maybe the abbreviation is wrong) is at the following link. You use this link to supplement the first file listed below that is named WESM Download template.
This step of the process is illustrated below. I found this by searching for WESM price archive. It can be painful to find and you may see some details on Luzon prices. But this does not allow you to get much history and you would have to make an update every three months. Notice how it says that the site is not secure. Then you just start downloading the files and put them in a directory somewhere.
Step 2 – Put together the Prices in the Master Database
The second step is to put updated prices from all of the files that you download in the comprehensive database.
- Put the monthly files together into an annual file using Alt, E, M (for example, make a file for 2021)
- Compile the data into a single column for the entire year in the annual file. You can use the EIS a lot and copy the left hand columns with the month and hour counters from a previous non-leap year or leap year file.
You can go to the file named WESM Hourly Database and then go to the sheet named current prices. Copy and paste the GWAP prices into the this current prices sheet of the database. Then, when still on the current prices sheet, add 1/24 to the last date to get the titles in an hourly format. The numbers in column a can be incremented — they are there just so you can keep track of the number of hours you read in.
After you have read in the current prices, stay in the WESM Hourly Database and go to the page named “Hourly Database.” Then put the counter in column 2 that is the same as the one in the “Current Prices Sheet.” This allows you to copy easily by double clicking on the data.
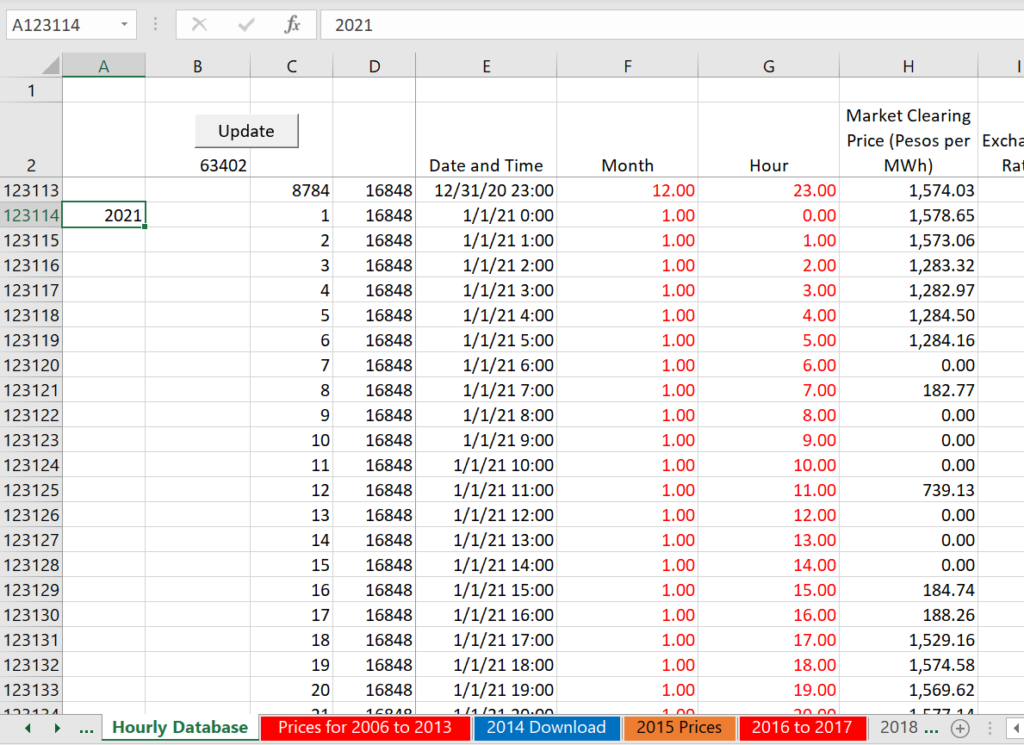
The first file is named WESM_HOURLY_DATABASE. This file includes hourly prices since the beginning of the market in 2006. That is a lot of hourly data. The screenshot below shows that there are more than 123,000 prices since the market inception. The screenshot also shows how you can put the year number in column A and then count by 8760 or 8784. The dates are determined by adding 1/24 to the previous hour. If you have compiled the prices correctly, the dates should conform to the dates that you get by linking. Finally, when you put together the database, you will have to make an adjustment for the month of December.
STEP 3: Incorporate Philippine Exchange Rate
To complete the process you need to put the Philippines Exchange Rate and Commodity price data into the WESM Hourly Database file. The Philippine Peso to USD exchange rate is a pain because it is not in FRED and the sources have changed. I found a website that has the daily data and created a file you can use to read the data. This file is named “Get Historic Exchange Rates” as shown in the file list above. I made a video that shows how to use this file that is shown at the bottom of the page. For the latest update
https://excelrates.com/historical-exchange-rates/USD-PHP
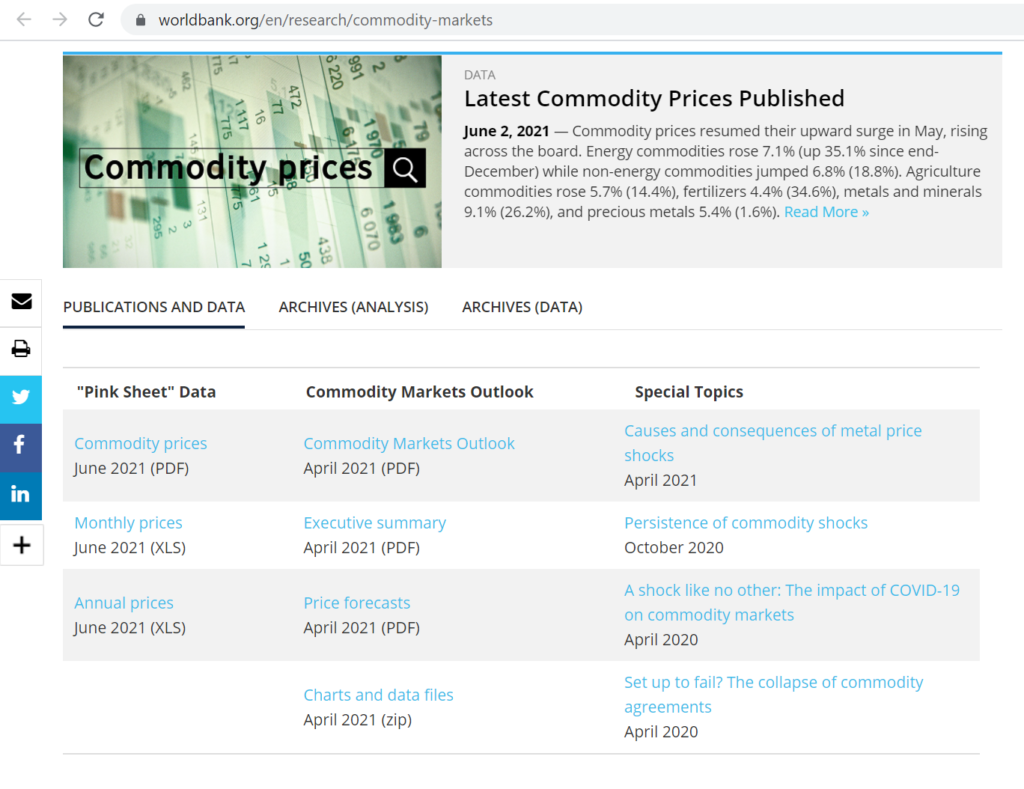
As with the other merchant price data files, the commodity prices can be obtained from the World Bank Pink Data file. (You may need to check that the link is current because unfortunately the World Bank sometimes changes the url.) Get the commodity price excel file (shown above) and then update the file. Put the monthly prices in the PINK DATA sheet. For the 2021 update, the link is:
In this file, the prices PHP are converted to USD using a current exchange rate and then compared to natural gas prices in Asia using the world bank PINK data. Because the file is so big, there is no valuation analysis of different kinds of plants. The second file is the WESM_VALUE_ANALYSIS. This file includes alternative graphs and value of different generating technologies evaluated against the market prices.
. To put the database together in USD you also need the Philippines/USD exchange rates. The file that you can download below includes exchange rates and allows you to update the database. This database includes more exchange rates than the exchange rates available from the FRED website. You can see the mechanics of putting this database together by going to the currency database sheet. .
.
Lets say that you want to update the file. To do this, I have created a three step system to track historic price data, translate the price to USD and then put together a history of hourly merchant prices in USD/MWH. The reason I want USD per MWH is so that prices in the Philippines can be compared with prices around the world. You can also evaluate the profitability of solar and other resources against the market price. Here are the steps to putting together a comprehensive database of the Philippines WESM prices:
You may have to update the URL for the monthly data using the world bank data. To do this, go to the world bank website on commodity prices using the link:
The link that was relevant for 2021 prices is the link below. It is very possible that this link will change and you will have to update the file to read the natural gas prices.
STEP 4: To complete the process, open the WESM VALUE ANALYSIS file and paste special the database file data. You may have to go to the NAMES page and add space to the dropdown boxes. In addition, you may have to go to the “data analysis for graph” and insert added formulas at the left columns.
Lessons from Historic Database of Philippines Merchant Prices
Once you have put together the together the file named WESM Hourly Database, you can do a lot of analysis. Some analysis of the economic value of different technologies in the file named WESM Value Analysis (which is a very large file because of analysis with hourly data). To manage this file you should first copy the data from the hourly database into the file. This file has a whole bunch of advanced techniques for graphing data with different time scales and do other analysis.
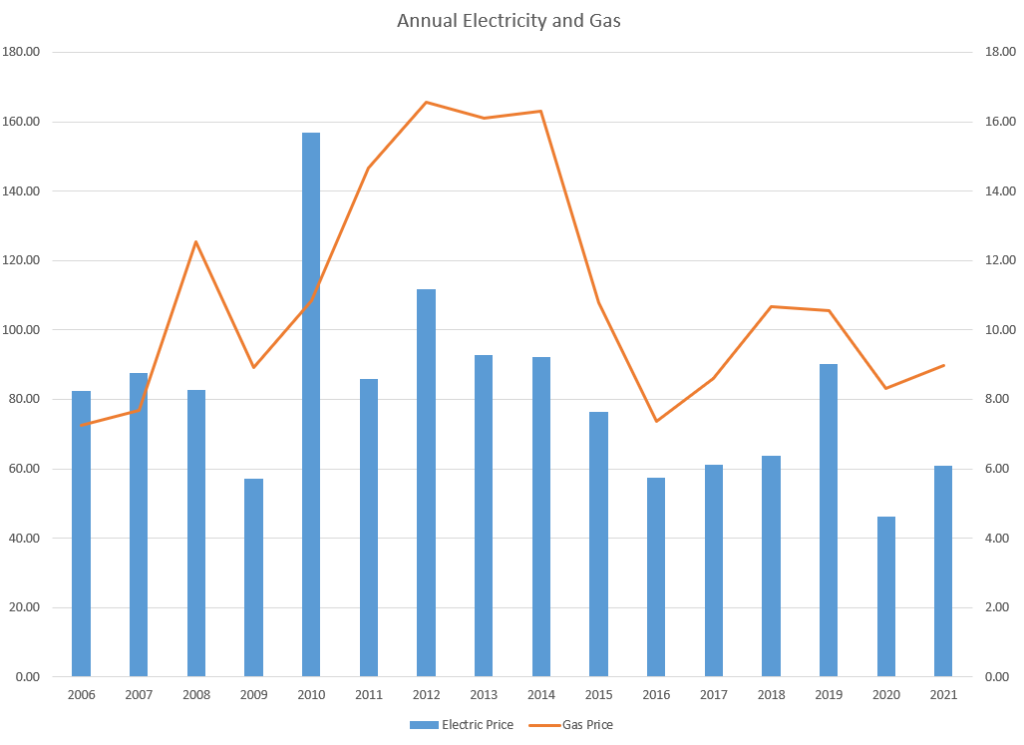
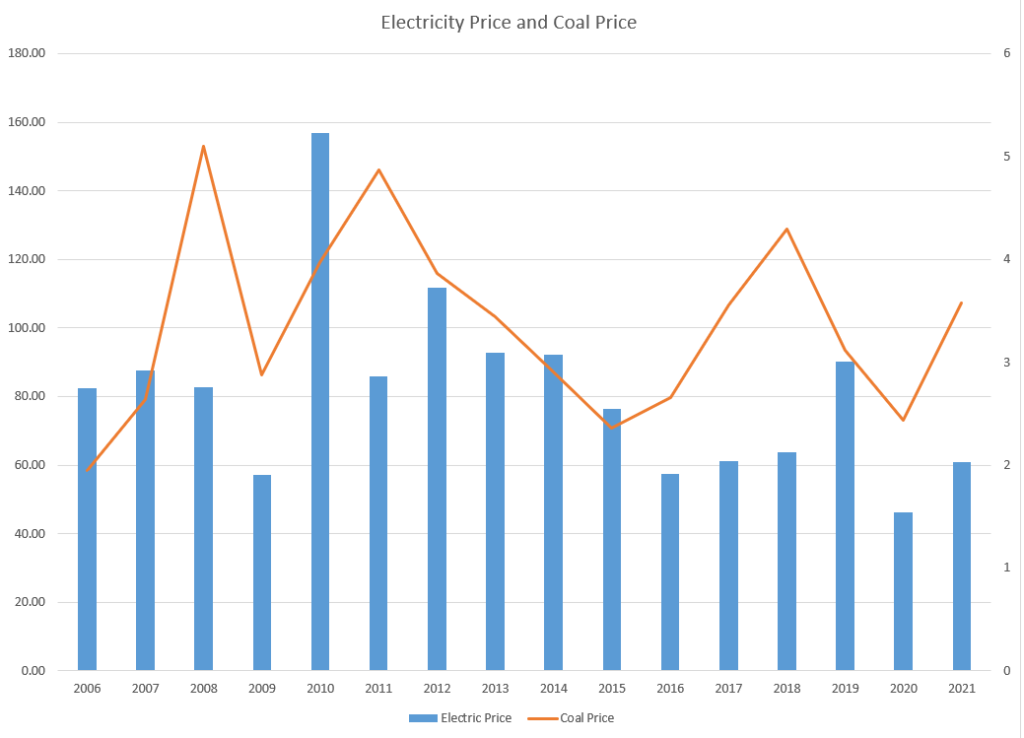
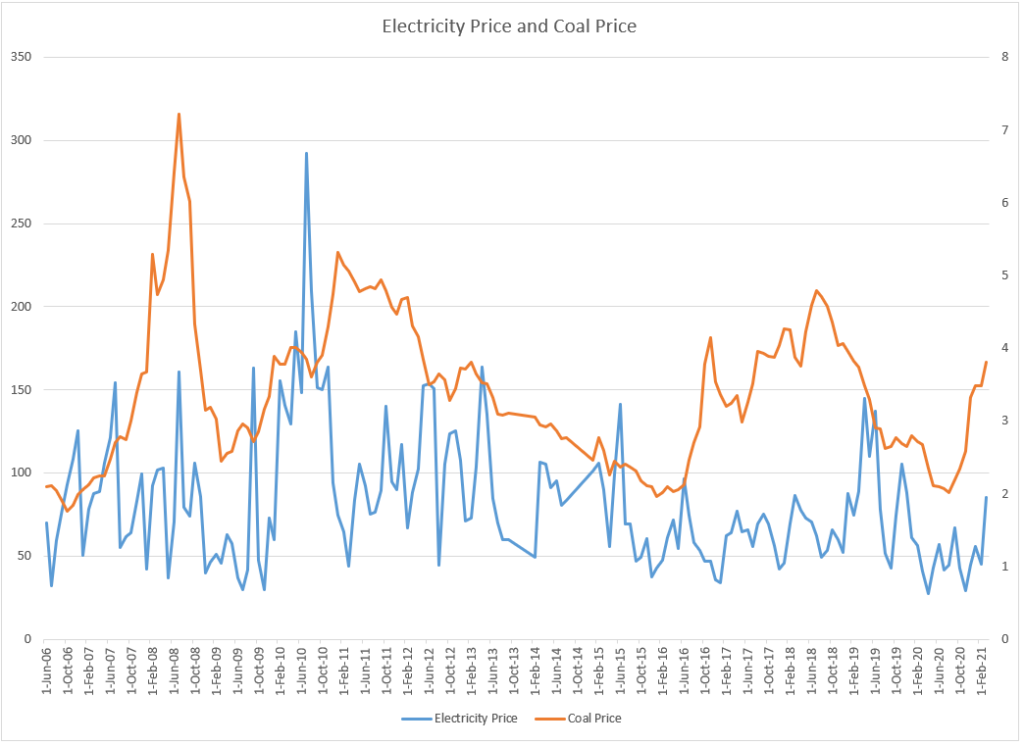
The Philippines experience is a little like Turkey. The prices have been higher than in other markets even after adjusting for high natural gas prices that are experienced in Asia. But as usual, the high prices prompt a lot of building (even though new coal plants have PPA agreements, the WESM provides a benchmark). With the new building, prices have been falling in the past few years.
Video Explanations of WESM Database
The first file is named WESM_HOURLY_DATABASE. This file includes hourly prices since the beginning of the market in 2006. That is a lot of hourly data. In this file, the prices PHP are converted to USD using a current exchange rate and then compared to natural gas prices in Asia using the world bank PINK data. Because the file is so big, there is no valuation analysis of different kinds of plants.
The second file is the WESM_VALUE_ANALYSIS. This file includes alternative graphs and value of different generating technologies evaluated against the market prices. WESM Value Analysis.xls Commodity Price File
. To put the database together in USD you also need the Phillipines/USD exchange rates. The file that you can download below includes exchange rates and allows you to update the database. This database includes more exchange rates than the exchange rates available from the FRED website. You can see the mechanics of putting this database together by going to the currency database sheet. .
Updating the WESM Merchant Electricity Price File by Yourself
Lets say that you want to update the file. To do this, I have created a three step system to track historic price data, translate the price to USD and then put together a history of hourly merchant prices in USD/MWH. The reason I want USD per MWH is so that prices in the Philippines can be compared with prices around the world. You can also evaluate the profitability of solar and other resources against the market price. Here are the steps to putting together a comprehensive database of the Philippines WESM prices:
STEP 3: To complete the process you need to put the Philippines Exchange Rate and Commodity price data into the WESM Hourly Database file.
The commodity prices can be obtained from the World Bank Pink Data file. (You may need to check that the link is current because unfortunately the World Bank sometimes changes the url.) Get the commodity price excel file (shown above) and then update the file. Put the monthly prices in the PINK DATA sheet.
The Philippine Peso to USD exchange rate is a pain because it is not in FRED and the sources have changed. I found a website that has the daily data and created a file you can use to read the data. This file is named “Get Historic Exchange Rates” as shown in the file list above. I made a video that shows how to use this file that is shown at the bottom of the page.
STEP 4: To complete the process, open the WESM VALUE ANALYSIS file and paste special the database file data. You may have to go to the NAMES page and add space to the dropdown boxes. In addition, you may have to go to the “data analysis for graph” and insert added formulas at the left columns.
Lessons from Historic Database of Philippines Merchant Prices
Once you have put together the together the file named WESM Hourly Database, you can do a lot of analysis. Some analysis of the economic value of different technologies in the file named WESM Value Analysis (which is a very large file because of analysis with hourly data). To manage this file you should first copy the data from the hourly database into the file. This file has a whole bunch of advanced techniques for graphing data with different time scales and do other analysis.
The Philippines experience is a little like Turkey. The prices have been higher than in other markets even after adjusting for high natural gas prices that are experienced in Asia. But as usual, the high prices prompt a lot of building (even though new coal plants have PPA agreements, the WESM provides a benchmark). With the new building, prices have been falling in the past few years.