This webpage describes a database that I have created to analysis purchasing power parity of different currencies over alternative historic periods. I also explain how to automatically retrieve data from the internet for exchange rates and put the data into a structured excel file. A few different websites are used to either retrieve current exchange rates or to retrieve historic exchange rates including the FRED website and currency converter. There are three parts to the webpage. The first part goes to the currency converter and allows you to quickly extract exchange rates and then put the rates into a flexible excel file. The second part of the website explains how to go to the FRED website and collect data. .
Exchange rate data is important for many reasons. For example, in acquiring stock price data, the data is generally expressed in terms of local prices; you probably want a common currency to compare the stock indicies. Finding historic exchange rates for countries such as the Philippines can be tricky and are not reported by the St. Louis Fed. To get the prices there are some alternatives one of which is http://www.x-rates.com/historical/?from=USD&amount=1&date=
In analysing the interest rates and exchange rates in the paragraphs below, I present a little theory about the relationship between interest rates, inflation rates and exchange rates. The general theory is that in the long-run exchange rates should reflect differences in inflation rates to avoid purchasing power disparities. The purchasing power parity (“PPP”) exchange rate that is derived directly from differences in inflation rates can be evaluated using the formula below where the exchange rate is Rs/USD:
PPP Exchange Rate = Base Value x (1+Rs Inflation)/(1+USD Inflation)
The formula above demonstrates that to evaluate the PPP exchange rate, you need to start with a base value and then move the value with an index. Figure xxx presents the calculated PPP exchange rate relative to the USD compared to the reported exchange rate starting from a base of 2002. This graph uses inflation and exchange rates that are tabulated by the Federal Reserve Economic Data Base. The annual inflation rates for USD and Rs as well as the exchange rate used to create the graph is shown in xxx. The graph confirms that PPP exchange rate moves together with the actual exchange rate. The implication from this graph and analysis is that if NEPRA uses the USD/Rs exchange rate to index prices, then the prices do implicitly reflect the Rs inflation.
Database of Purchasing Power Parity
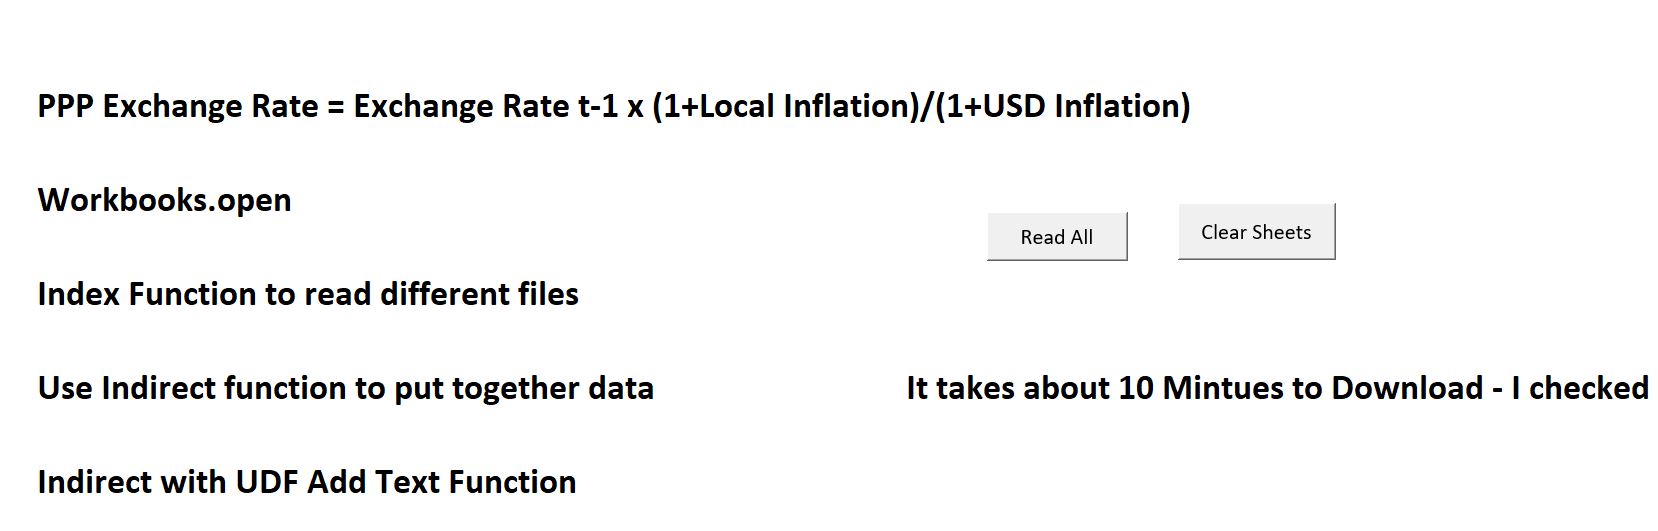
The file that you can download below extracts data from FRED for different currencies and inflation rates. From a selected starting point (by you), you can evaluate how an exchange rate would evolve compared to actual exchange rates. This is a big deal in project finance because the indexing of purchase power contracts and availability contracts to a currency like USD or Euro, works effectively if the currency change is driven by the difference in inflation rates. The PPP formula is Base x (1+local Inflation)/(1+USD Inflation). You can download the database by clicking on the button below.
After downloading the file, the first page should look something like the picture below. You can update the database by first clearing the sheets and then pressing the read all button. Once you have updated the data (if you want to), you can go to the page with the two graphs that demonstrates the PPP analysis and allows you to choose different currencies.
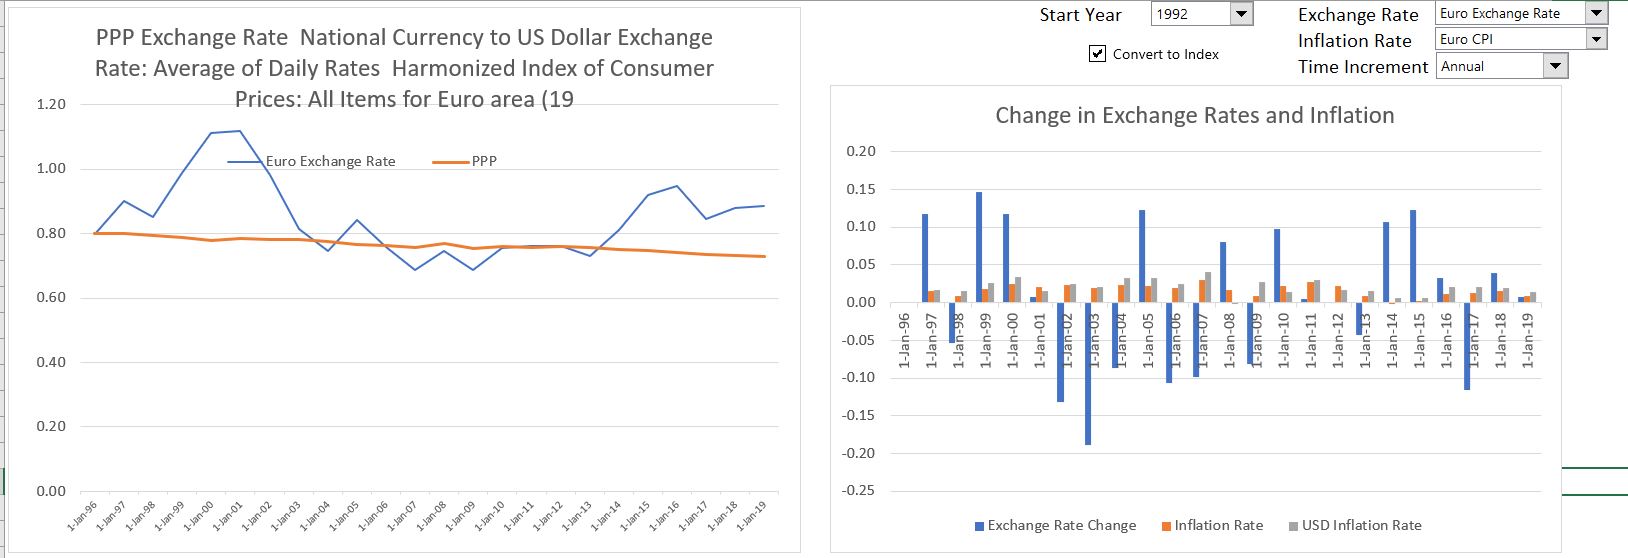
The euro and USD illustrates the analysis below. The date I selected is when the euro data was reported. This shows that there is less appreciation in the euro tan would be explained by inflation.
Current Exchange Rate Database and Internet Read
The read current currency file is used as an introduction to use of a macro to read data from the internet using the WORKBOOKS.OPEN statement so that you can record information from a website into an excel file. The example below and the video read data from a commonly used currency website that contains current exchange rates http://www.xe.com/currencyconverter/convert/?From=USD&To=CHF (I think when you go to google and ask for the Euro to Swiss exchange rate it takes you here to this website). I the completed file below, you can select different exchange rates and press a button (Read Currencies in List) to get current updates of the exchange rate. I originally used the list box technique that is further explained on the flexible graph page is used so you can change the number of currencies that you may want in a report. But now in excel 2016, list boxes are dangerous so I have changed the technique to use check boxes with TRUE and FALSE and Match. I use this macro to find current exchange rates to develop invoices or other analyses that require current data on exchange rates.
If you download the file below, all you have to do is click on the currencies you want with the check boxes. Then click the macro box and all of your exchange rates are ready to be copied into any other file that you want.
The video below shows you how to create a macro that finds the correct place in the file that is downloaded from the internet with the workbooks.open statement and how to set-up the file to download multiple exchange rates.
[wonderplugin_video iframe=”https://www.youtube.com/watch?v=CnYykVVboyg” videowidth=600 videoheight=400 keepaspectratio=1 videocss=”position:relative;display:block;background-color:#000;overflow:hidden;max-width:100%;margin:0 auto;” playbutton=”https://edbodmer.com/wp-content/plugins/wonderplugin-video-embed/engine/playvideo-64-64-0.png”]
Historic Database with More Currencies than Included in FRED Website
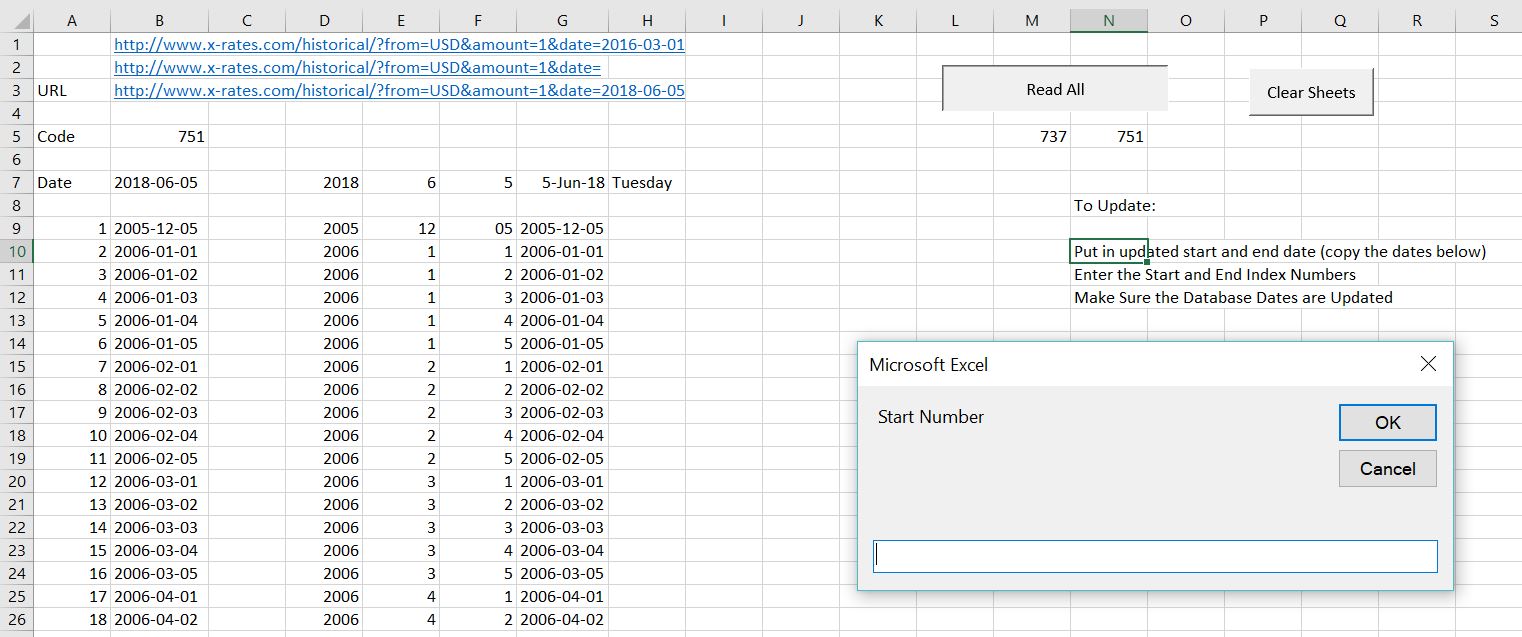
To put the database together in USD you also need the Phillipines/USD exchange rates. The file that you can download below includes exchange rates and allows you to update the database. This database includes more exchange rates than the exchange rates available from the FRED website. . Excel File that Retreives Historical Data on Exchange Rates and Includes More Rates than the FRED Website . If you want to update data in this file, you should copy new dates in to the column of the menu sheet. As I was interested in monthly data, I put in a few dates of each month (to make sure there are no weekends when the data is not available). Then you click on the read all button that is illustrated in the screenshot below. After clicking on the button you are asked to enter the beginning and ending date and the data is read into separate sheets. .
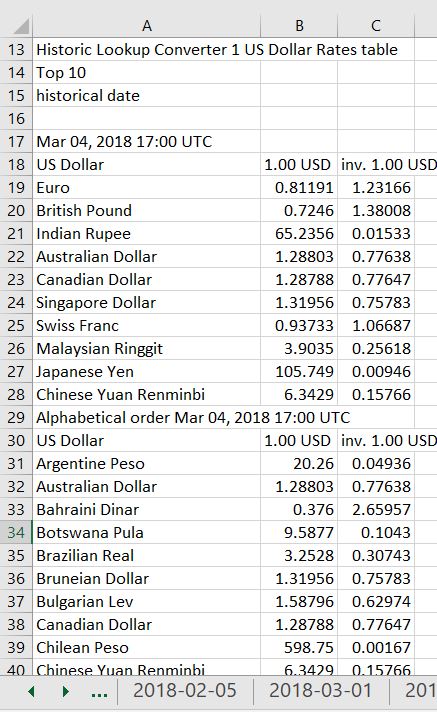
. After reading the data, the data is plopped into separate sheets which contain the currencies versus the USD in a single column. An example of such a single sheet is shown in the screenshot below. The screenshot is just an excerpt of a sheet for a single day, but it illustrates the kind of currencies that you can download. .
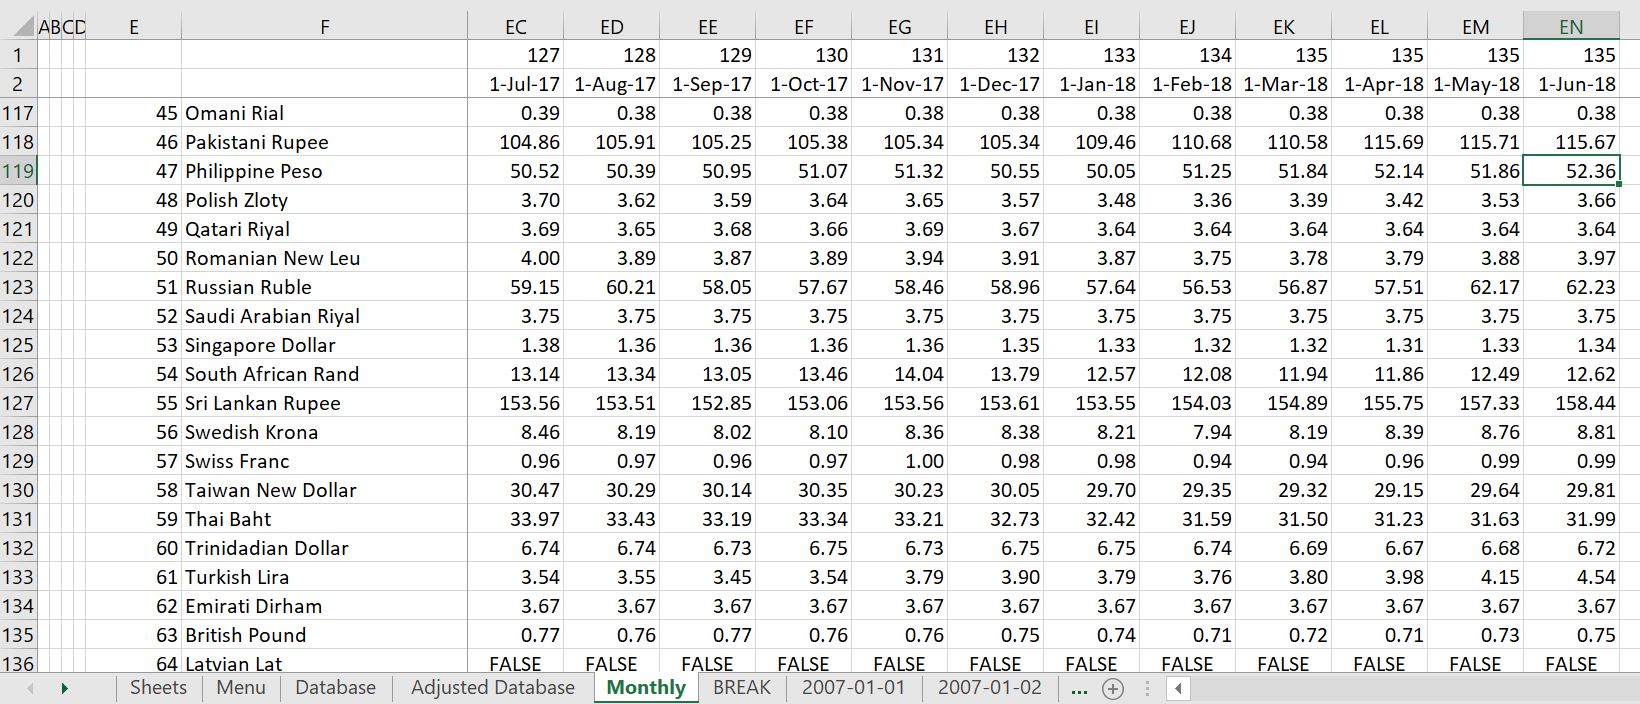
. After reading in separate sheets, the MATCH, INDEX and INDIRECT commands are used to collect data from the individual sheets and stick them in a combined sheet. The sheet that collects all of the data is named database. If you are adding a lot of new dates, you may have to extend the title in the database sheet and/or modify the TRANSPOSE function. After the database sheet, the final data is put into a couple of summary sheets. An excerpt from the final analysis with month by month data is shown in the screenshot below.
Technical VBA Details of the Files that Automatically Read Currencies
The little macros that go to the website and collect the data for the detailed daily data and currencies not covered in FRED are shown below. You can seen that these macros are not very complicated and rely on the WORKBOOKS.OPEN method. The first program shows how to read all of the data together. The second program shows how to read a single file and put it in a separate sheet.
.
Sub read_all()

Dim start_number, end_number

current_status = Application.Calculation

Application.Calculation = xlCalculationManual

start_number = InputBox(" Start Number")
end_number = InputBox(" End Number")

For i = start_number To end_number

Range("code").Calculate
Range("code") = i

history_exchange

Next i

Application.Calculation = current_status

End Sub
.
The detailed reading of a single currency is shown below. This uses a basic copy and paste.
.

Sub history_exchange()

Application.DisplayAlerts = False

base_book = ActiveWorkbook.Name
base_sheet = ActiveSheet.Name

num_sheets = Sheets.Count

Range("url").Calculate
Workbooks.Open (Range("url"))

temp_name = ActiveWorkbook.Name

Cells.Select
Selection.Copy

Windows(base_book).Activate

Sheets.Add After:=Sheets(num_sheets)
Selection.PasteSpecial Paste:=xlPasteValues, Operation:=xlNone, SkipBlanks _
:=False, Transpose:=False
On Error Resume Next
Range("sheet_name").Calculate
ActiveSheet.Name = Range("sheet_name")

Workbooks(temp_name).Close

End Sub


.