This page describes how to model performance incentives to alternative investors through distributing different dividend percentages once alternative IRR targets have been met. For example if you are a big multinational energy company and dealing with a little company like me and my dog, the big company may want to give me an incentive only after a certain IRR on the project is obtained (as I put no real money into the project). Then if a really high IRR is met by the project, the dividend distribution would change and my dog would get a really big bonus and be allowed to eat a steak. The manner in which you can model these incentives to little old developers where the dividend distributions change once different IRR targets are met is discussed in the paragraphs, videos and the files below. The first file below is the file that is associated with the video discussion, and, as usual, you can download the file by clicking on the button.
[wonderplugin_video iframe=”https://youtu.be/Lg9O09NowoM” videowidth=600 videoheight=400 keepaspectratio=1 videocss=”position:relative;display:block;background-color:#000;overflow:hidden;max-width:100%;margin:0 auto;” playbutton=”https://edbodmer.com/wp-content/plugins/wonderplugin-video-embed/engine/playvideo-64-64-0.png”]
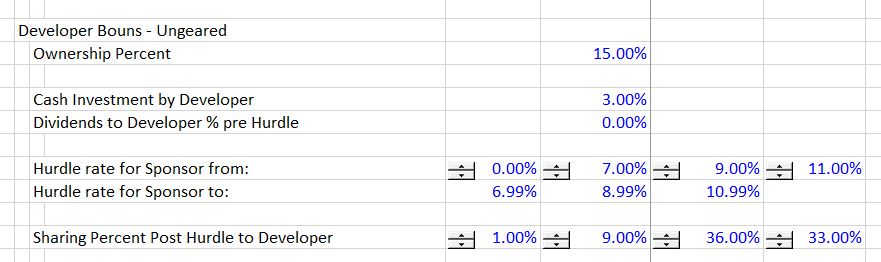
Inputs for Developer Bonus
For this subject of changing dividend distributions with alternative IRR targets, I have a tough time explaining what I am talking about and I think it is best just to show you the inputs. The screenshot below illustrates that a structure can be developed where you distribute different amount of dividends depending on the IRR earned by a senior investor who invests most money in the project. In case you do not have any idea what I am talking about on this page, the inputs may be helpful. The line named Dividends to Developer % pre Hurdle can be ignored for now. The lines at the bottom shows how much of the total cash flow goes to the developer once targets are met. In the example shown on the screenshot, the developer receives 1% of the dividends if the IRR to the other investor (called the senior investor or the sponsor investor) is less than 7%. This compares to the investment made by the developer of 3% of cash project costs. When the IRR to the senior investor increases to above 7%, then the developer receives 9% of the total cash flow. This 7% occurs until the senior investor earns a return of 9%, after which the percentage of total dividends distributed to the developer increases to 36%.
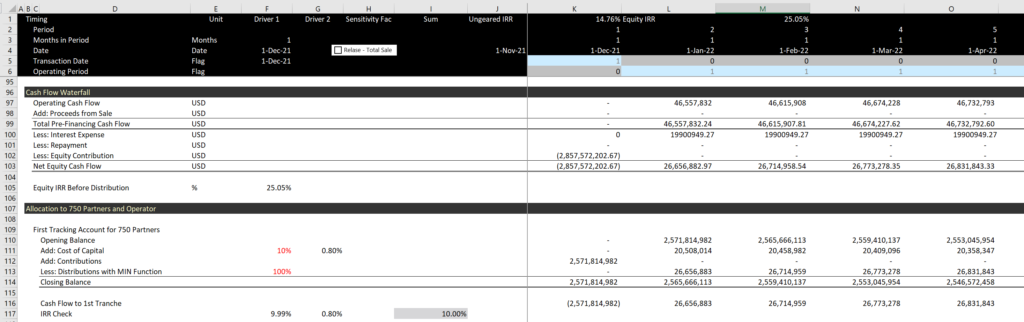
Tracking Account
One of the keys to modelling a structure like the one shown above is to set-up accounts that keep track of the return earned by the senior investor. Note that it is unnecessary to set-up the same accounts for the developer as returns to the developer are not used in establishing the cash flow flips and changing dividend distributions. To set-up accounts that keep track of the senior return, you can accumulate cash flows with a return and evaluate how much cash can be distributed as dividends before the hurdle occurs. The dividends in turn depend on the balance in the account plus the accumulated amount associated with measuring the return. I label the accounts that keep track of the earnings as tracking accounts and I have illustrated a tracking account in the screenshot below. Note that in the screenshot, the cost of capital is computed from the opening balance multiplied by the IRR hurdle rate. Note also that that there is a tracking account for each hurdle rate. Finally, the are established from a cash flow waterfall analysis discussed below.
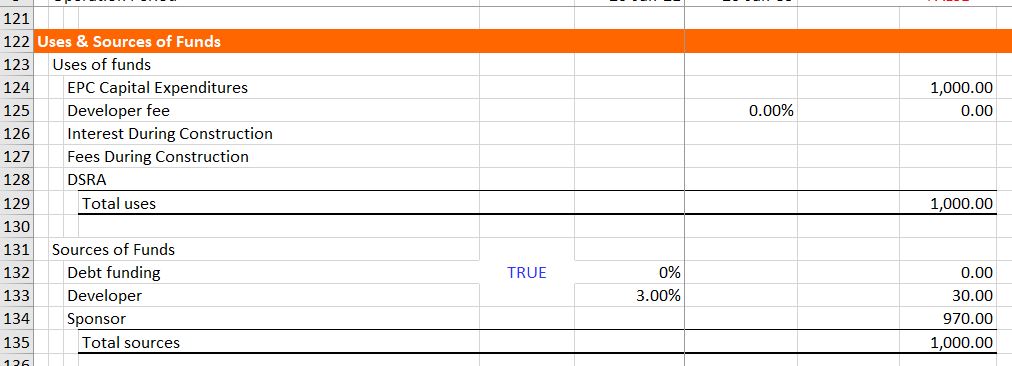
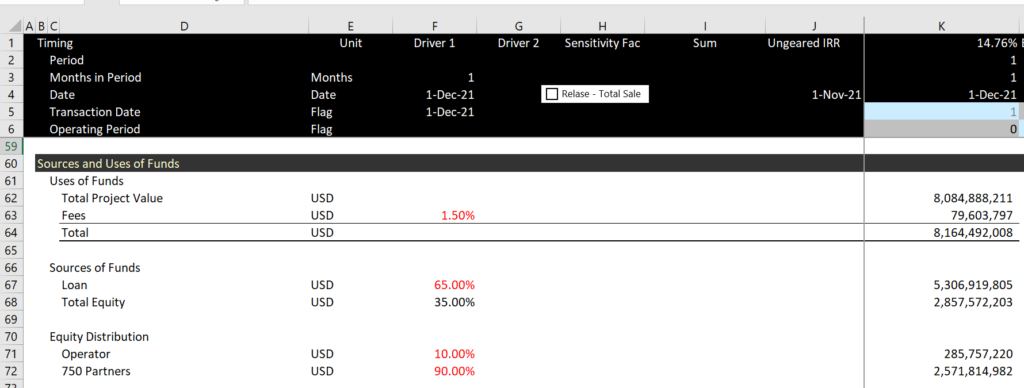
The investment that is included in the tracking account is for the particular senior investor and not the total equity investment. In developing the sources and uses of funds, the developer and the sponsor investment can be separated as illustrated on the screenshot below. Note that the sponsor is the senior investor and has an investment of 970 that is reflected in the tracking accounts.
Cash Flow Waterfall and Payments to Alternative Investors
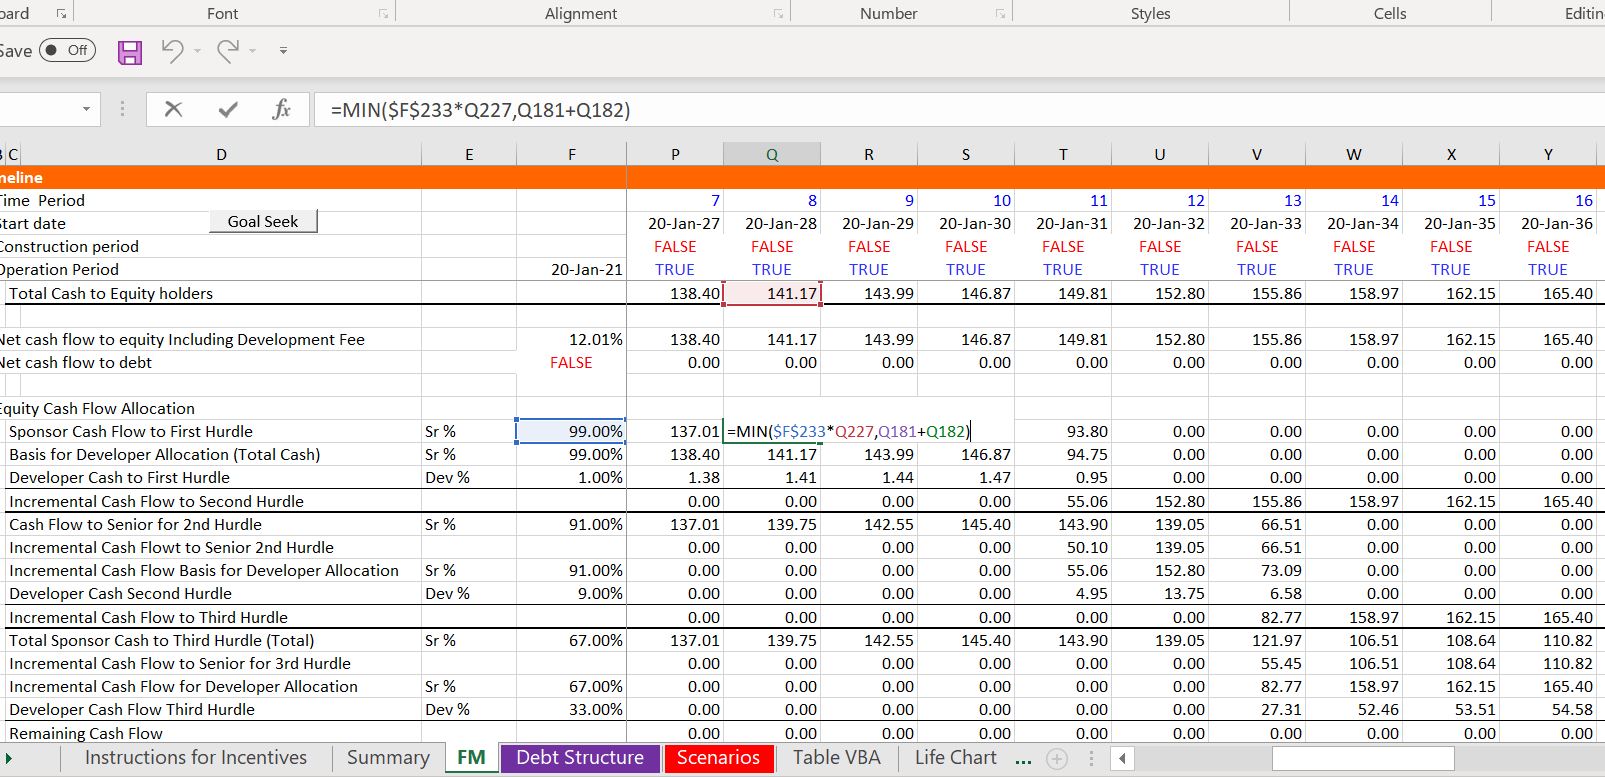
The tracking account uses the amount of dividends to measure the rate of return to the senior investor resulting from the different tranches. The dividends to the senior investor are computed using a MIN function to make sure that dividends are not paid after the hurdle return is met. These dividends must be computed using the total amount of the cash flow.
Principles:
- Set-up Initial Account with Cost of Capital Tracker
- Include Basis for Developer Cash Flow as Senior/Senior Pct.
- Once you have the Developer basis, the allocation is easy
- For subsequent tranches, start with incremental cash flow that is the basis for allocations. This is total less the developer basis (Total equity cash – basis from part 2)
- Compute total to senior with MIN function and include cash flow from prior tranche
- Compute Incremental senior as well as total senior. Incremental is senior from this tranche – senior from prior tranche
- Use the Incremental Senior to compute basis for developer allocation as incremental/senior Incremental percent
- Compute the developer amount as the basis x Developer percent
Re-start from point 4 for incremental tranche
Now let’s review this again. First, separate the equity contribution.
Start with the first constraint. This is computed for the first trance. Use the MIN to compute the cash flow for the first tranche. This is tested against the opening balance plus the accrued interest. Then, you should compute the total cash flow in the first tranche for a cash flow waterfall.
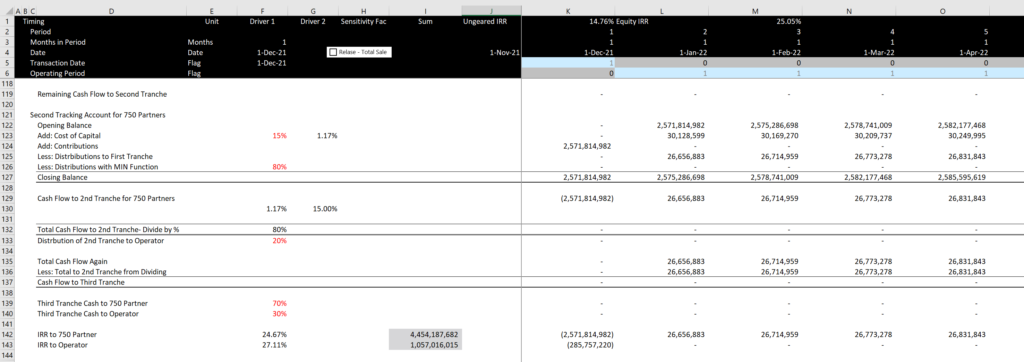
For the second tracking account make a separate line for the cash realized in the first tranche and also put a line in for the cash flow for the second tranche. In this case the second tranche is multiplied by the percentage that is accrue to the senior investor who gets the money first.
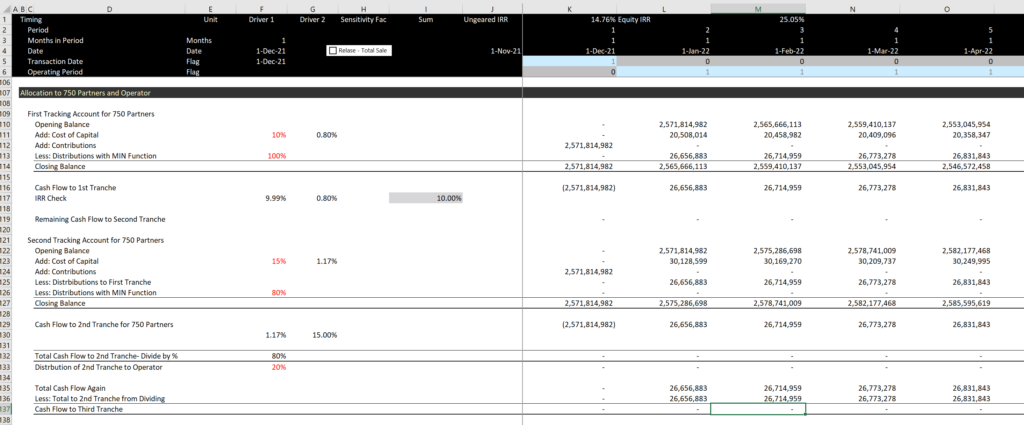
After making the calculations for the second tranche, you can compute the remainder again and also check the IRR at each level. At the bottom, you can accumulate all of the cash flow to the different tranches. This is illustrated in the screenshot below.
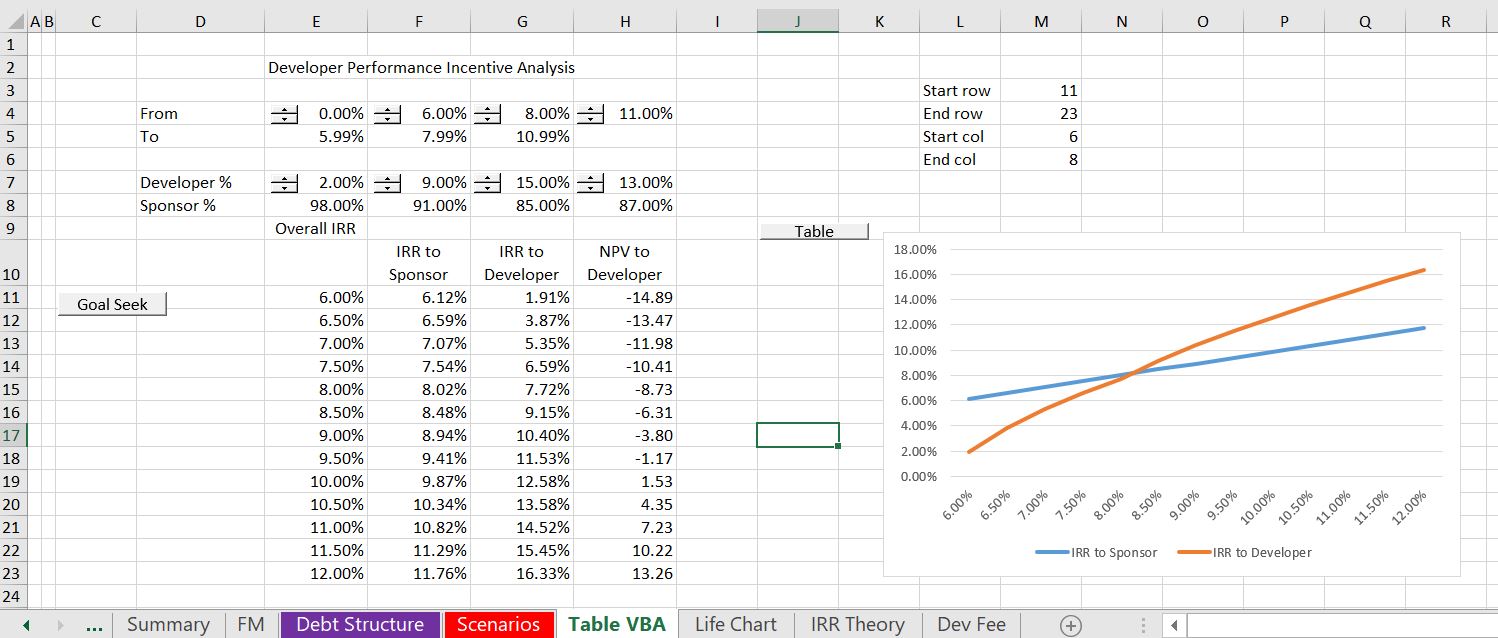
Sensitivity Analysis
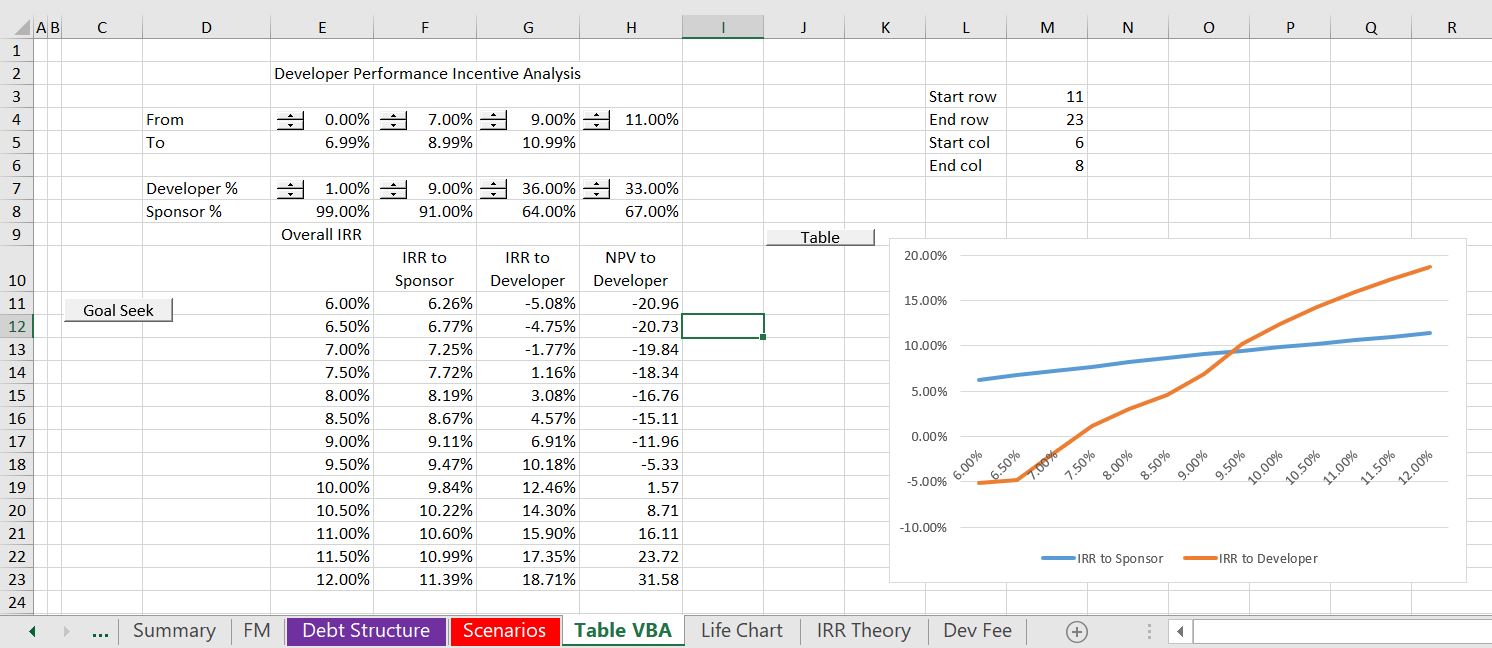
Once the IRR’s are computed for the senior and subordinated tranches, sensitivity analysis can be performed to evaluate both the senior and developer return assuming alternative levels of income. Sensitivity analyses are illustrated in the screenshots below for different hurdle rates and distribution percentages. A goal seek is used to derive the EBITDA level that yields the various IRR’s shown in the table. The graph of information in the data table demonstrates the different sensitivities and risks. In the first screenshot there is a relative moderate increase in the developer IRR relative to the sponsor IRR. The sensitivity analysis is shown below. With the structure shown in the second screenshot, there is less variability in the developer IRR but more variability in the IRR to the sponsor. You can see this be comparing the first and last IRR’s on the table. In the third case there is more variability in the developer IRR than in the other cases and at the same time there is less variability in sponsor IRR than the other cases. These graphs demonstrate that you can come with all sorts of structures to separate the risk.
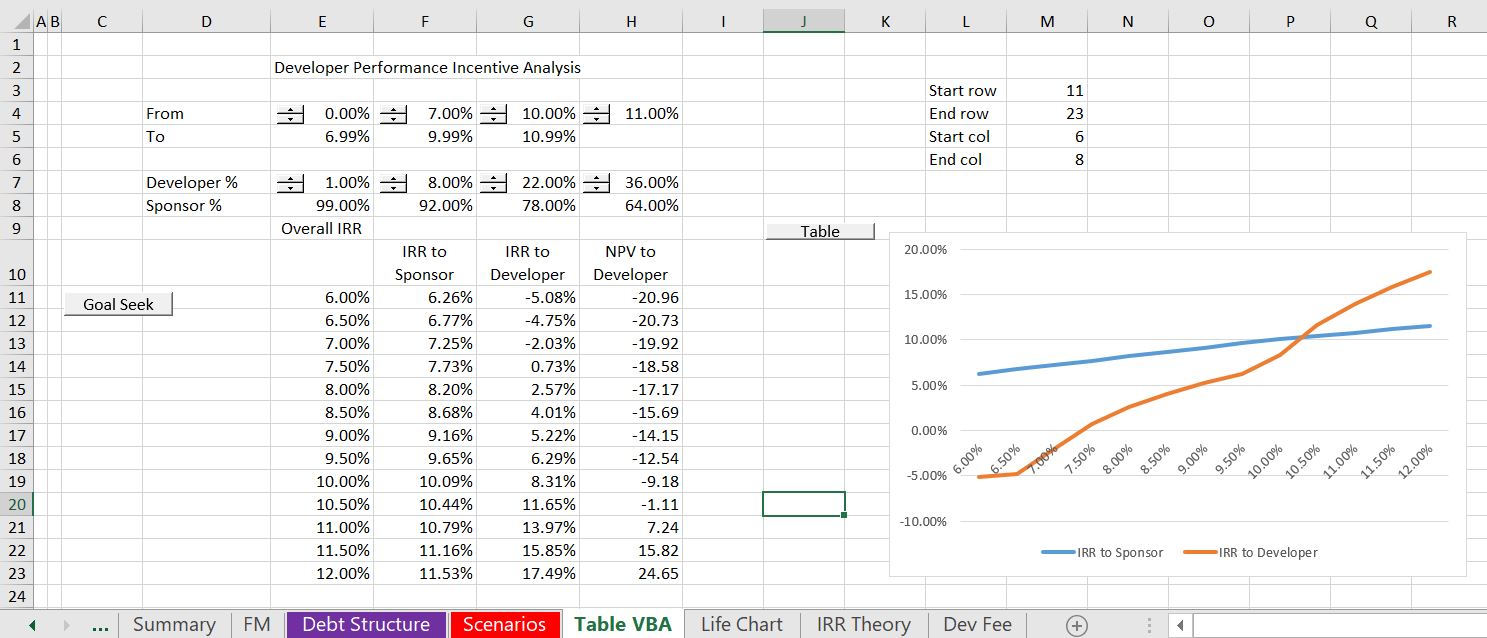
The data table is created with the code below. There is a loop around the rows and then the three columns are displayed. Range names are defined for the target IRR and the various IRR inputs.
.
Sub goal_seek()
'
' goal_seek Macro
'

'
Range("NPV_target").GoalSeek Goal:=0, ChangingCell:=Range("ebitda")
End Sub

Sub table2()

For Row = Range("start_row") To Range("end_row")

Range("targ_irr") = Cells(Row, Range("start_col") - 1) * 1000

goal_seek

Cells(Row, Range("start_col") + 0) = Range("sponsor_irr")
Cells(Row, Range("start_col") + 1) = Range("dev_irr")
Cells(Row, Range("start_col") + 2) = Range("dev_npv")

Next Row


End Sub
.