This page includes a database of merchant electric prices in the U.K. since the market began more than 30 years ago in 1989. Since the year 2000, the data is either hourly or 1/2 hourly. For the years 1997 through 1999, the data is monthly. As with other merchant databases included on the website, I have created the database so that you can try and learn lessons from the price history and so you can perform your own analysis. Although the number of price observations in the database as of 2021 was more than 270,000, I think you can make your own analysis and use functions like AVERAGEIF, LOOKUP and MATCH to make your own analysis. With this database you can track some of the interesting history of the UK market including the oligopolistic pricing at the start with Margret Thatcher; the “dash to gas” and split-up of the market causing a margin collapse and the bankruptcy of many plants; the market correlation with natural gas prices; the effect of renewable energy on market prices and many other issues. The market prices along with natural gas prices and oil prices are complied in a database named the UK PRICE DATABASE that you can download below. Until Nord pool began publishing prices, it was very painful to get the prices and hopefully BREXIT will not cause this to happen again. Since the year 2000 the prices are on an hour by hour basis. In the UK electricity merchant prices are horribly un-transparent and I have searched all over to find a file with UK electricity prices that has this kind of historic data but I could not find it. Instead, over the years I have found various pieces of data and I have put them together into a database. As with other merchant analysis, I have converted the data to USD and compared the data with natural gas prices. The button below is attached to a link that will allow you to download the database (in a zipped files).
.
Comprehensive Merchant Price Database for the UK Electricity Prices and Gas Prices From 1990 to 2020
.
Analysis with UK Database
The big result of the UK database is the result that heat rate dramatically declined around the year 2000. This is illustrated by the heat rates in the screenshot below.
.

.

.
Some have argued that with more renewable energy, the volatility of prices has increased.
.


.
I am in the process of updating and documenting the files on this website. You can get the files by sending me an e-mail at edwardbodmer@gmail.com and asking for the resource library.
ENTSOE
(the “let’s get together” body for transmission system operators)
also has available historic series for most of continental Europe:
(registering for a free account is needed)
Also, for hourly UK power market prices, there is no such thing fro Norpool
(or Epex but traded volume is lower there).
However, the UK body that pays subsidies to producers (called LCCC)
publishes a weighted average power price (between Nordpool and Epex)
in an hourly resolution:
Updating the UK Price Database Yourself
In terms of updating prices, the NORDPOOL website has luckily come to the rescue. Since 2014, NORDPOOL records hourly merchant prices in GBP on an hour by hour basis. This means you can press a button and upload the new prices in a pretty straightforward manner. A link to the NORDPOOL website that contains the UK prices is included below.
So, here is the step by step process for updating the UK price data. As with other databases it is helpful to use the following data format for the hours and the days. I use this so that I am not confused by U.S. date formats. Press CNTL, 1 to get the format etc.
d-mmm-yy h:mm;@
First, note that you must change your excel to the European format (with commas and points). You can do this by pressing the macro on the first page named European format. When you are finished updating using the steps below, you can press the re-set macro.
Step 1: When updating the data, go to the operation page of the NORDPOOL UK database. Then press the button named “UPDATE DATABASE.” This will ask you for the years to update and put in the years from the last update including partial years. Existing hourly sheets will be deleted.
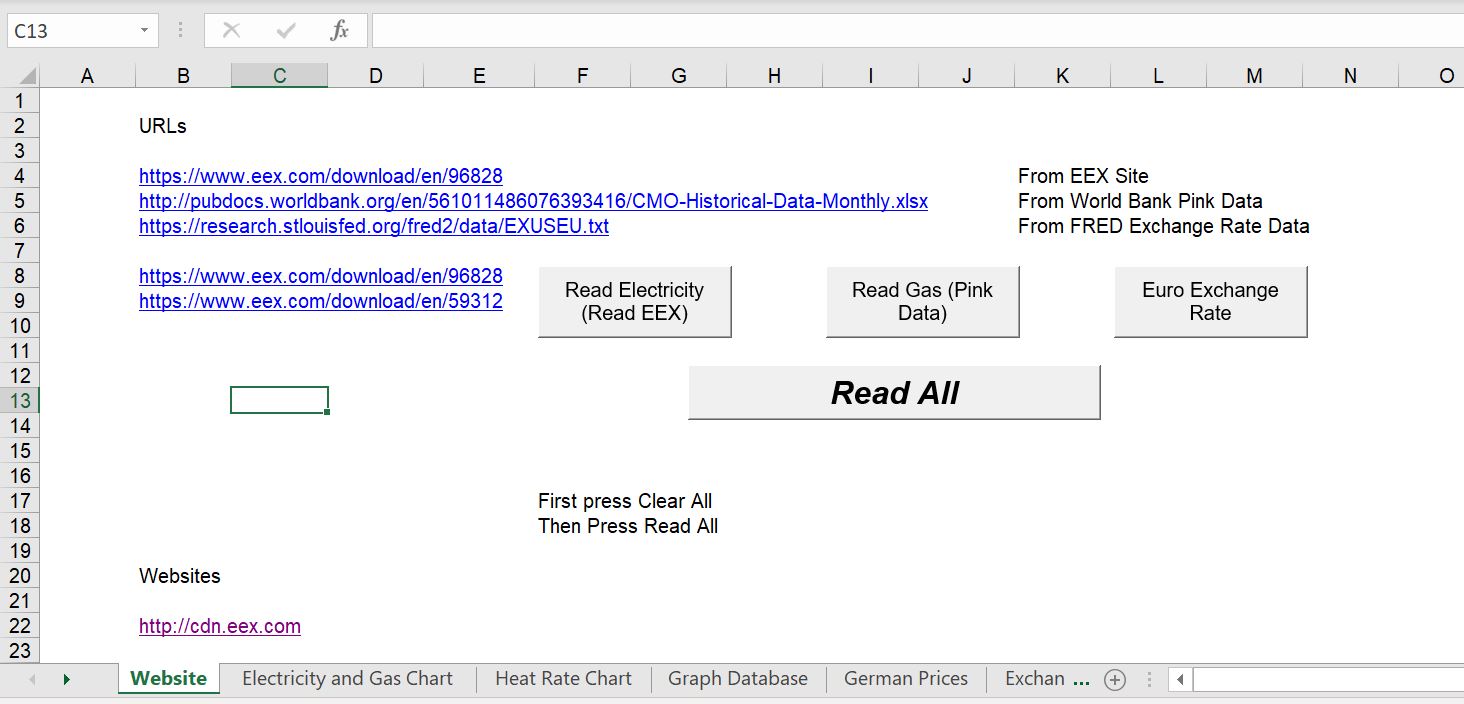
Step 2: Get the currency and comparative gas prices into the database. To do this, copy and paste data from the main currency workbook and from the commodity price workbook after you have updated the links (note you have to be careful about the decimal problem). The monthly commodity prices are copied to the pink data sheet and the GBP Exchange rate is copied from the daily currency database to the sheet named currencies.
Step 3: Keep the decimal method in European mode and then copy the prices in GBP/MWH to the UK Database. You may have to copy the dates after you paste the prices.
.
Case Study Analysis with UK Data
I use the database below to evaluate the crash that occurred in the UK after all of the new capacity and the change in the structure of the market around the year 2000. In my opinion, the crash was not due to NETA that changed the process for bidding and made sure that there was more demand response. I think it was due instead to breaking up the system and to the surplus capacity caused by the “dash to gas”.
Updating the UK Database By Yourself
I do not update the database very often and I always hope it will be an easy process. But there often seems to be a different place to find the data and when you now use the dramatically improved Nord pool way to get the data, the urls’ seem to change. I used to often seem to be in a hurry when I download the data and I do not record the process. Then, a couple of years later I completely forget the steps. So, now when I update prices I am documenting the process in this website. The first thing to do is go to the Nord Pool website below and hope that BREXIT has not messed things up.
It is possible that you will not have to make any changes to the URL’s or the VBA code. In this best case scenario, you go to the file that is named “Get UK prices from Nord pool” and then you go to the operation page. In the operation page, you click on the button that is titled get prices as illustrated in the screenshot below. You will be prompted for a start year and an end year and the the VBA code should go to the Nord Pool database and read in the data.

I am assuming that you are not a really close student of UK prices and you may not know that the code in the Nord Pool website is N2EX as illustrated in the file below.

The screenshot below from the Nord pool website illustrates how you can get the hourly data.
Unfortunately, there is no easy way to get consistent url’s from this list. Instead, you can right click on the blue files and copy the link into the excel file.

Updating the Exchange Rate and Gas Prices
Right click on the FRED url to make sure the name is still correct.

After Reading in the data, you a sheet will fix the format for you.

.
Working with the Database
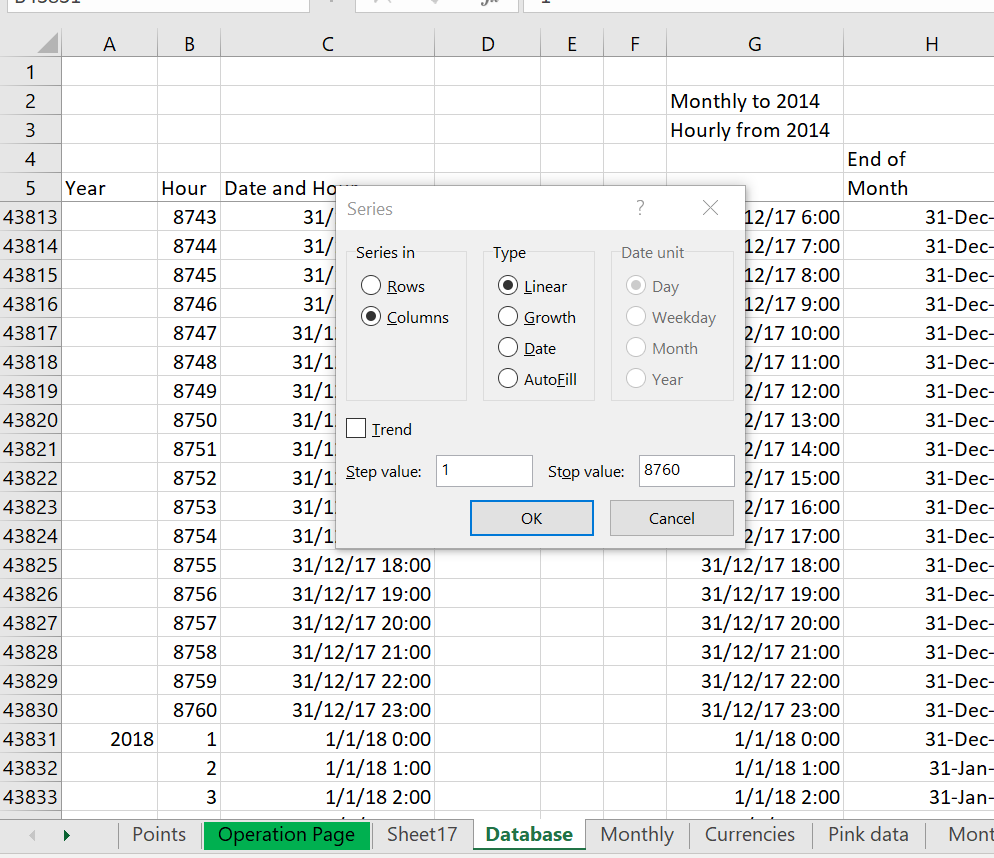
The idea behind all of the databases for merchant prices is to get the prices arranged in a single column with hundreds or thousands of rows. In addition, the gas prices and the exchange rates can be put in the master database. It can be a pain to work with really big databases that have 8760 or 8784 observations for a year and where you have to worry about standard daylight savings time. I suggest a couple of things and I have tried to put some of these ideas in the database. First, in column A (or Column B) if you want to make A an elevator column, put in the year and then leave the rest blank. This is like a column header in a financial model. Then, if you are adding a year, use the ALT, EIS short-cut to get a series of 8760 or 8784 rows. This is illustrated in the screenshot below.
.
Once you do this, you can put in the dates using the idea that in excel, when you add 1/24 to a date you get the next hour. Then you can format the date with the hour and you are about ready to go. You can use the hourly counter and the name of the sheet that is read in to create a string that can be used with the indirect function. Then the prices should be read right in. The process for creating a string for the use with the INDIRECT function is illustrated below.
.

.
Disgusting Lack of Transparency in UK Prices from Sources other than Nord Pool
As I was blabbering about above, transparency in prices is related in a fundamental way to the objectives of merchant markets. If the transparency for the German prices is bad, the UK process is so disgusting that it makes you scream. Go to Google and try to find UK electricity prices and gas prices. You get to a website named APX where you cannot even find how to buy the historic data. There is absolutely no reason it should not be transparent. They tell you to go to some kind of website were you are supposed to send an e-mail begging for the data. I did this and, after a few days I got a response that unless I was a company I could not get the data. Also you have to pay for it. How utterly unacceptable. Sorry about the moaning and, at any rate, if you look hard you can get some data from OFGEM.
I have tried to put data on UK power prices together from various historic sources including data from Nordpool. Despite the disgusting lack of data transparency for the UK wholesale power markets I think the file below is a pretty comprehensive database below. I have documented different sources of data that I have tried to carefully document and present in a transparent manner. The first file shows how I have put together the historic price data from various sources. The second file is a master database that displays trends in prices and implied heat rates that I find very interesting. The link to the Nordpool website that has U.K. data and verification of the Nordpool data against other sources is included in the files.
You may have to update the URL for the monthly data using the world bank data. To do this, go to the world bank website on commodity prices using the link:
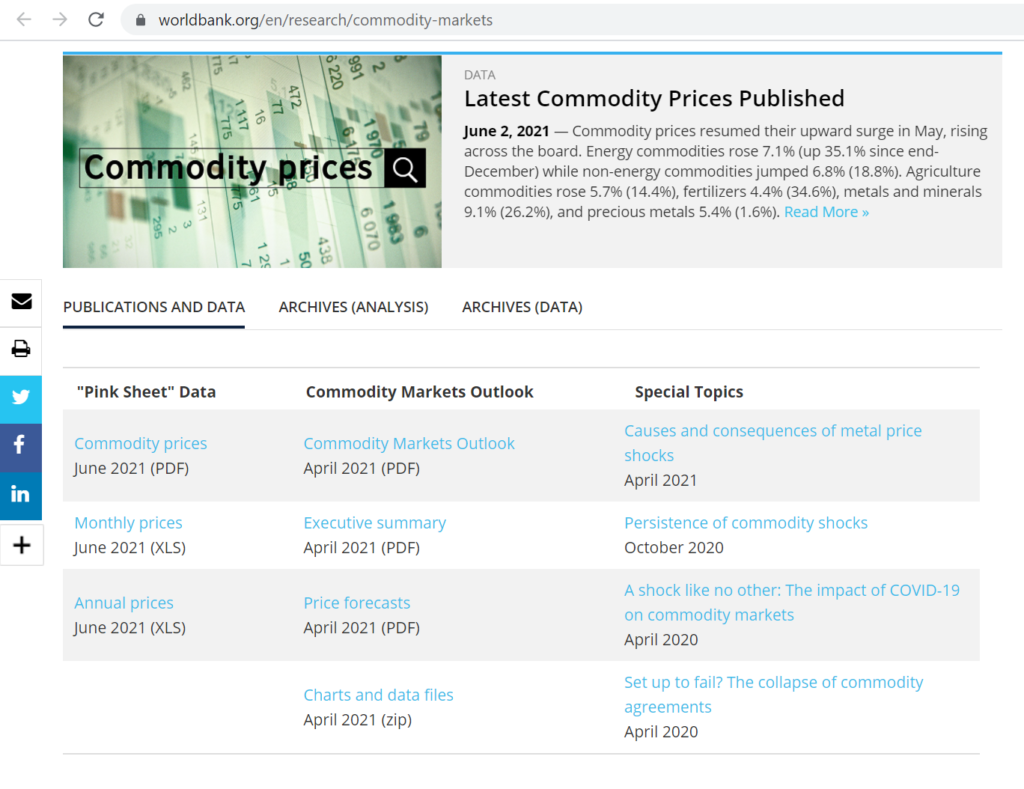
The link that was relevant for 2021 prices is the link below. It is very possible that this link will change and you will have to update the file to read the natural gas prices.
.
Earlier UK Prices
.
The most comprehensive data is half hour prices in the file that you can find below.
