This case study addresses corporate finance issues related to company valuation, P/E multiples, return on investment and cost of capital. The issues for which you can check you comprehension of corporate finance are evaluated through investigating a case written up by the Stanford Business School for a company named First Solar. The case was written in 2010 and you are supposed to put yourself back in that period for most of the assignment. By focusing on an actual company, the case addresses management notions that they can maintain high returns in a business that is becoming more competitive.
Revised Case Questions
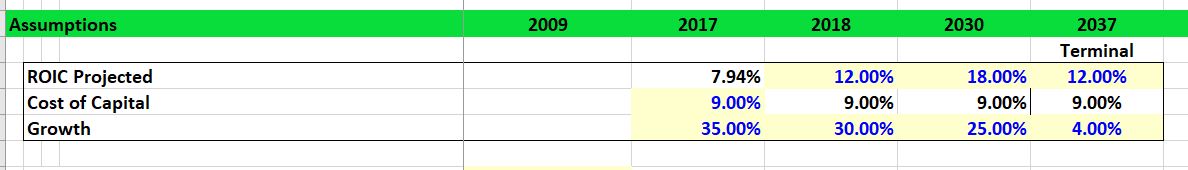
Given the problems with dates, the case studies for the corporate finance session and the modelling session have be reduced to two questions. The questions use a model for Amazon that uses ROIC, growth and WACC to derive the value of the company. You can put different returns and growth various periods (using the INTERPOLATE function). The place you put different inputs is shown in the screenshot below. (Amazon’s share price is about 1770). After downloading the file, you have only the two tasks for this case discussed below.
Question 1
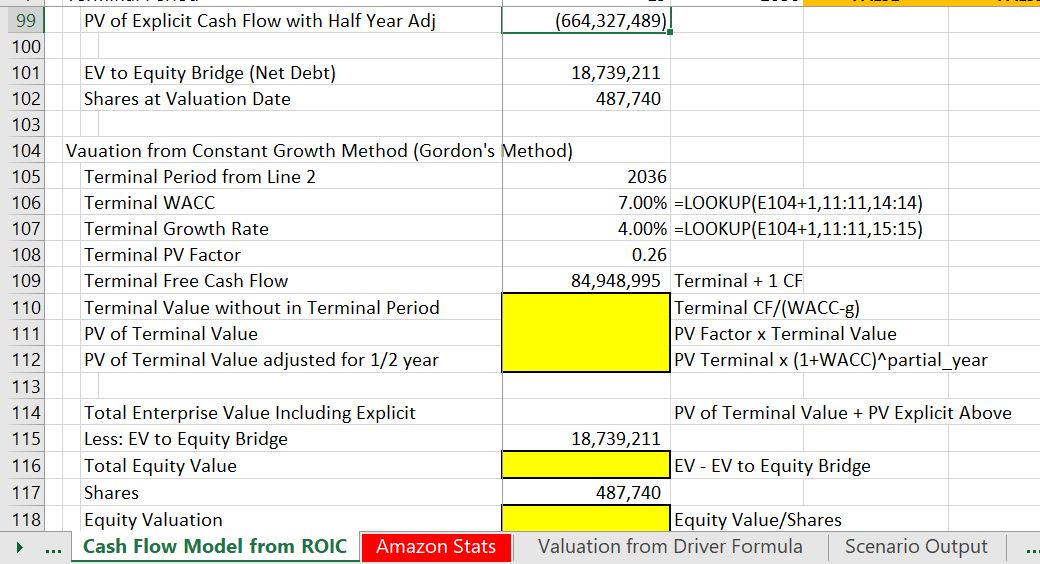
Go the the bottom of the file and fill in the blanks for computing terminal value using (1) the constant growth method; (2) the multiple method; and (3) the value driver method (I have included two variants of this method). The formulas for the methods and the values are given; you just have to fill in a couple of values and come up with the equity value per share. This should make you think about some of the issues we discussed in the corporate finance session. The screenshot below illustrates the blanks that should be filled-in. Look for all of the yellow blanks.
Question 2
Add a scenario analysis to the model and evaluate different values for ROIC, WACC and growth from different periods. To do this you can add a page using the scenario reporter file that you can download below. For this part of the assignment, I have left the scenarios up to you with respect to the factors — just give me about 10 or 20 scenarios with different factors (ROIC, terminal growth, explicit period etc. as explained below). The mechanics for adding scenarios with the scenario reporter are explained below:
- Upload the scenario reporter by pressing the button above
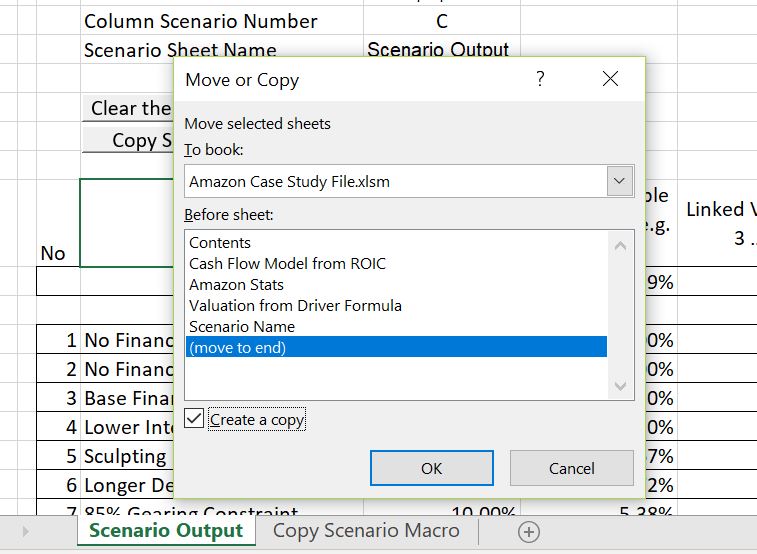
- Move the sheet in the scenario reporter to the Amazon Exercise file (right click on the sheet name and copy the sheet as illustrated below). You can find more details of moving the file at https://edbodmer.com/using-the-scenario-reporter/
- Use the button to clear existing scenarios.
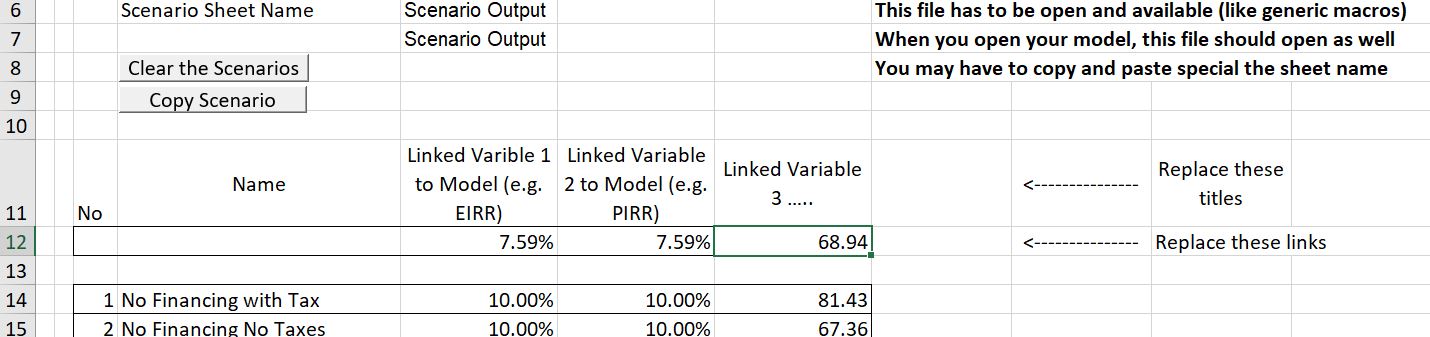
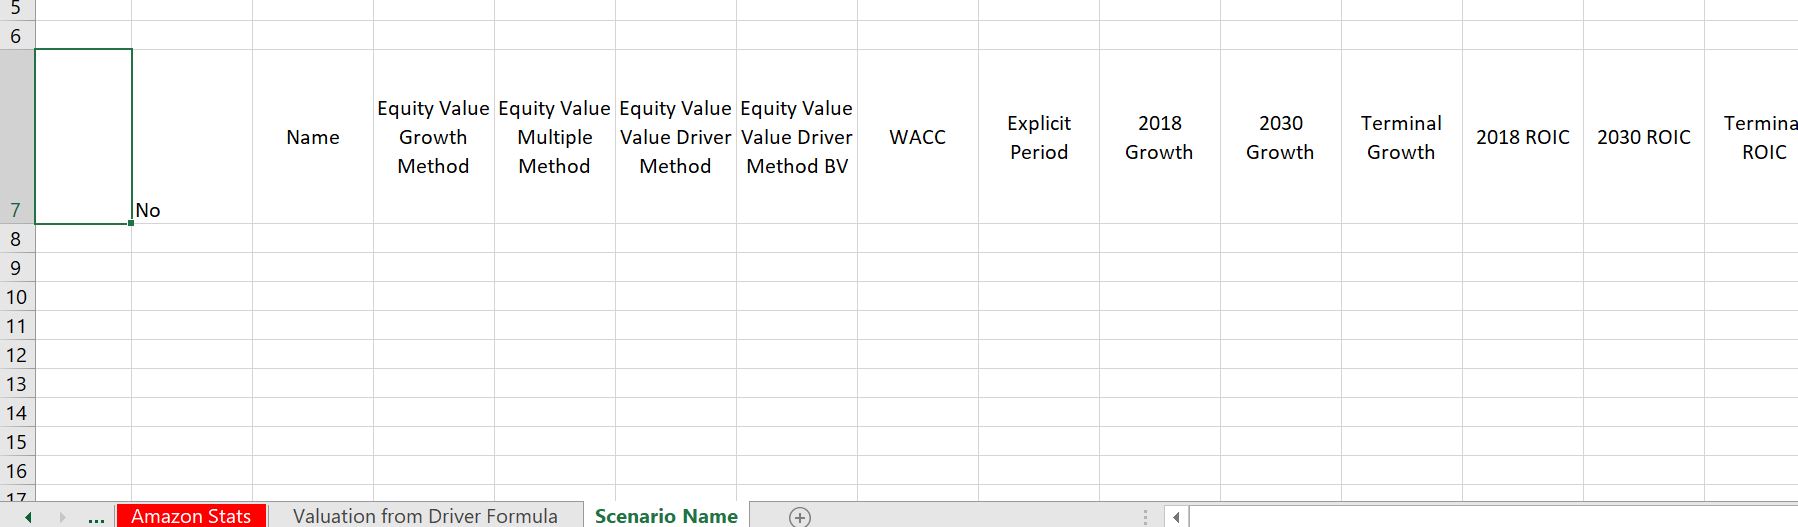
- Now replace the names of the inputs in the “Scenario Output” sheet that should be in your sheet. (Do not close the scenario reporter). Then you should change the default titles that are in the existing file. You can use titles in the sheet named “scenario name” and copy them over the default titles as shown in the two screenshots below. Again, After you copy the scenario sheet into your file, you can copy the titles over the default titles that are given.
- Copy the macro button to the financial model page and make different scenarios by changing inputs. The inputs that should be changes other than the explicit period are shown at the top of the page an are illustrated in the screenshot below. Make a bunch of scenarios by changing inputs in this table as well as the explicit period.
First Solar Case Introduction (This is no Longer the Case — Find the Review Subjects Below)
In this case I want you to think about rate of return and how return, growth and risk affect corporate value. You absolutely do not have to read the whole long case, there is a lot of writing about competitive advantage and strategy which has some indirect implications. I would like you to only focus on just a couple of issues specifically related to corporate finance. I want you to compute some returns and make a very simple forecast to evaluate the value of the company.
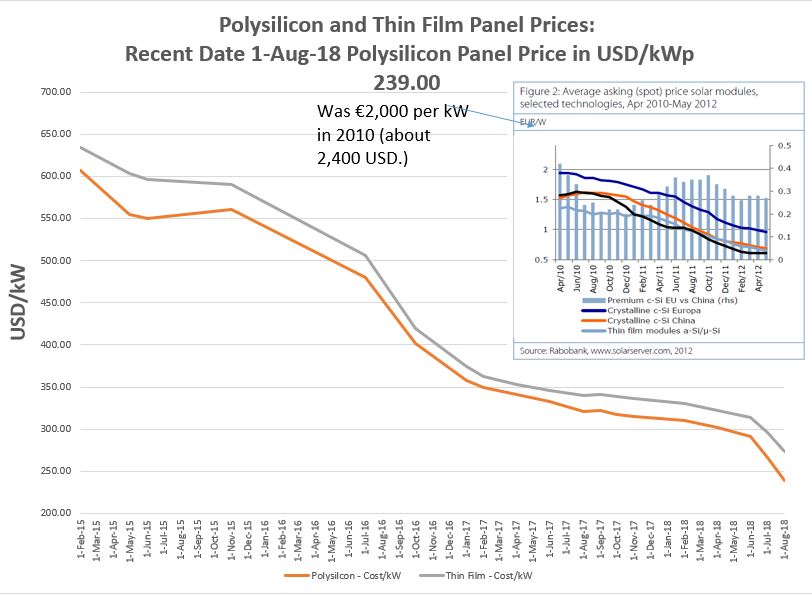
For this corporate finance assignment, I would like you to pretend you were an investor in 2010, the time that a Stanford Business School Case was written about the company. When assessing value of a company either for making a valuation of equity or evaluating credit quality, you are in one way or another evaluating an industry and a company’s ability to earn profits above its cost of capital from some sort of competitive advantage. In 2010, the solar industry had become much more competitive with dramatic reductions in price (you can look at the graph of panel prices in Appendix 1 that are taken from a database on this website).
A very simple summary of industry and competitive issues in the case is that manufacturing of solar panels had become much more competitive and First Solar was attempting to find ways to enhance its competitive position and return. First Solar’s response was to change itself to an integrated solar company that would enter into the development business. The underlying question with regard to corporate finance and valuation is whether the company could maintain competitive advantages that would allow it continue to grow, earn high returns and increase corporate value. The attempt to change strategy is stated as follows by one of the First Solar executives:
“[Currently] those who sell only modules have already been commoditized…. The size of the projects that we were doing in 2008 we don’t bid on today simply because the scale of what we have available to us out there. We leave that to the smaller companies, and we know those module prices and we enjoy a much more robust margin when we do the development EPC ourselves…. As long as these power purchase agreements really set the price, and we’re driving the cost down underneath that [price].”
The management of First Solar and its strategy was complemented a lot in the Stanford Business School case (cases are often written by managers of companies who are former Harvard or Stanford students). Some of the laudatory phrases written by the authors of the First Solar case write-up include: “…accomplishments had indeed been impressive”, “the remarkable achievements of the exceptional people…”, “the industry leader…”, “…prowess in manufacturing”, and, “financial performance had been impressive…” I have put some of the laudatory comments in Appendix 2 at the bottom of this webpage.
As with other case studies about assessment of risk and value there are no right answers as the exact valuation of a company or whether a company’s strategy is effective.
Case Assignment
The assignment involves writing-up seven parts of the First Solar corporate finance case. There are five parts of the assignment. I would like you to write-up one or a couple of paragraphs on each section, something like an analyst report. Do not worry about the length of my instructions — I have tried to put a lot of details in the sections so you can concentrate on the central learning issues. If possible can you give me a document in WORD rather than a pdf file so I can make some comments for you.
Part 1: Retrieve and Present Stock Prices as Introduction to the Case
This part of the case involves extracting stock price data for First Solar, a couple of its competitors and the S&P 500 index (as bankers, I believe it is helpful to get background on stock prices of companies who may be your clients.) The objective here is to practice with getting your hands dirty with some data, to see what happened to First Solar and to start thinking about why there were such dramatic changes in the value of the corporation.
To work on this part of the case, you should open the stock price analysis that you can retrieve by pressing on the button below (don’t worry about the first screen that comes up). With this file open and you should be able to complete the tasks.
- First, download the stock price file by clicking on the button below. When you open the file, there should already be data for the S&P500 index and some economic indices. But when you go to the “Yahoo Stocks” page there should be no stocks.
- Second, go to the page named “Yahoo Stocks” (not yahoo index) and enter FSLR for First Solar. You may also want to try to get a couple of competitors and compare them to First Solar. Press the button named “Read All”. (The mechanics of updating stock prices are shown in the stock price database website.) When you are finished press F9 to re-calculate or press the re-calculate all. Other potential stocks to look at are shown in the screenshot below.
- Third, go to the page named “Multiple Stock Graph”. You can select different stocks and price indices on this page along with different years. I would like you to create graphs of the stock price index for First Solar as well as the overall S&P500 and the Mexican stock price index for the following dates:
- From the date of the initial public offering in 2006 (just use 2006 on the sheet) until 2009.
- From the date of the case in 2009 until 2018.
- For the S&P 500, make an analysis of different starting dates (e.g. from 1950, 1960, 1970, 1980 and 1990) and record the overall return.
- Make screenshots of graphs with the beta, rate of return and the volatility. Make graph with 2006-2008 along with the overall stock index.
- Fourth, write-up an interpretation of the IRR and the total return to shareholders. Include a brief discussion of volatility and the beta in the analysis. Using the analysis of the S&P 500 for different dates, describe what you think is a reasonable return for the overall market. I am not expecting a lot of writing at all here — just a couple of sentences.

Sometimes there may problems with implementing the stock price file. If this happens you can just use the file below. If that still does not work please send me an e-mail immediately at edwardbodmer@gmail.com.
Stock Price Database File with a Few Solar Stocks Selected in Addition to Stock Price Indicies
Part 2: Compute and Interpret ROIC and ROE
In this section I would like you t0 use actual financial data for First Solar that was presented at the end of the Stanford case write-up to compute the return on invested capital and the return on equity for the years 2007, 2008 and 2009. After making the I have provided the balance sheet and income statement data you can use in making the return calculations as well as a guide to making the invested calculation. This data is in the file that you can download by pressing the button below.
As part of this, complete the following tasks:
- Go to the sheet named “Case Financial Statements.” To compute the ROIC for 2007, 2008 and 2009 you can first allocate all items on the balance sheet between operating items on the one hand and financing and assets/liabilities related to non-operating income on the other hand. I suggest you put +1 and -1 into the various categories and then use the SUMPRODUCT function with the +1 and -1. You can see how to do this by going to another page of the website on financial statement analysis. Alternatively, you can look at the page named “2004-2014 Financial Statements” where I have made a similar calculation. When you use the SUMPRODUCT function, do not forget to press the F4 function on the +1 and -1. Also, in the SUMPRODUCT, you must have the same number of rows for the +1 and -1 column as the column for the balance sheet. Note that you should not put the +1 and -1 in the subtotal or the grand total lines.
- Compute the return on equity and the return on invested capital once you have the invested capital. You need to compute net operating profit after tax. As the tax rate was affected by other items and is different from incremental tax rates from countries in which First Solar operates, assume a tax rate of 20%. In computing the return on equity, just use the equity balance from the balance sheet. For both the return on equity and the return on invested capital use the average balance (the average of the opening and closing balance), the ending balance (the balance on the balance sheet for the year of the computation), and the opening balance (the balance from the previous year).
- For First Solar that had a very high growth rate over years that you are computing returns, explain whether you should use the opening balance, ending balance or the average balance in computing ROE and ROIC. Compare your calculations of ROE from 2007to 2009 to the calculations made in the page named “Value Line 2015 Report” and discuss which calculation is more representative of the amount of money earned relative to the amount of money invested.
- Discuss the differences between the return on invested capital and the return on equity in terms of what you are trying to measure from an economic standpoint. Use your calculations to explain why one ratio is higher than the other ratio. Also discuss whether when you are assessing valuation of companies and financial models it is better to look at return on invested capital or return in equity.
- The biggest issue with the ROIC and the ROE is to address whether you think the returns will remain constant, increase or decrease. Pretend you are in 2009 and you have computed the returns. What would you think about the future prospects of returns and why would you have this opinion.
- The case study included a forecast for the years 2010 and 2011. Use the actual financial statements provided in the spreadsheet to graph a couple of actual versus forecast items. (I hope you use the F11 function to make a quick graph). Comment on the graph of forecast versus actual.
Part 3: Understanding and Interpreting Multiples
In this section I would like you to review a stock analyst report of First Solar that was written after the case was published on 1 July 2011. The analyst report will be used to evaluate P/E multiples, earnings growth and projected ROE for First Solar. The screenshot below shows part of an analyst report that was published on 1 July, 2011 for First Solar. Look on the top left below the beta and you will see the target price for First Solar ranged between 445 and 295 for the years between 2014 and 2016. You will also see an annual return of 24% to 37%.
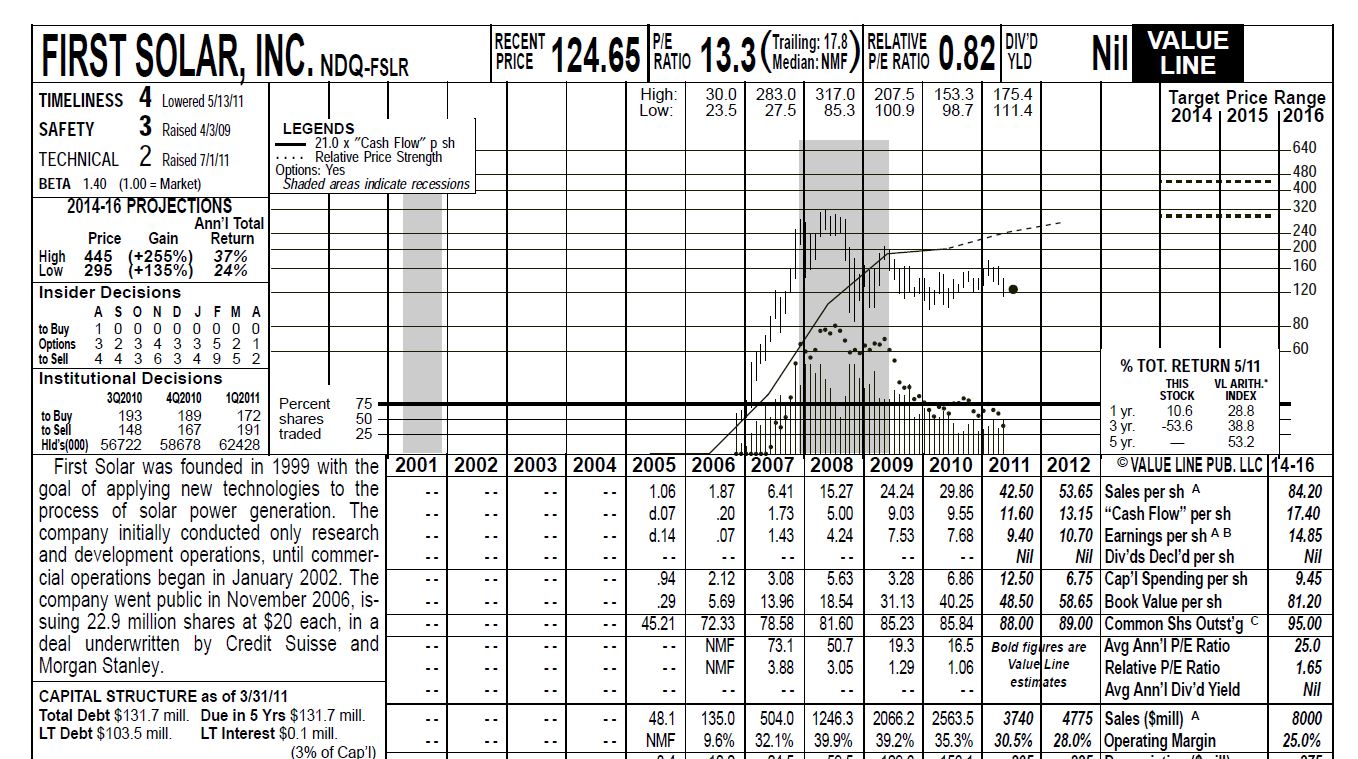
The format of these Value Line reports are ancient. I even remember looking at the reports in the 1970’s. One of the nice things about the reports that you should have in any financial model is a set of history next to the forecast (the forecast is in bold and italic letters.) You can get the entire Value Line analysis that is used in the screenshot as well as more recent analyst reports for First Solar (through 2015) by clicking on the button below. (I stopped paying for the service in 2015, sorry). In the final part of the assignment I will ask for some interpretation of later reports from 2011 and 2012.
In evaluating the analyst reports an multiples for this part of the case, I would like you to complete the following tasks:
- Compute the average target price and explain how the technique used to compute the target stock price (hint, look at the earnings per share and the P/E ratio). Replicate the annual return computed for the low case and the high case (explain how you think the 37% and the 24% are computed in the report). Briefly explain what factors drive the target price to be so much higher than the stock price at the time of 124.65.
- Compare the method of valuation in the Value Line analyst report with a discounted cash flow analysis. By this I mean how does the target price and associated return in the Value Line report compare to discounting, terminal value and computation of valuation using the DCF method. In writing this up (briefly), discuss the difference between equity cash flow and free cash flow as well as the difference between cost of equity cost of capital.
- There is a classic matrix that consultants sometimes use to classify the value of companies. This matrix shows growth is on the vertical axis and the return less the cost of capital is on the horizontal axis. Given the assumptions made by Value Line and the returns you computed in the earlier section, which square would you put First Solar in at the time of the case study and the Value Line report. I put an example of this matrix in a screenshot at the end of this section of the case.
- Dissect the increase in the average target price of from the then current price of 124 into components related to P/E changes and EPS growth. You can set a simple table that shows the current P/E and current forward EPS as well as the future EPS and the future P/E. Then compute the difference between the current and projected P/E multiplied by the current forward EPS and the difference between the EPS multiplied by the current P/E.
- The Value Line report had an expected P/E ratio of 25 times for the future. Use the value driver formula: P/E = (1-g/ROE)/(k-g) and a data table to evaluate what kind of long-term assumptions would result in a P/E ratio of 25 times. For this data table, I want you to make it yourself. I have illustrated how you may set-up the data table in the screenshot below. If you forgot how to make a data table, you can look at the data table page of this website.


Part 4: Enterprise Value, Value Driver Formula and ROIC
In this part of the case I would like you to use a file to make a simple valuation where you change the return on invested capital from year to year and also change the growth rate. A real analyses of corporate value would have detailed analysis of prices, volumes, operating expenses, history and many other factors. But at the end of the day, a corporate model boils down to what will happen to returns and how fast the company will grow. The general idea is that if you are earning more than your cost of capital on incremental capital expenditures, then you should grow and spend money on capital expenditures or supporting working capital. Consultants make a diagram of the valuation process with return on investment and growth rate as well as competitive advantage. This is illustrated in the screenshot below.
This case study is not about financial modelling but about corporate finance. I provided a simple model with return on invested capital, growth rate and cost of capital. I would like you to use the model to run and explain the effects of different returns, growth and cost of capital. In completing the third and fourth task below you will apply a model with varying growth rates and returns that use an interpolate function. To use this model in answering addressing the tasks, click on the button below and open the spreadsheet. Tasks for this part of the case assignment are listed below the button.

- Use the value driver formula: EV = NOPAT x (1-g/ROIC)/(WACC-g) to compute the enterprise value of First Solar using different returns, growth rates and WACC’s. You can use the NOPAT from part 2 above. However, because of regular old calculus used to compute value, you must use NOPAT x (1+g) in the equation. After computing enterprise value you can compute the equity value as the enterprise value less net debt at the date of the valuation. Note that the net debt is computed from the invested capital calculation and includes all net financing and other activities that are not equity capital invested. You can go to the sheet named “Value Driver Formula” and just fill the blank formulas.
- Once you have completed the value driver analysis, prepare a sensitivity analysis with different returns (you could try 8% or even 5%) as well as different growth rates and WACC’s. In one or two sentences explain whether the return, growth rate or cost of capital is the most important driver.
- When you apply the value driver formula — EV = NOPAT x (1-g/ROIC)/(WACC-g), you are making some kind of implicit and undefined assumption about the progression of ROIC from the current level to a prospective equilibrium level. If the growth rate is zero, the future ROIC is never obtained. If the growth rate is high, the ROIC is obtained quickly. To address these problems with the value driver formula, I would like you to make similar ROIC, WACC and growth assumptions with the model that you made in the last task and compare the value per share from the alternative models.
- For the final task before writing a short summary, make some of your own assumptions about the progression of ROIC and growth with different terminal periods (the period before the company becomes completely stable). After making the calculation of values with different cases, make some comments as to what you think would have been reasonable assumptions back in 2010. I have purposely left this question somewhat vague.
Part 5: Write-up a Short Summary of the Case
Write a short summary of the First Solar case from a valuation analysis perspective in 2010. What is the essential aspect of valuation. Also, look at a couple of the Value Line analyst reports published after 1 July 2010 and tell me about what changed in the analysis. Finally, give me some thoughts on the essence of First Solar’s strategy to become an integrated player in the industry.

Other Files
I have included a couple of other files for general background. You can download these files by pressing the buttons below. Some background reading that is not at all necessary for completing the assignment includes:
Appendix 1: Prices of Solar Panels and Silicon
Even though First Solar has diversified into EPC and investments, much of their cash flow is driven by the price of panels. The price of panels is in turn driven by the market for poly-silicon panels. The dramatic price decrease in panels is shown in the two screenshots below.

If you want to update these graphs you can download the file attached to the button below. Then press the updated button and format button from the database sheet.
File with Database of Solar Costs from Scraping the Website PVINSIGHTS and then Re-Formatting
Appendix 2: Prices of Solar Panels and Silicon
Here are some quotes from the case that extol the prowess of First Solar management. Ultimate questions surrounding valuation are whether the company really was so exceptional and had such a big competitive advantage.
“The company’s accomplishments had indeed been impressive, and Sohn noted with amusement that it was all predicated on the same sunlight that made the Phoenix area nearly uninhabitable during the middle of a summer day.”
“… manufacturing efficiencies went a long way in making the company a cost leader. In particular, the high throughput vapor deposition process used by the company allowed naked planes of glass to emerge from the line as solar cells in only a few hours.”
“First Solar’s financial performance had been impressive during its first few years of operation. In a few short years the company had increased its annual revenues and profits nearly four-fold. The company grew from a start-up to a leader in the solar space.”
Despite First Solar’s current technology leadership within the solar industry, the company was keenly aware of the potential for disruptions.
As the mercury once again climbed above 110 degrees and he glanced out at the sun drenched city of Tempe, Sohn realized just how far First Solar had come in its short existence; from an unproven start-up with novel technology to the leader in solar module placements worldwide.
“…the company had grown from a venture-backed start-up to the industry leader with over 5,200 associates, $2.1 billion in revenues and profit exceeding $640 million in 2009.”
One of the most amazing quotes in the case was the quote below that came from the CFO. There are many things wrong with this from a financial theory perspective. The WACC should depend on risk and not on things like “underlevered.” Value depends on returns and growth not the revenues divided by assets. But most of all it is just a lot of jibberish.
I look at my business as having four cost columns that must be managed: the module, EPC, development costs, and the WACC. We have intentionally underlevered at the corporate level, which means that my WACC is higher than it needs to be there. However, I get a much better WACC as a result for my projects. Then I can drive up my corporate asset turnover through more module sales and my margins increase because I don’t have to pay as much for debt. Overall, I get a much better RONA this way than by lowering the corporate WACC.
Review Concepts
In this final section I have included a couple of ideas that I think are important in corporate finance analysis. I have listed a couple of bullet points and some ways that you may think about the issues. I have also included references to my set of power point slides that describe corporate finance theory. These are in two parts of power point slides.
- The Value Driver Formula and of Value Drivers. See part 1 of the power point slides below 169-180.
- Contrast of the P/E Ratio and the EV/EBITDA Ratio. See part 1 of the power point slides below 137 to 150.
- Valuation from EV/EBITDA in LBO. Slides in Part 2 of slides 40-45
- Normalisation of cash flows Slides in Part 2 8-13.
- Normalisation of cash flow in the terminal value period. See part 2 of the power point slides Slides 17-26
Some comments on these review area can be found on the power point slides that you can download from the button below.
Part 1 of Power Point Slides that Work through Corporate Finance and Acquisition Modelling Theory
Part 2 of Power Point Slides that Work through Corporate Finance and Acquisition Modelling Theory