This page describes how to use and create a database that compares historic stock prices, commodity prices, stock price indices and economic data. I think the stock price database described below is different from other services (such as looking at stock prices on google) that you can use on the internet because of the way it can the stock prices can be evaluated and adjusted for economic variables and also for the simple fact that the IRR on the stocks and the volatility of the stocks is presented. For example you can compare the IRR on stocks with bonds, you can convert the South Africa stock index and individual companies to USD or other currencies for comparison. You can grab data on the S&P 500 since 1927 and compare it in real terms to real economic growth (before 1982 the S&P 500 is not available from yahoo, but I have made adjustments). So I hope this whole thing may be useful for you. I have programmed it so that you can easily updated the stock price with new dates and new series (individual stocks, economic series, commodity prices and stock indices) by pressing a couple of buttons that retrieve data from various websites. It works pretty quickly. When working with the file, you can select different stocks, commodity prices, economic series and indices and present them in different ways (as indices, adjusted for exchange rates, different time periods, as percent changes). The growth rate or IRR for each series as well as beta and volatility is also presented and you can make all sorts of adjustments for inflation and exchange rates. This page explains how you can download the database, how to use the database in economic analysis and how to create the database.
From an technical and excel point of view the idea, the process I use is like some of my other files.
- First it is nice to program in VBA because of the way this is integrated into excel (I know python is supposedly integrated but I am skeptical about going back and forth between python and VBA which is what is necessary).
- Second, it has the idea of reading things into a VBA program, doing something with a program (it could be mathematical or it could be this situation with a python program that is necessary to get finance.yahoo data).
- Third, the results are sent back to excel. In this case you can look at the source data (the tickers, for example); you can look at the VBA code and see how it calls the python program; finally you can look at how the output data is used in the same spreadsheet.
I demonstrate how you can select alternative stocks, stock indices (like the S&P 500 or the DAX), economic series, exchange rates, timing and other factors and put these in the database. On the associated web page (this is the link), I explain how you can work with the macros and create this kind of database by yourself. All you really have to do to use this database file for your own analysis is to enter stock tickers (generally from yahoo), symbols for stock indices, commodity price symbols from FRED, codes for economic series from FRED and then press a couple of buttons. This page explains how to use the file in economic analysis and how to find tickers and codes used in the database. The specific process for creating this file is explained in a couple of videos and in the power point slides below.
This file allows you to retrieve data on a monthly basis from Yahoo finance (you can change the timing from monthly to weekly or daily). You can also adjust the FRED data series to read more detailed data on a weekly or daily basis. I beg you to send me an e-mail at edwardbodmer@gmail.com if you are trying to use the file and you are having any problems. I think it is an important file on the website and I want to make sure that you can really use it. The two videos below explain how you can use the file and the rest of this webpage walks you through some of the details. The file below includes a completed analysis of selected stocks.
.
.
Excel File with Stock Prices, and Economic Variables with Computation Returns and Long-term Analysis
.
.
Step by Step Instructions to Get the Program Running
Note that these instructions may change as I update the worbook, python program and the macros. In this section I work through each step in creating a scenario including copying the file to your page. The first step is to download the zipped file, extract it, and to install python. The two files are attached to the blue button below which is a zipped file. You should put this zipped file into a folder (directory). You can copy the files to an external drive like d:\ or e:\ . For now I would not suggest putting it on your one drive. Once you decide where to put your two files, make a new folder.
I have tried sending you the files without having to install python and it is possible to convert the python code to and exe file. However I think this is more painful than installing python on your computer. This is because if I would send an exe file, I would also have to send a whole lot of other files that they even suggest that you put in a google drive. If I send one excel file and one python file and also if you install python you can download the two files shown in the screenshot below. You do have to unzip the files and unblock the excel file to access the macros.
.
Here are some instructions on installing python and then also intalling libraries (that have a bunch of python programs and allow you to access data). The first step is to install python which is illustrated below in the screenshot. I think it is best if you click the “Add python to path” button at the bottom of the page. Just go to google and lookup installing python; it is free.
.

.
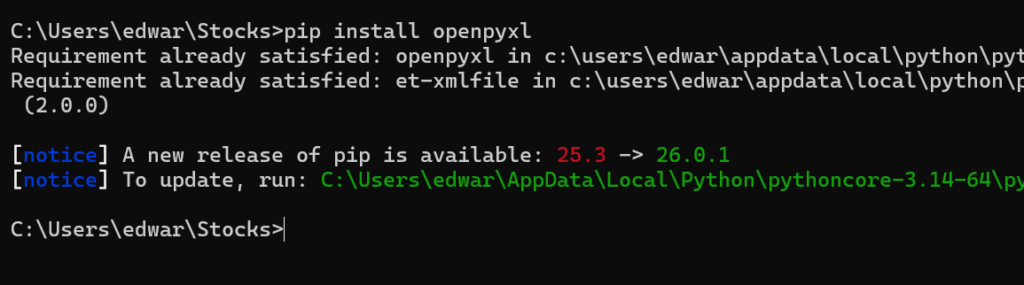
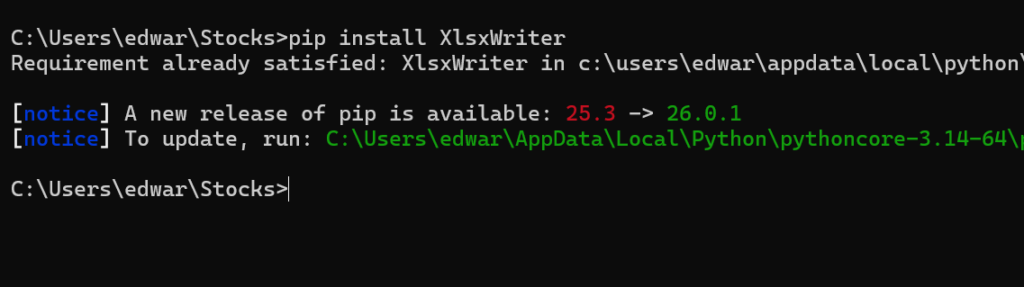
The next step is to install the necessary libraries. There are a few including a library called pandas that has a lot of useful programs that can be called. Another library is openpyxl that has a lot of programs related to opening, modifying and saving excel files. A third very important library is library that contains programs to read stock price (and financial statement data) from finance.yahoo.com. This file is called yfinance. To access these three libraries (and you must do this), you need to go to the command prompt (this is like old fashioned DOS) and then you type “pip install [library]” You can see how this works on the screen shots below. Note that it does not matter which folder you run the pip from. Note that you do not have to install the os library as this is part of the python install. You need to install four libraries:
- yfinance
- pandas
- openpyxl
- XlsWriter
.
The way you can install the different libraries using the run command and then pip install is illustrated in the screenshots below.
.
.
.

.

.
.
import pandas as pd # check out from library – this is for reading in the ticker and the data frame
import yfinance as yf # his is for getting data
import os # I needed this for the output; without it I could not write
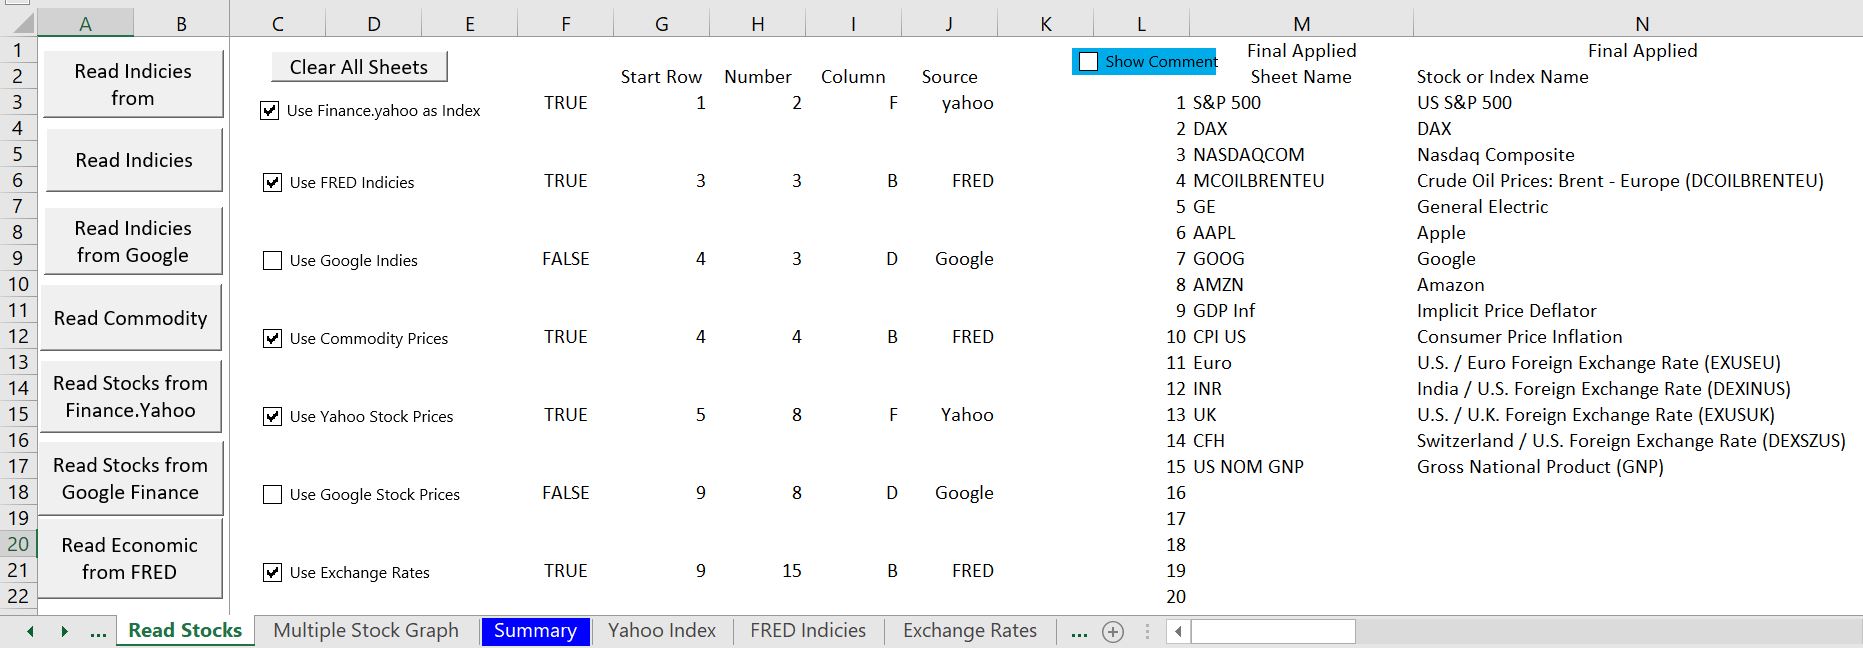
Once you have downloaded the two files (it is a good idea to place them in a separate directory (folder) and the to make sure that the program runs. To run the program, go to the first page (I did not put a menu in this file) and then press the button first to clear the existing data. After you have cleared the data, you can choose what kind of time period code you want. I have roughly set the model up so that you can click on each macro in order.
.

.
You can begin with the first button where you delete the existing data. Then you can choose the time period code. If you want to test the process it is a good idea to use the monthly option. If you run the three buttons to read the data, you can make sure the process is working.
.
Updates to the Database – Stock Index Since 1927
Whenever I open the database I seem to change it and make revisions. Some of the revisions that I have recently made and that are not discussed in detail below include adding longer-term data for the S&P 500 and creating interest rate indices so that you can see the returns on bonds relative to stocks in different periods. To create the interest rate indices that can be compared to stock prices, I use the interest rate published in FRED and start with and index of 1.0 for the first period. I put this into the column to the right of the interest rate that is read in from the FRED data. The index is computed as the starting value of 1.0 multiplied by the interest rate. In this way you can compare the return on stocks with the return on bonds over different periods. The chart below illustrates the history. It demonstrates that any idea that the risk premium earned on stocks has been anywhere near the 6% returns referred to in the literature is not close to being true. Note that the daily data has more observations than the monthly data.
The long-term S&P 500 is demonstrated on the screenshots below. I don’t know how yahoo.finance made adjustments to find the historic index all the way back to 1927, but I find the history valuable. Now you can compare the stock price declines of 1929, 1987, 2000, 2008 and 2020. I had to make some adjustments to the stock price file and I use monthly data. But when you select monthly data from yahoo.finance, it does give you the most recent price and I have made sure the last price is on the graph. I have put this graph in real terms (I have divided the prices by the GDP deflator). The manner in which you can do this is shown on the second screenshot below.
.
.
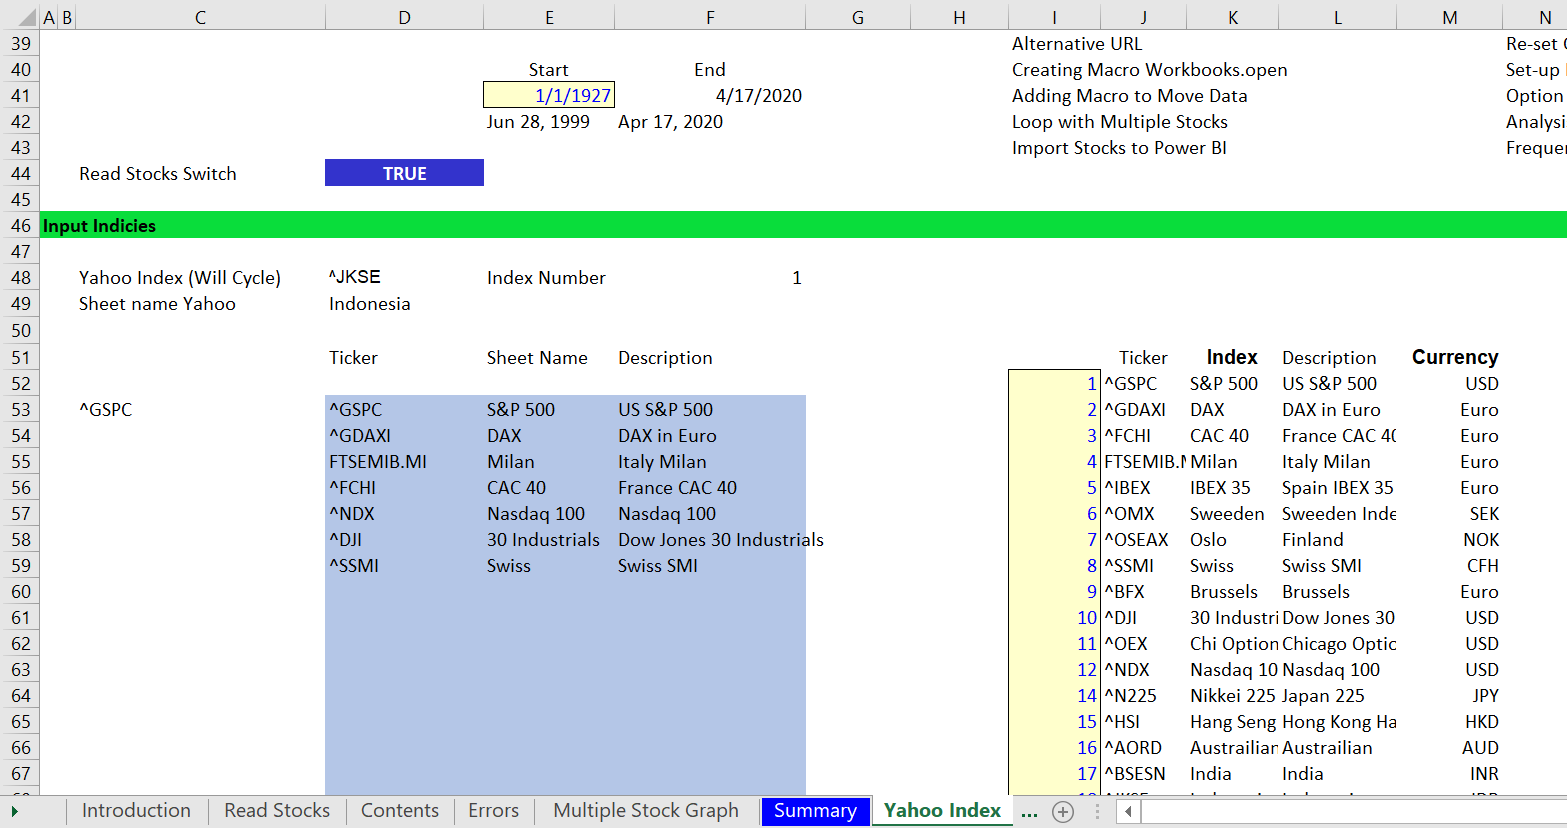
The screenshots below show you how to get this graph. You should first read the data. To do this, go to the page named “Yahoo Index”. The screenshot demonstrates how you can select different indices and then choose the starting point of the data (just like you would if you went to the yahoo.finance website and did this by hand). Note that the starting date is 1927. This process creates URL’s and then runs a macro that reads the data. To read the data, go to the top of the page and press the button named “Read All”. Note that if you have not already done this, you should press the button named “Clear Data”) to clear out the existing data and create new sheets that appear at the end of the file. After you press the button named “Read All”, you inspect the data and make sure it is read in correctly. After reading the yahoo indices, you can go to the page named “Exchange Rates” and read in the inflation rates and exchange rates so that you can adjust the indices to put them in comparable currency or in real terms. You can also run the macros to read the data in the sheet name “Read Stocks”.
.
.
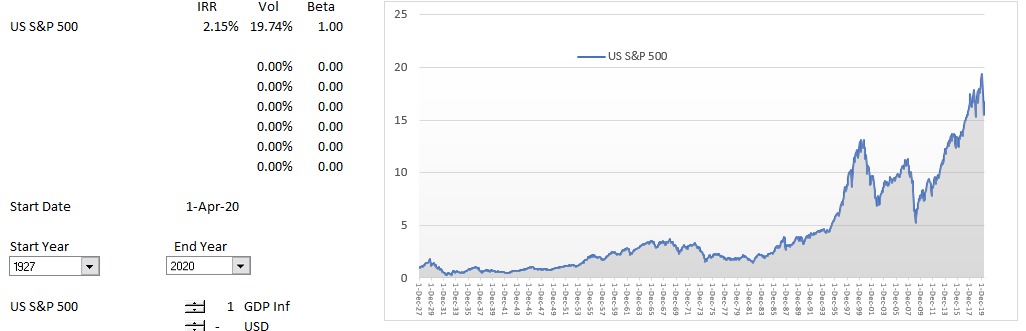
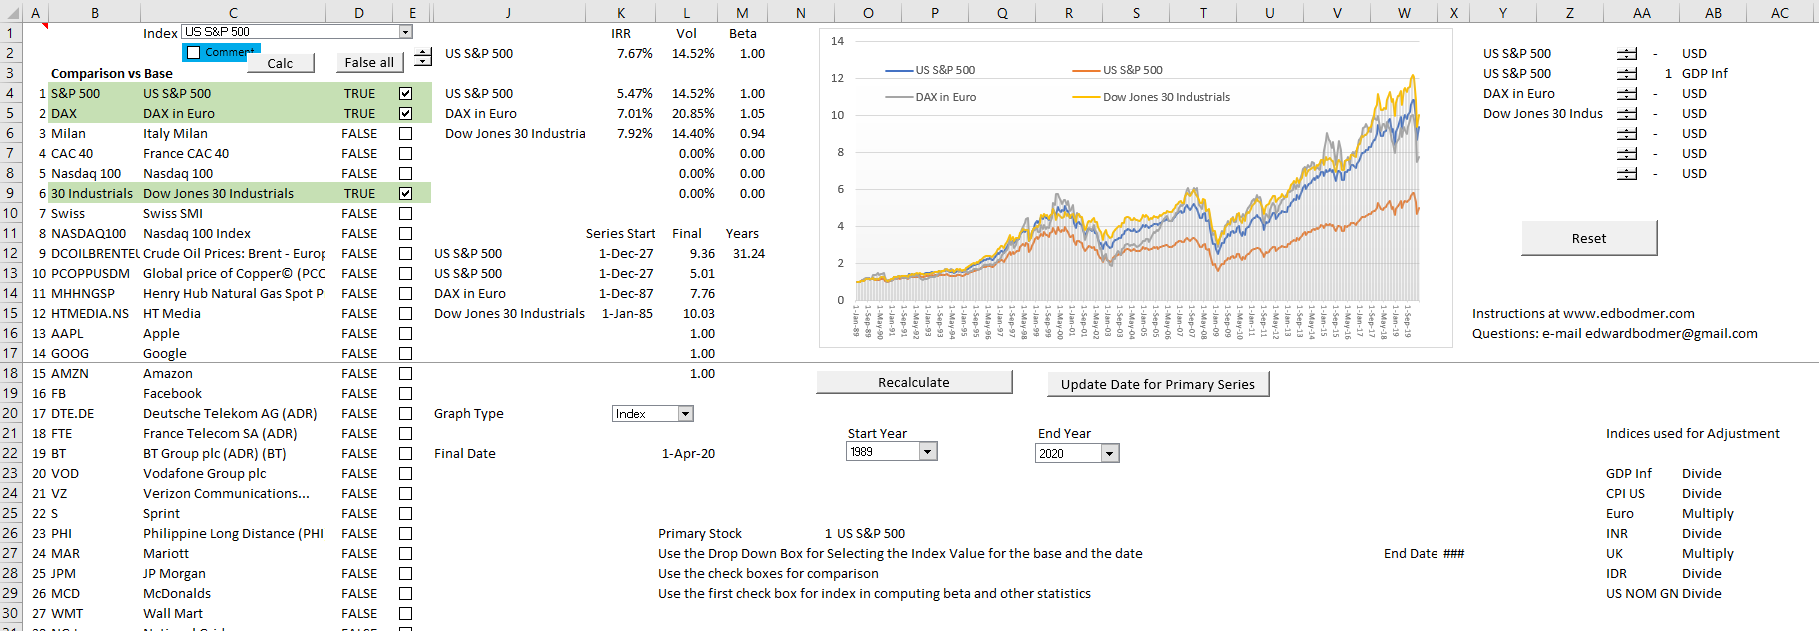
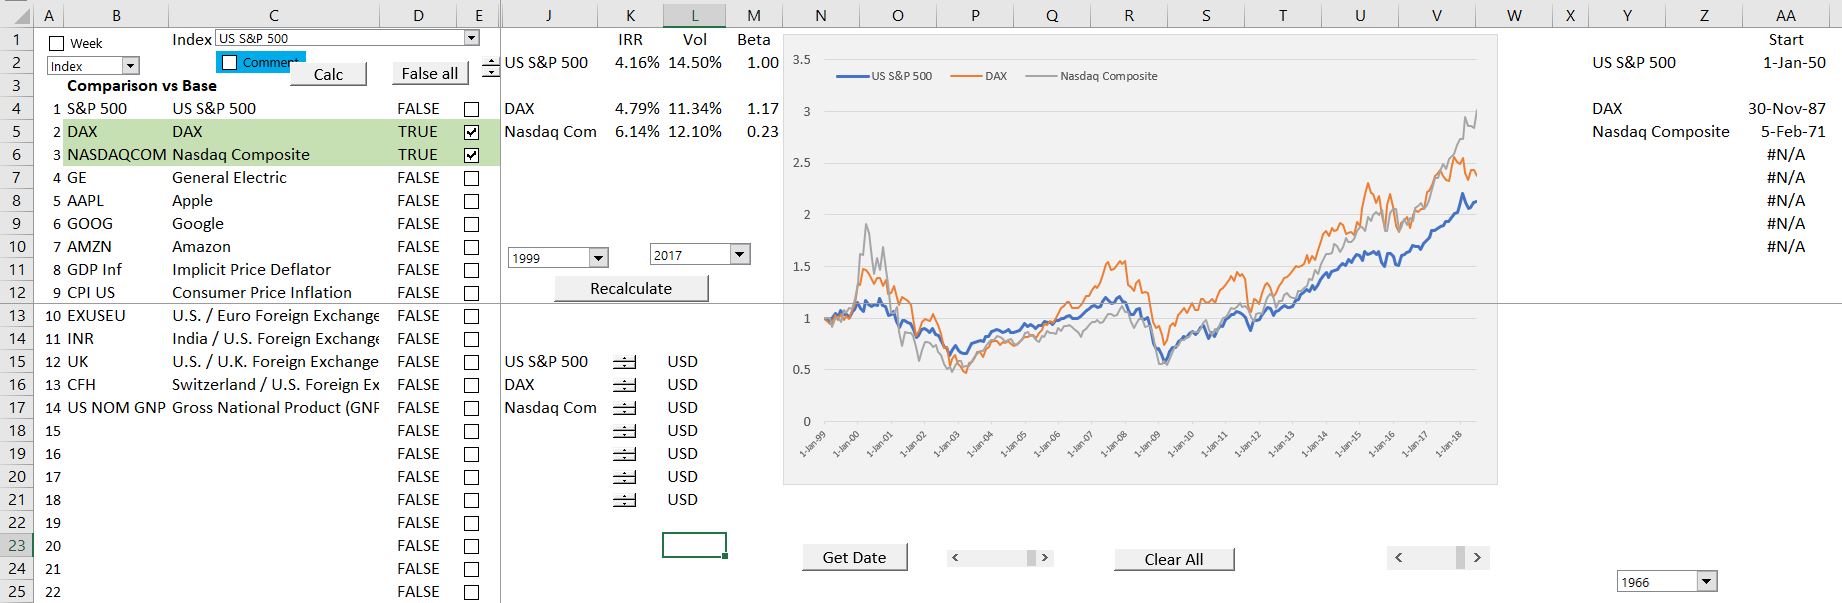
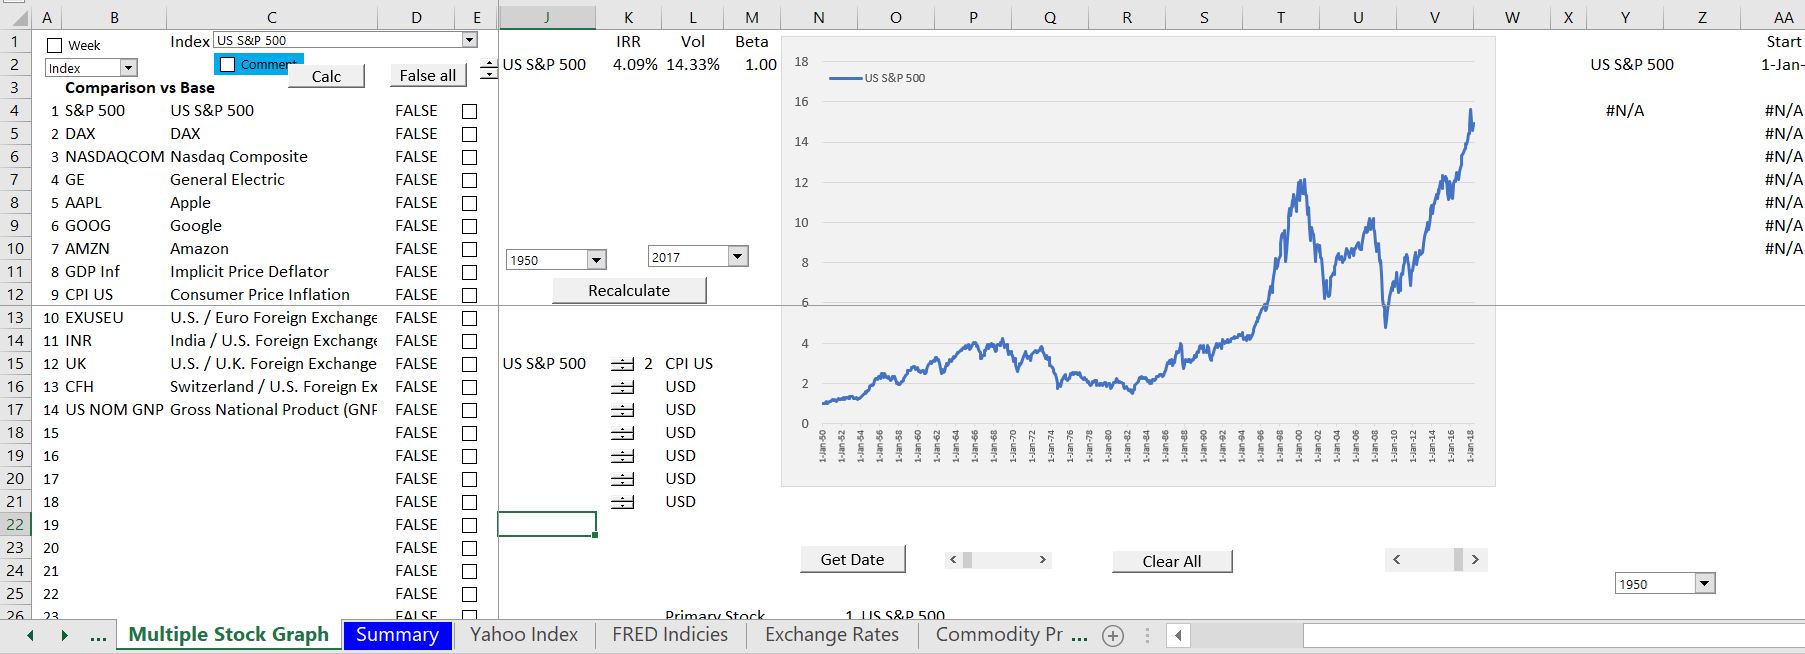
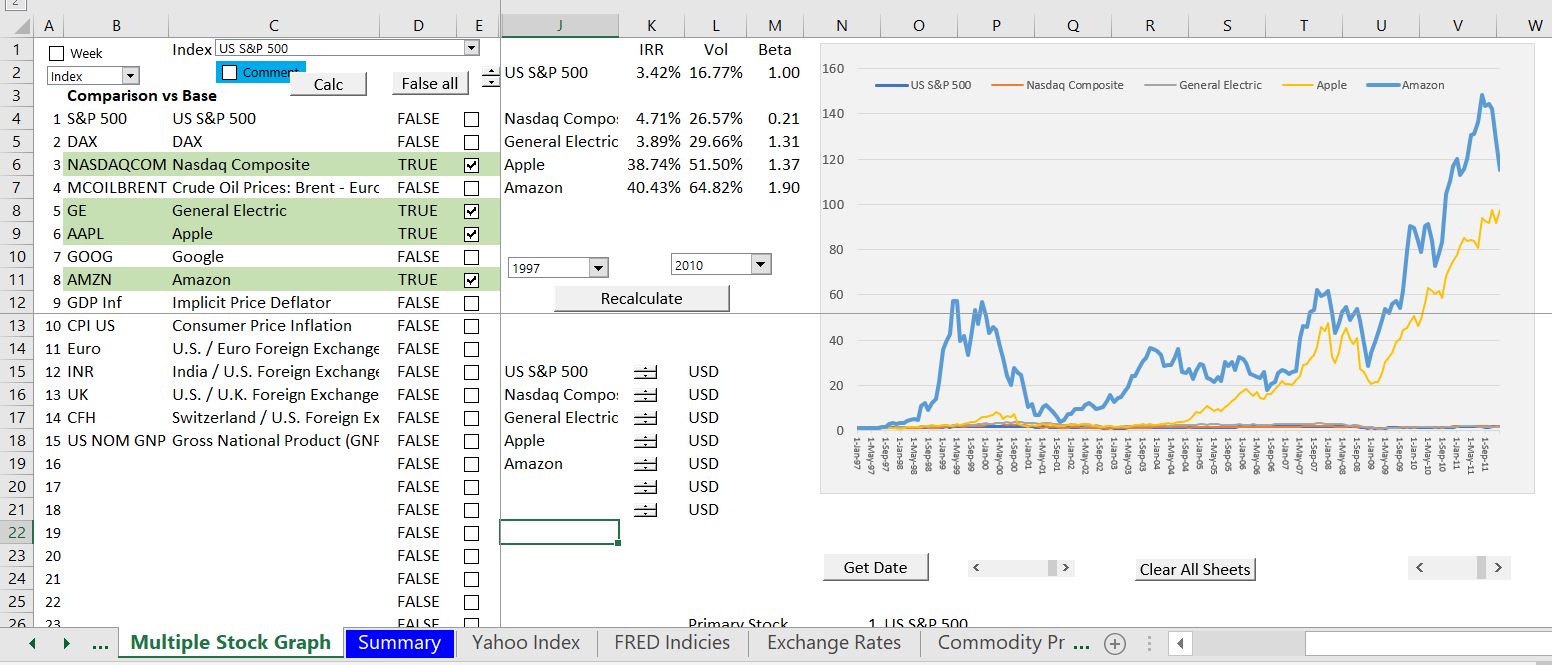
After reading in the data, you can go to the sheet named “Multiple Stock Graph” and play around with the graph. I have put a screenshot of some of the things you can do with this sheet in the screenshot below. In the screenshot I present the nominal S&P index with the Real S&P index. The drop down box at the top left allows you to select different stocks or indices or commodity prices as the base value (for example you could compare things to the oil price). In the example, the graph begins in 1989, but it could begin in 1927. This is done with the dropdown box for the years. When you change the date, the IRR is computed assuming you buy the stock at the beginning of that year. The options at the right of the graph illustrate how you can adjust the stock prices by inflation indices or exchange rates. The list at the left allows you to select different stocks, commodity prices, indices or economic series by clicking on the check boxes. In the example shown below, I compare the S&P with the DAX in Germany as well. You can see the start date of the index so that you do not go back before the index starts. To see details of how the process works you can go to the webpage on technical details. To see how to make the graphs with flexible numbers of stock prices, you can go to the page that explains this. When the graphs do not look correct, press the recalculate button.
.
.
Updates to the Database – Interest Rates and Bonds
I have also made a revision to compare the value you would generate from bonds with stock indices. I want to do this to test the reasonableness of the silly estimates of the equity market risk premium. I started thinking about this a long time ago when I used to testify about the cost of capital and I would be forced to use the capital asset pricing model. The problem with comparing bonds to stocks is that the yield on bonds is reported by FRED (the federal reserve economic database). So, when reading the interest rates, I add two columns to compute and Index that you would earn from investing in a bond. To create the index, I push the interest rate to the right. Then I divide the index into periodic periods and divide by 100 to express the index as a percent. Finally, I create and index from the interest rate that measures how much return you would make from buying the bond and then re-selling the bond later as you re-invest the interest you are earning.
.
.
Using the Comprehensive Stock Price Data in Simple Manner
.
When you open the file above, it may seem intimating, it is to me. (I admit that I am sometimes afraid or my own files). So, I have tried to include a simple step by step explanation of how to use the stock, commodity and economic database file in this section. If you want to try this simple case, you can download another file that is blank and has options to download only a couple of shares. You can also download a separate a second simple file that has this example completed. So, in this section I proceed from a blank file and illustrate how to use the approach. I have attempted to explain this in a step by step manner.
You can download the simple files by clicking on the buttons below. The first file is completely blank and can be used to work through the exercises below. The second file has a completed version of the exercise.
.
Step 1: Entering Data in Separate Sheets for Different Stocks and Economic Series
To begin the process of stock analysis, you need to enter the ticker symbol or FRED symbol (FRED stands for Federal Reserve Economic Database). There are a separate pages where you can enter different ticker symbols or FRED codes. After you enter the ticker symbol and re-calculate the spreadsheet and the company name, then the new item appears on the menu in the page name “Read Stocks”.
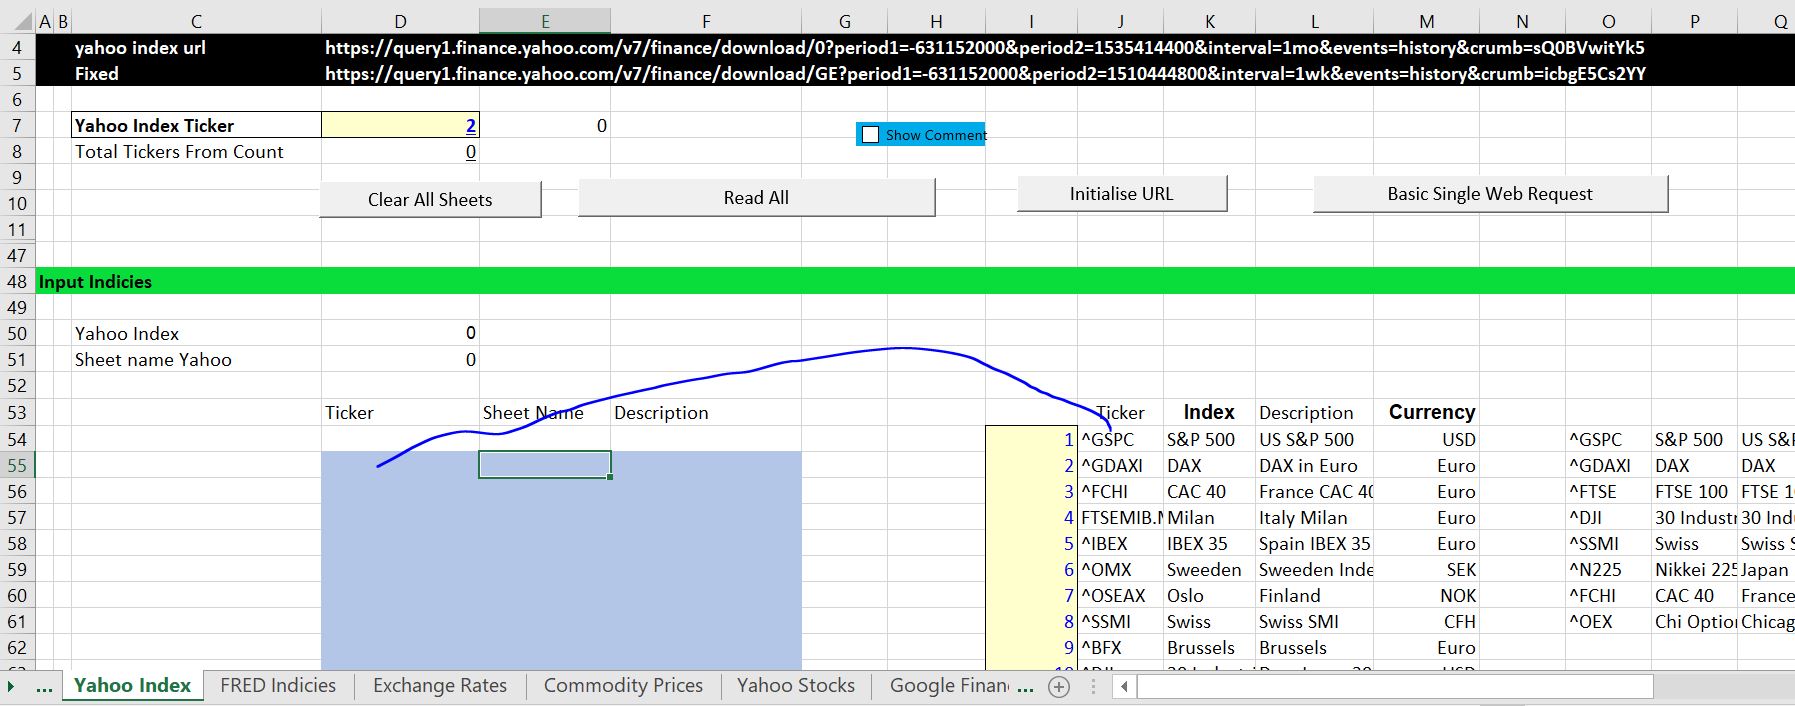
In the screenshot below, the manner in which you enter data for stock indices that are compiled on finance.yahoo.com. You enter the ticker in column D in the blue area. In column E you enter the code that will used in the menu and check boxes. Finally in column F, the description of index is input. After you select indices, you press the Read All button. Each index is put into a different sheets. If you clear the sheets, you can start a run and it does not take long to read all of the data.
.
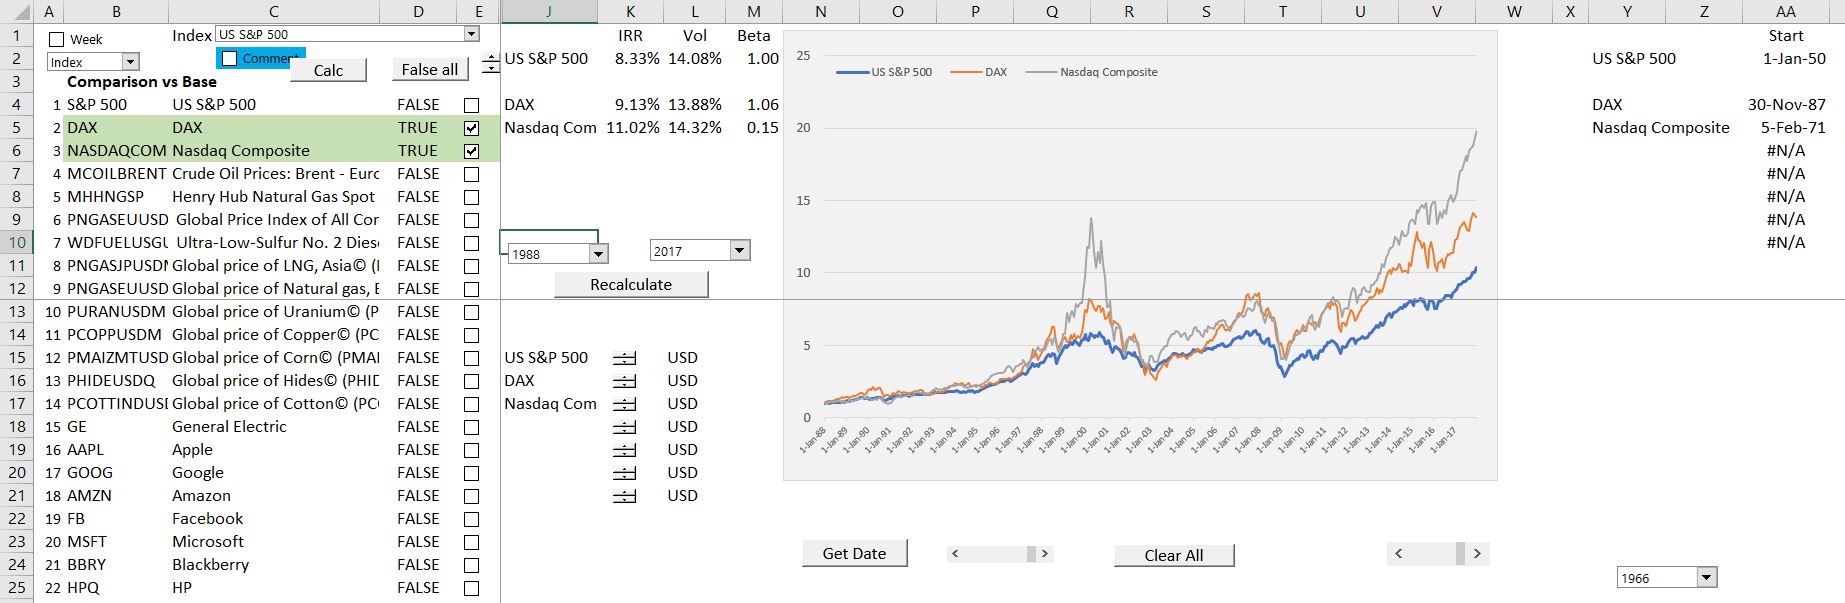
Once the data is put into a sheet (see the sections below), you can select the base series. In the example that is used I put in the DAX and the S&P 500 as two indices. When you use the drop down box you can select the basis for comparison. This is used for Beta statistics and creating a time series. This could be GDP or Oil prices.
.
.
Note that the graph above has not been repaired for removing the #N/A on unused the series. Note also that the IRR, the volatility and the Beta are presented. Click on this sentence to go to the page that describes how to get rid of the #N/A.
Step 2: FRED Data for Time Series Data
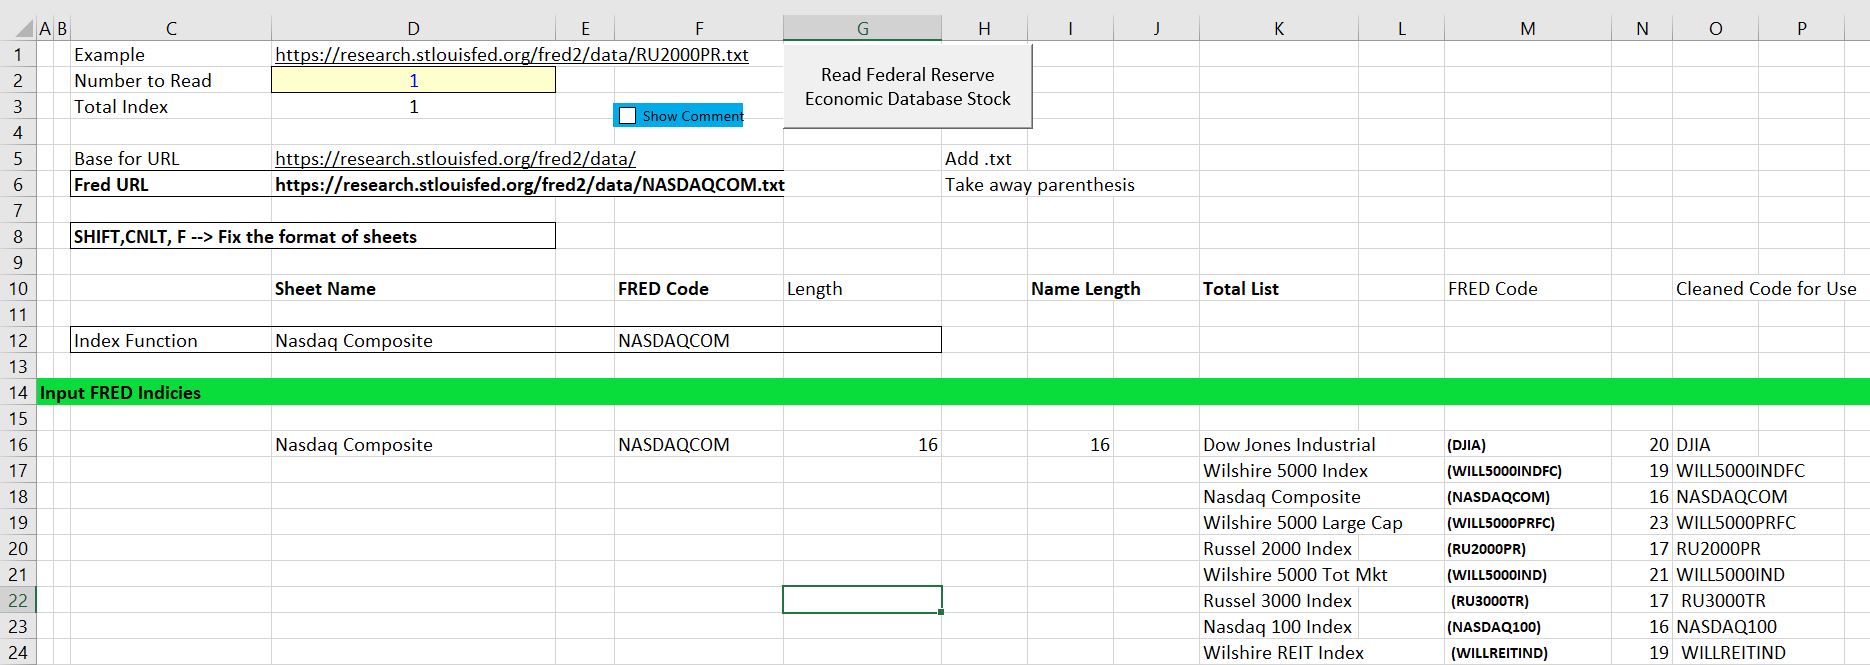
The next step demonstrates how to acquire data from the FRED database which includes other stock price indices. The process of entering data is illustrated in the screen shot below. There is a list of many of the stock indices in column K. Next to the name of the index, the FRED Code is shown. The code includes brackets which have to be removed. In the screenshot below I have selected NASDAQ from the list and copied the code into F16.
.
.
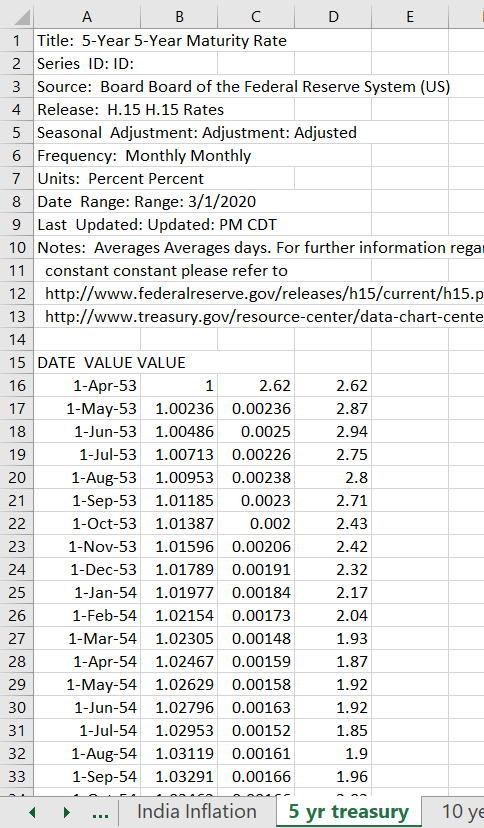
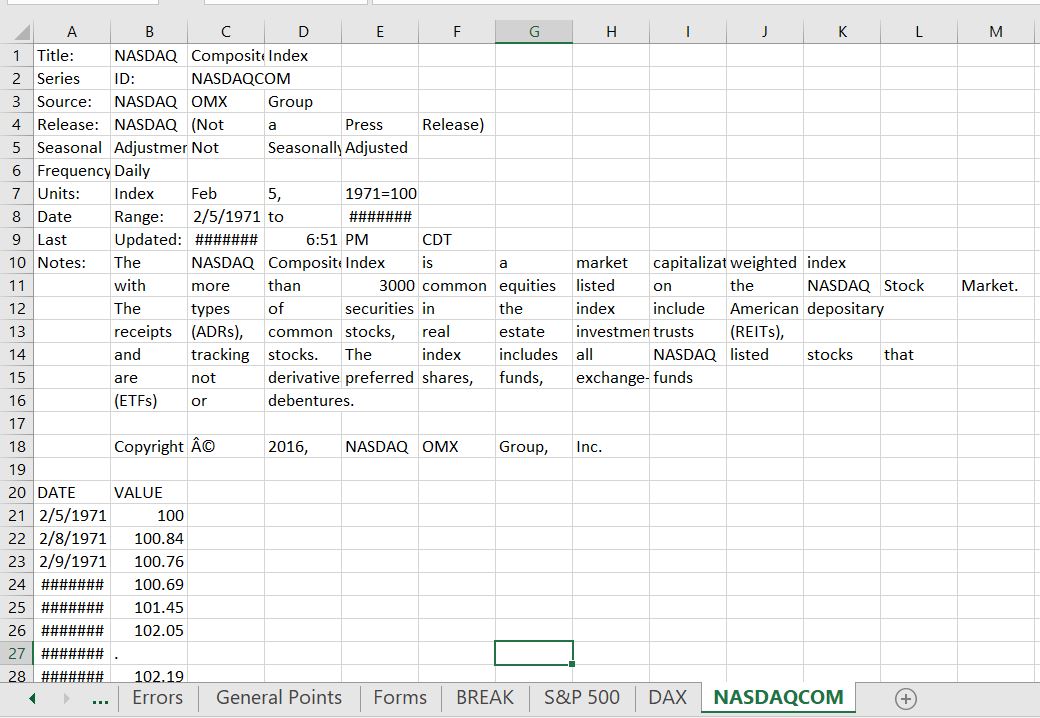
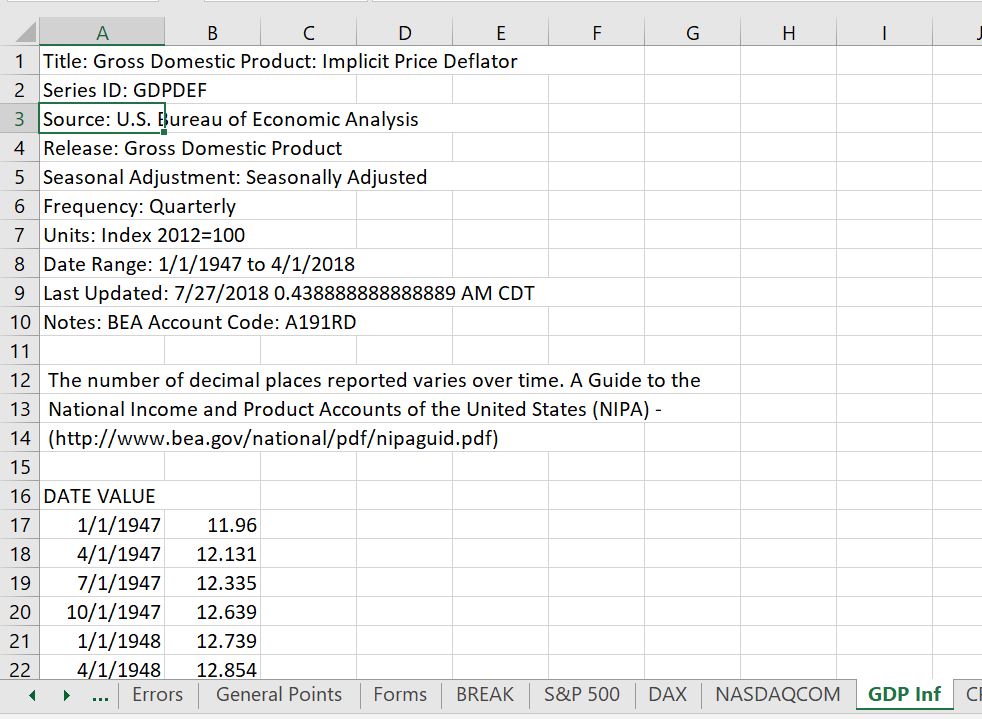
After pressing the button titled “Read Federal Reserve Economic Database”, the NASDAQ is put in a new sheet. The sheet has the name of the FRED code as shown in the screenshot below. When the data is read into the file, it looks like a mess at the top (because of the text to columns code in the macro). Note also that some of the values are not entered.
.
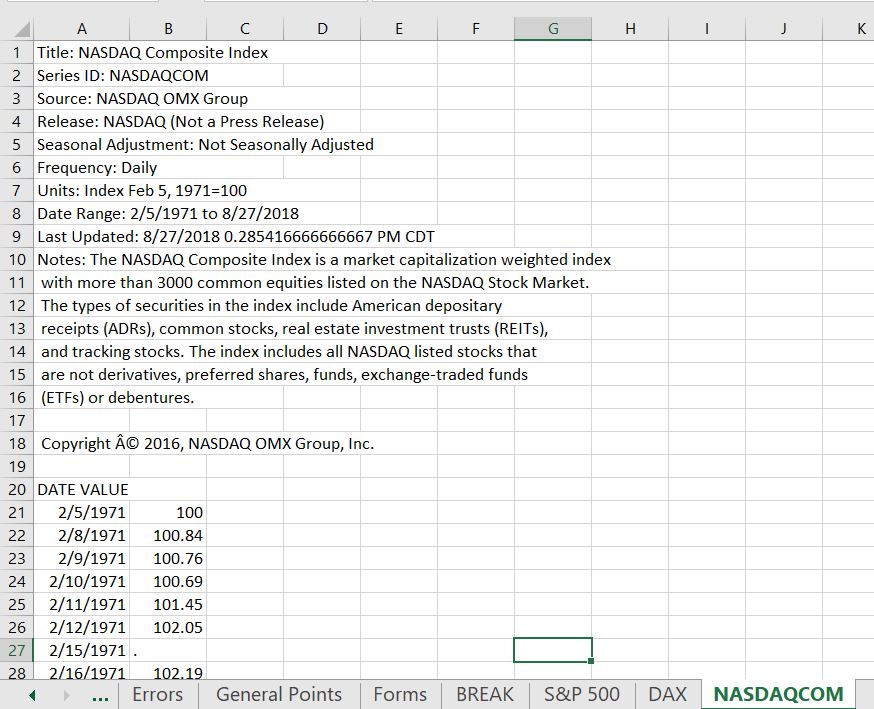
You can clean this sheet up by pressing SHIFT, CNTL, F. The clean-up can be done for any of the items are read from the FRED database. The screenshot below illustrates the sheet format after it has been cleaned up.
The screenshot below illustrates a comparison of the S&P 500, the NASDAQ and the DAX where the data sources are from different. The start dates are shown in column AA which allows you to change the start dates.
Step 3: Download Inflation, Exchange Rates and Economic Series
The sheet named exchange rates allows you to download series from the FRED database. The first six series from the this page are used for deflating or adjusting the data for inflation. Out of these first six series the first two are designed for inflation. For these series the following formula is used:
Deflated Data = Raw Data/Inflation Index
Some stocks and indices are not expressed in USD by finance.yahoo. For example, the DAX index is expressed in Euro. To compare series, you may want to convert series to USD. For the exchange rates, the USD/Other Currency is Used. If the exchange rate is multiplied by the raw data, the raw data is converted to USD. This is illustrated below:
Data in USD = Raw Data in Other Currency x USD/Other Currency
The screenshot below illustrates how to enter various inflation, exchange rate and economic series into the file. A long list of economic series from FRED is listed in column Q with the FRED code listed in column O.
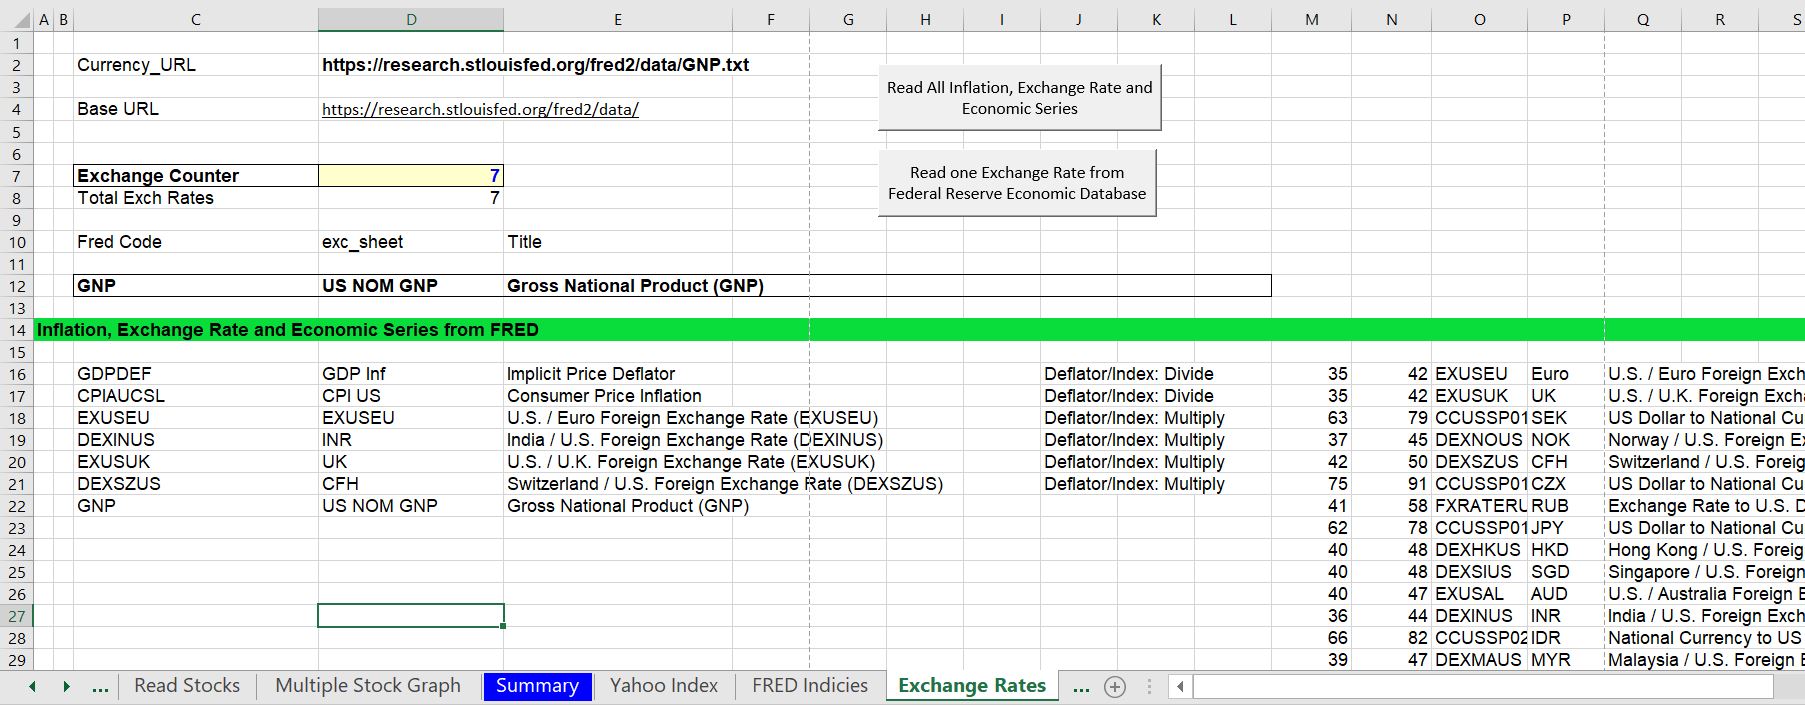
After pressing the button at the top of the page, the data is read into a new sheet. An example of how the data is read into a new sheet is shown below. After reading in the data, the indices are used to deflate the data if the option is chosen.
.
The process of adjusting data is illustrated in two screenshots below. In the first screenshot the DAX, S&P 500, and DAX are shown without adjustment.
.
.
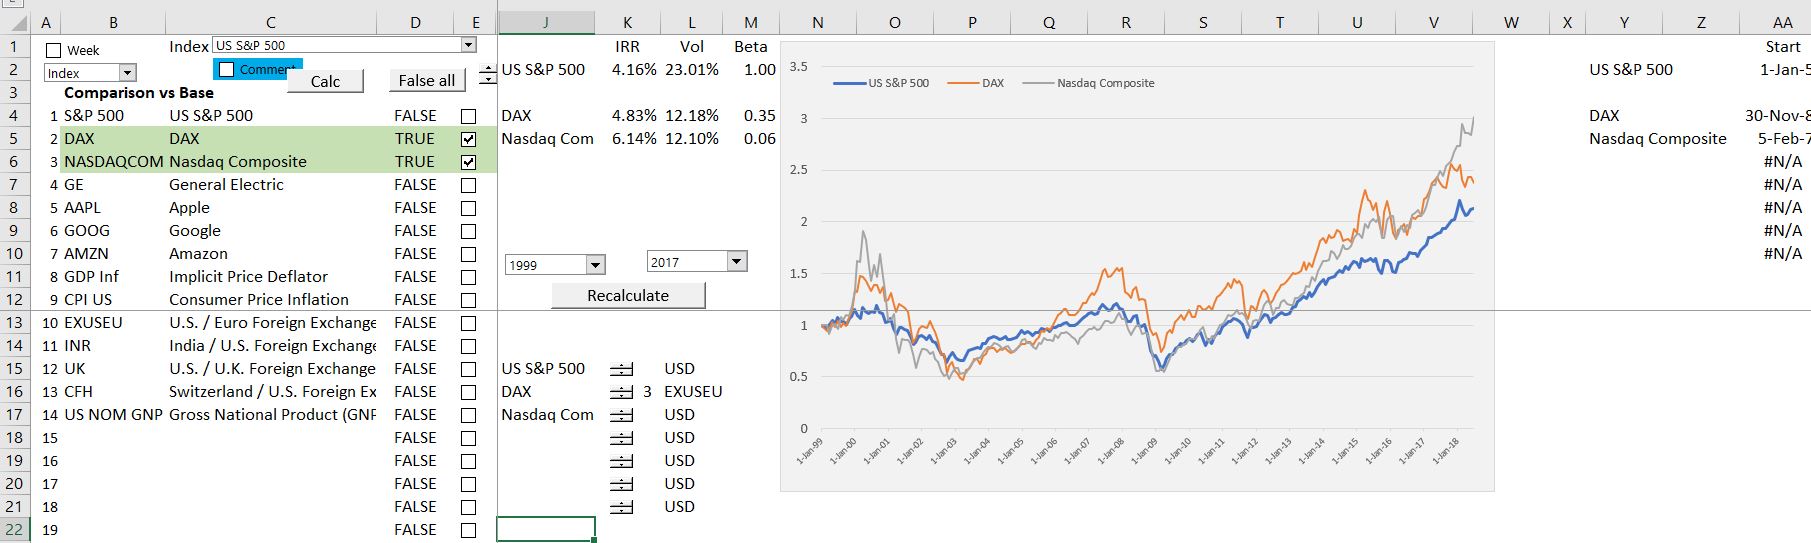
In the second screenshot, the DAX is adjusted for the Exchange Rate. In this case, the index of the USD/Euro exchange rate is computed. This index is multiplied by the DAX value. The DAX growth rate and index value is then computed.
.
.
In the screenshot below, the S&P 500 is deflated by the price index. This is done by using the spinner box in K14. Note the lower IRR which reflects the real increase in wealth from holding stocks.
.
.
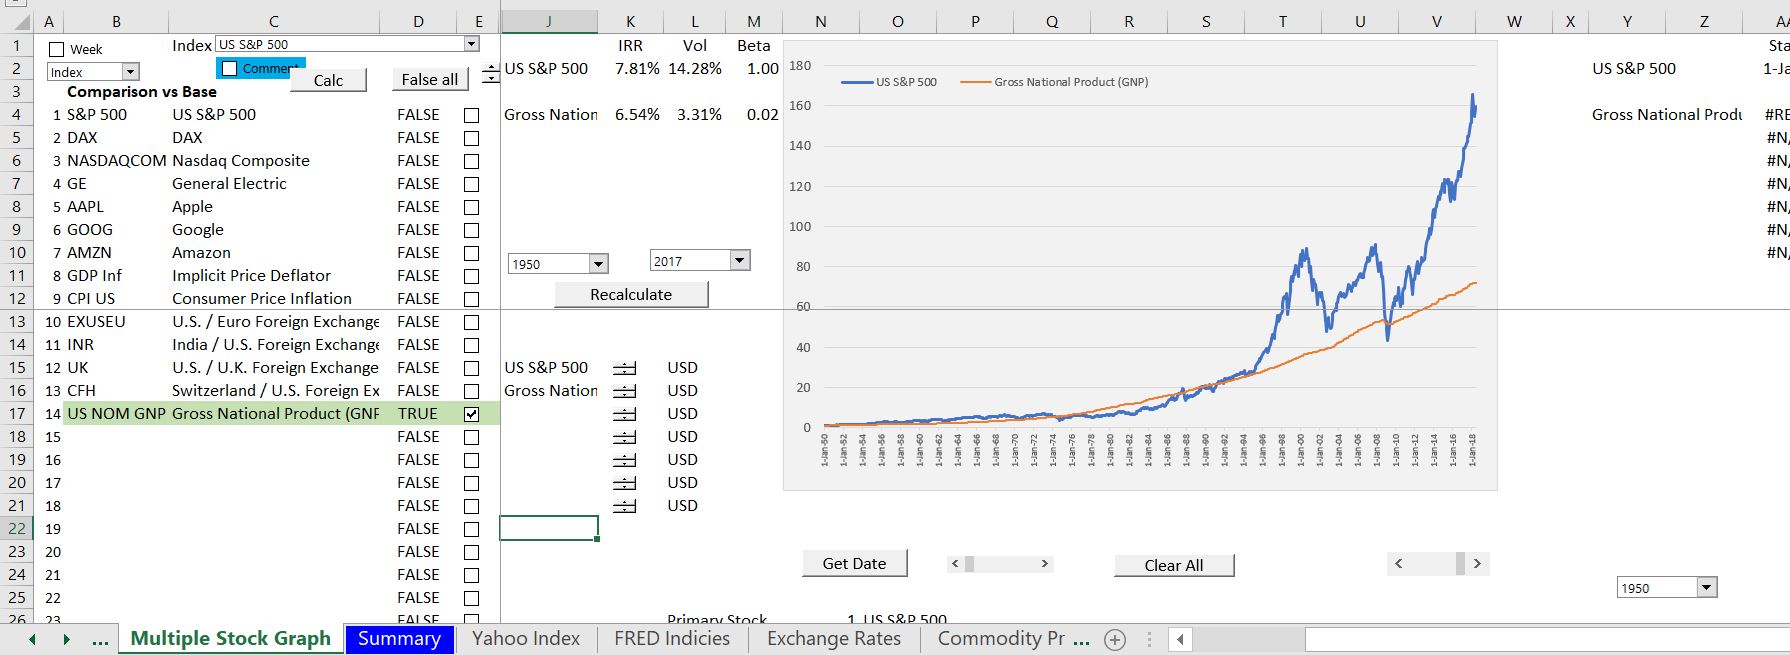
The screenshot below illustrates how the economic time series can be used. The initial screenshot of this section included the GDP. The graph demonstrates the dramatic dispersion between growth in stocks and growth in income.
.
.
Step 4: Download Inflation, Exchange Rates and Economic Series
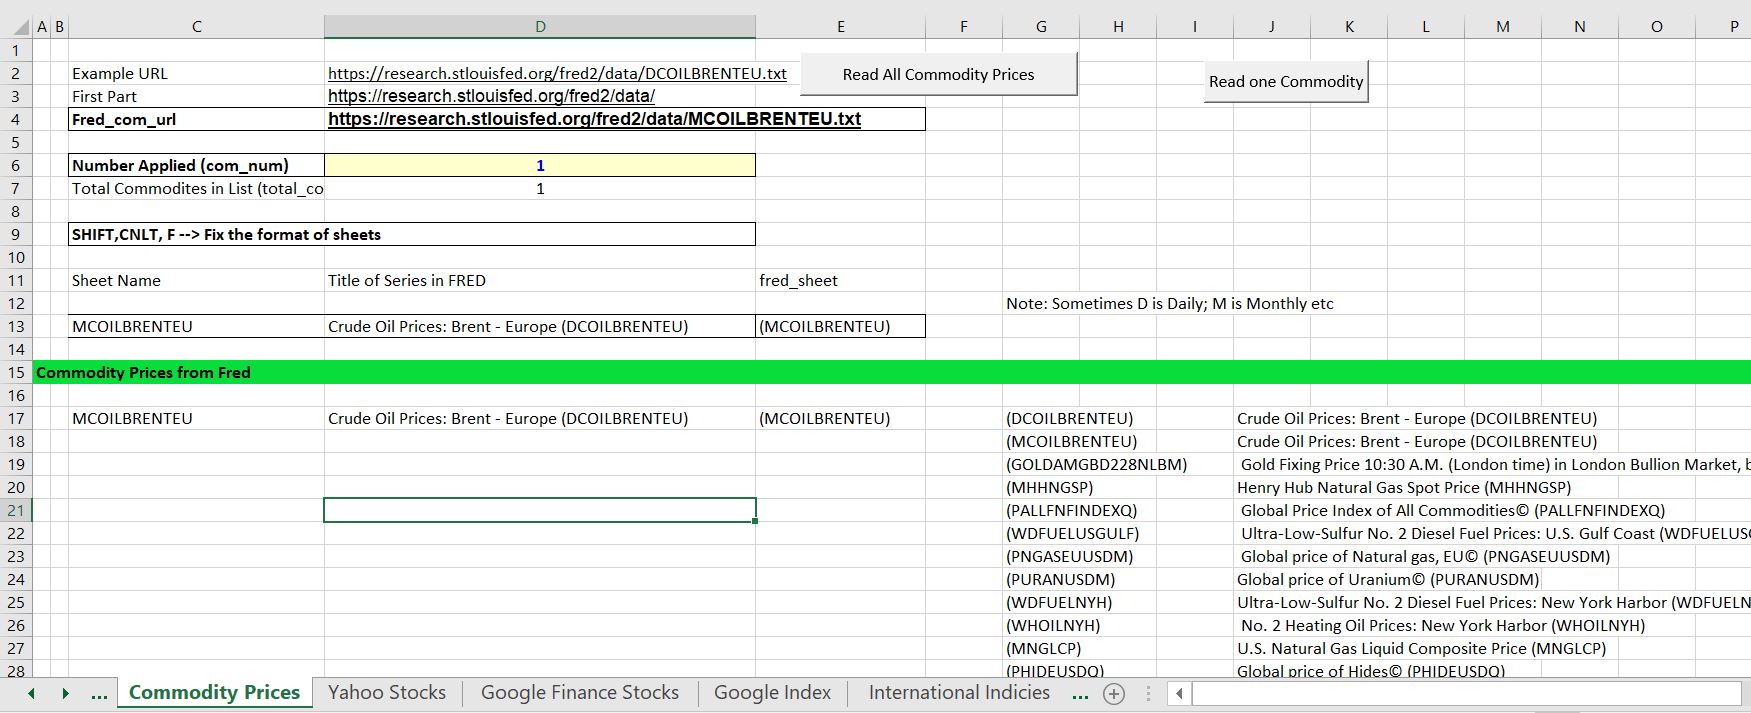
After entering the economic series, you can move to the commodity price page. You could use the whole file as a method for comparing commodity prices. The screenshot below demonstrates entering codes for the commodity prices. As with economic series, this data comes from the FRED database. In the screenshot below the list of commodity prices in column J.
.
.
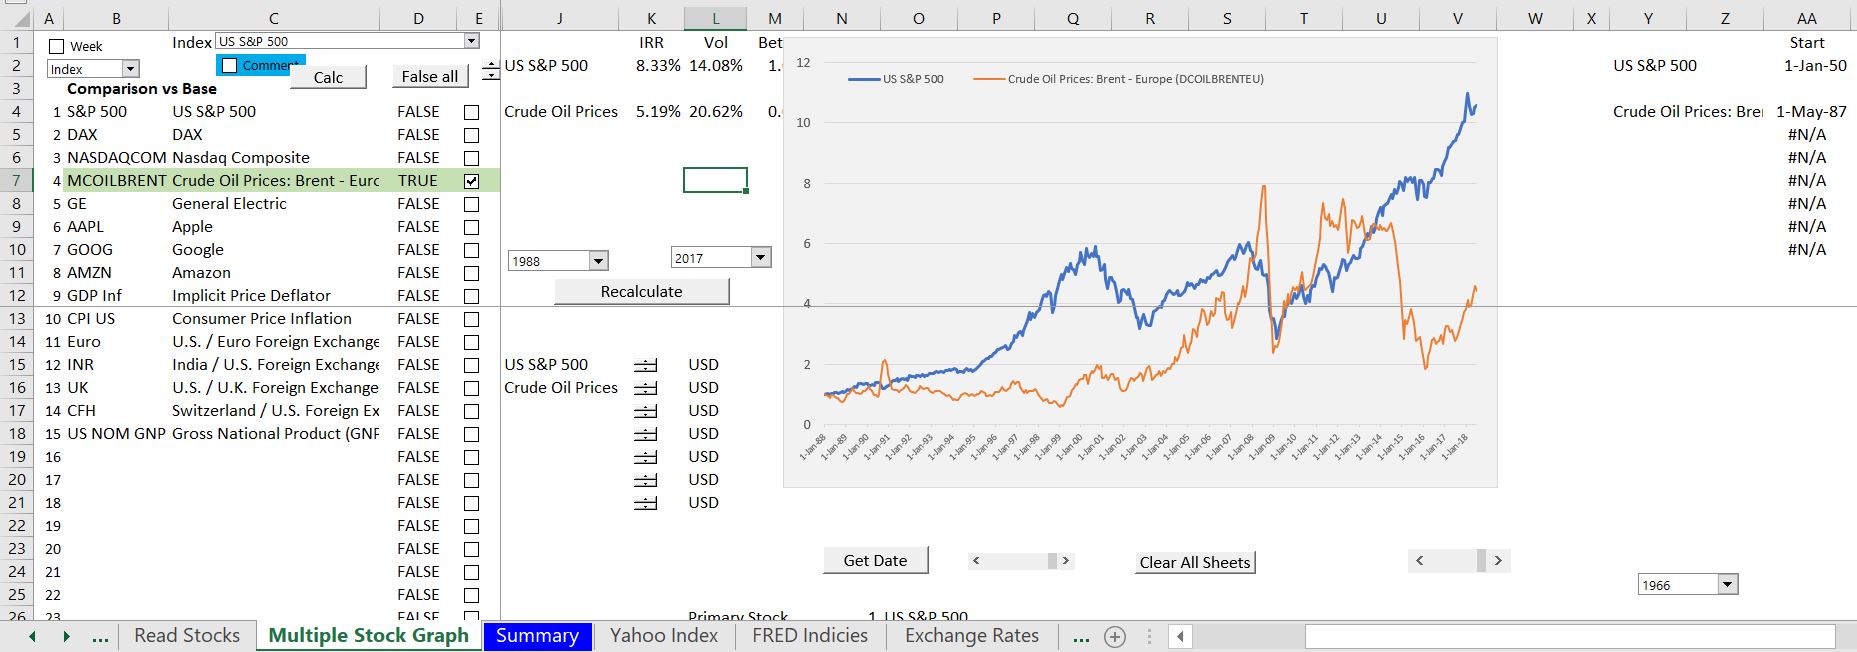
After pressing the button to read the commodity price data, the prices are put into new sheets. After you enter the data, there is a new item in the menu on the graph page which is named the Multiple Stock Price Graph. In the screenshot below, the False button is pressed and then the Oil Price is clicked.
.
Step 5: Downloading Individual Stocks
The final step addresses how to include individual stocks in the analysis. You can go to the page Yahoo Stocks and enter the ticker symbol from finance.yahoo.com. You should also enter the name of the company. Once you enter the data the entire list is shown in the Read Stocks page. As you enter more companies, the list becomes longer.
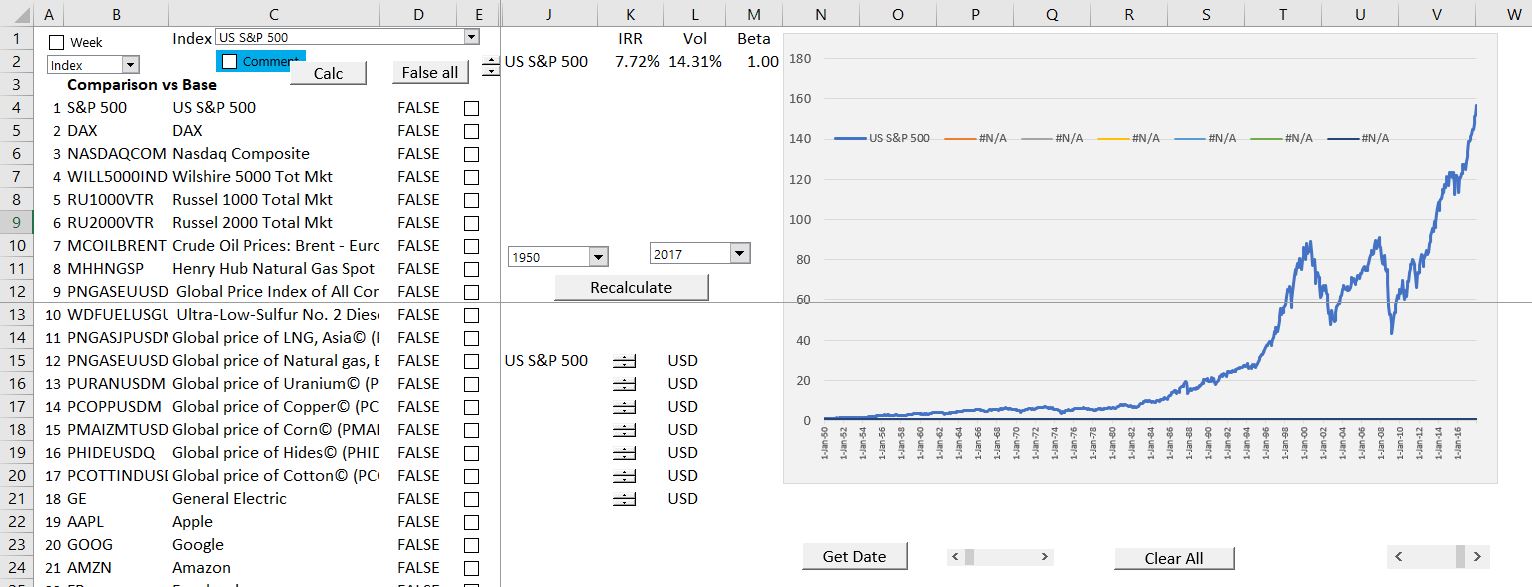
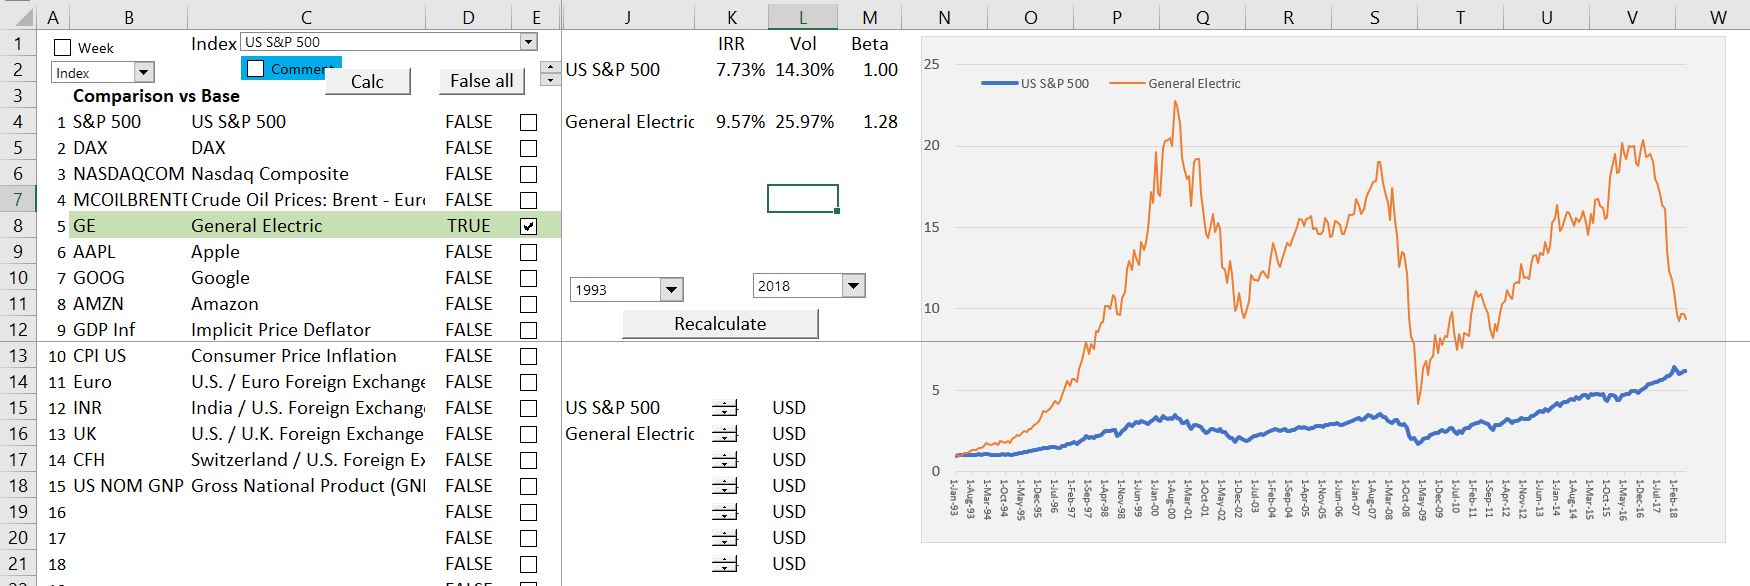
After pressing the button on the yahoo stocks page, the data for each stock is put into different pages. One of the stocks read is GE. The sad graph of GE is shown below. Because of dividends, the return on GE is still above the overall market for the time series selected. If you change the time period you can evaluate if the beta is stable.
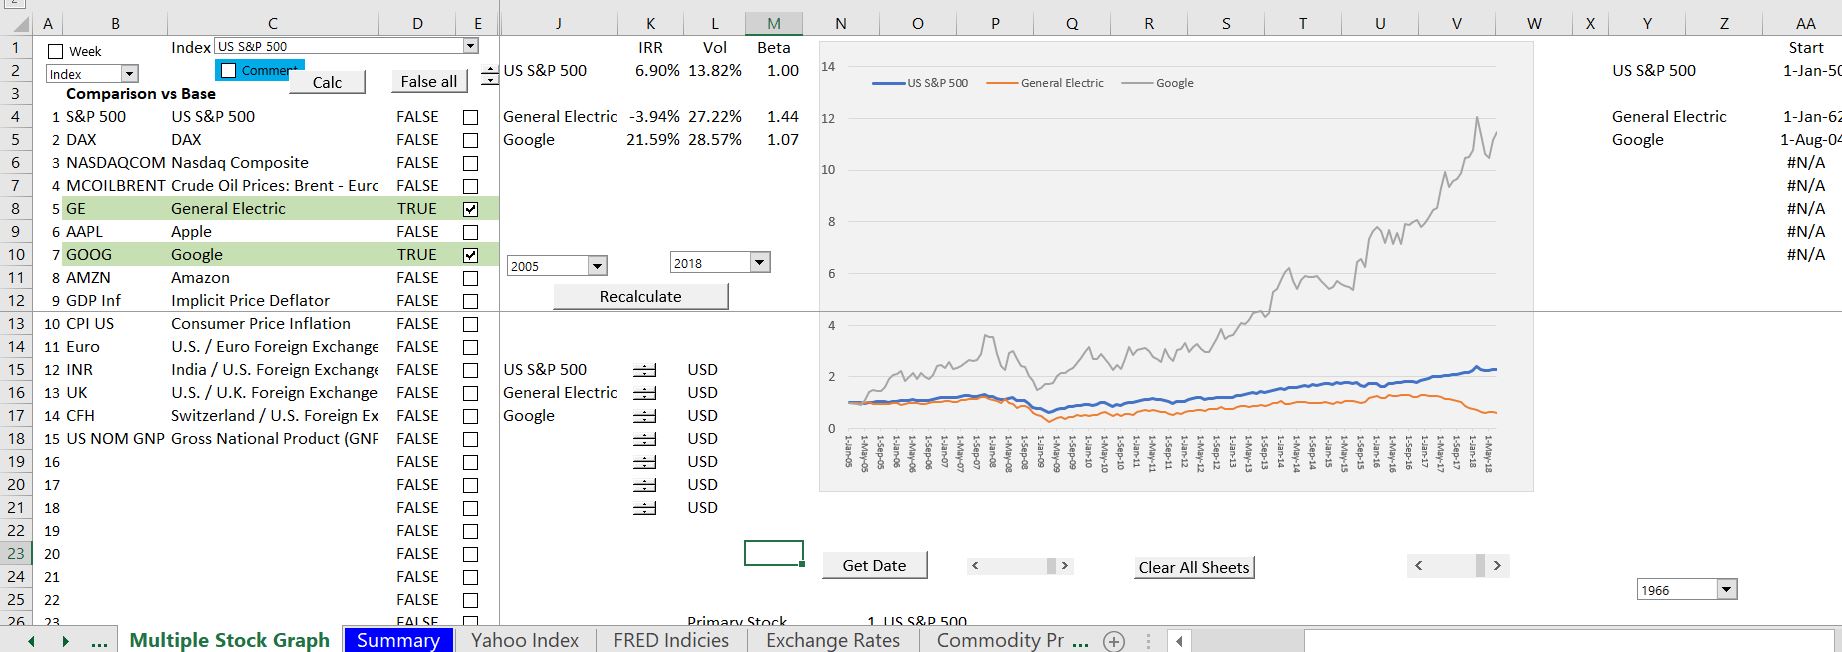
A second analysis that includes Google is shown in the screenshot below. The google versus GE and the market demonstrates the dramatic growth in Google shares. You can find where to start the graph in column in AA where you can see that the first period for Google was August of 2004. Even with the very high growth in Google shares, the IRR is 21%.
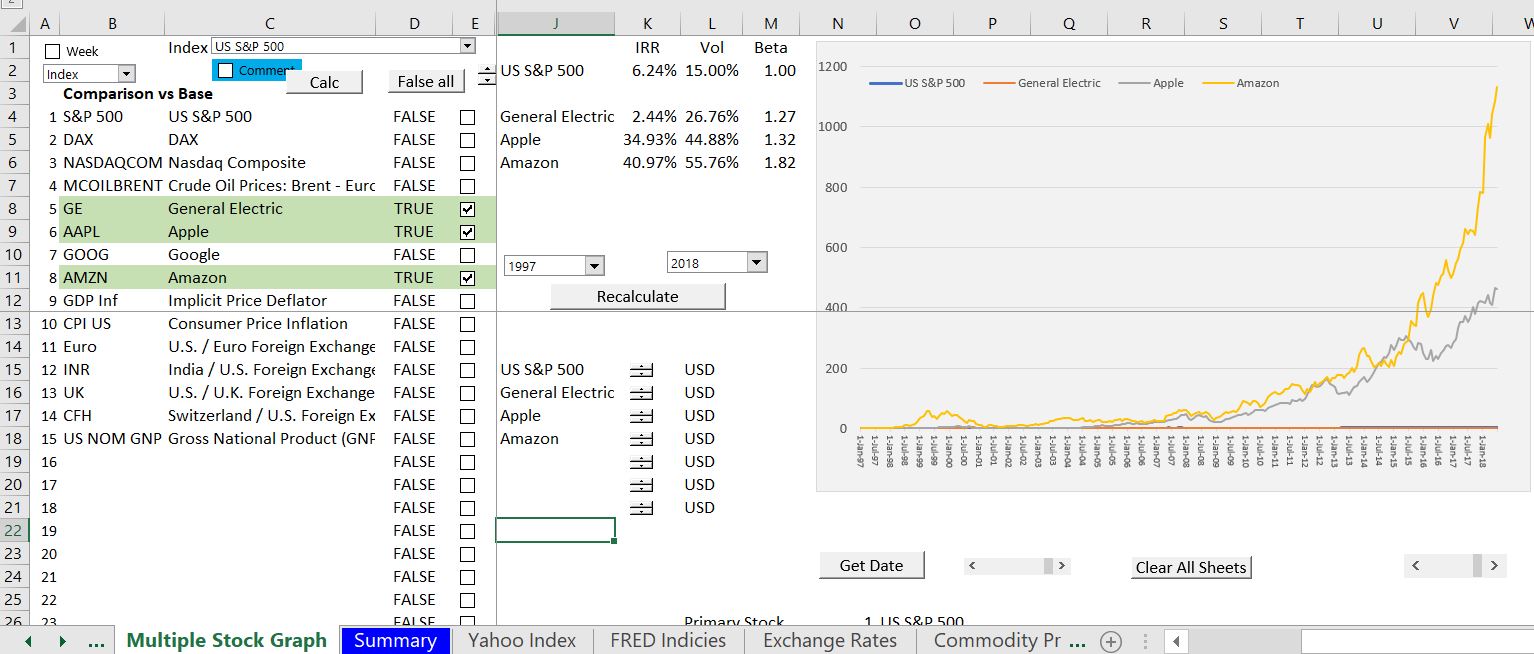
The graph in the screenshot below includes Amazon and Apple. Note that the increase in Amazon is dramatic. The question about whether this growth is justified is addressed in the financial database. Note that the stock price indices hardly show up.
The graph below illustrates how you can make an analysis with different time periods. The graph demonstrates the decline after the crash of 2000 when the stocks fell dramatically. The screenshot also shows the differences in volatility and beta.
Demonstration of the Stock Price, Commodity Price and Economic Series Database
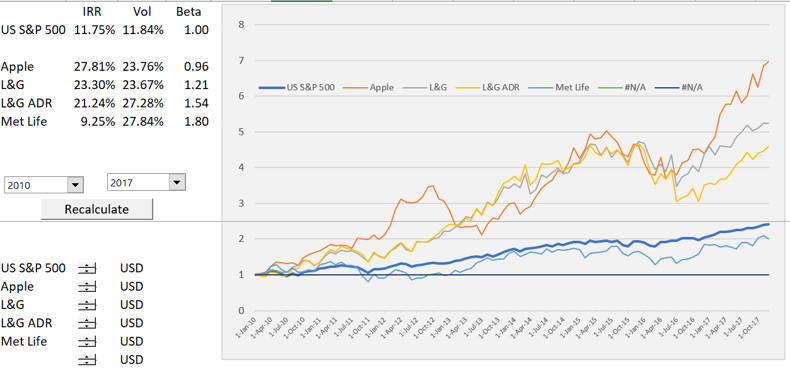
The graphs below demonstrate how you can use the comprehensive database. The first screen shot demonstrates how you can compare different stocks for different time periods (you just click on the check boxes and select the starting year). The graph shows the the index values of the stocks starting from the first selected date. The volatility of the stock and the IRR of the stock from the initial date is also presented. In the graph below the rate of return on the stock market since 2010 is 11.75% and the volatility is 11.84%. Other stocks had higher IRR’s and higher volatility.
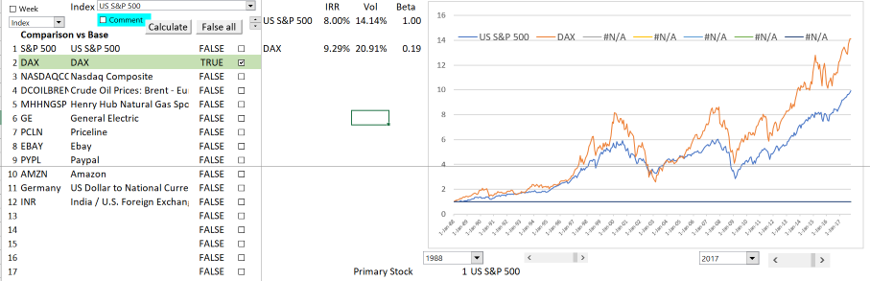
The second graph shows how the German DAX relative to the US S&P. The DAX is converted to USD and the index is created as with the graph above. The graph shows that the DAX has had a higher growth rate than the U.S. market and also has higher volatility.
The video below walks you through issues with using the comprehensive stock price file and illustrates how to compare stocks to commodity prices and economic series. You can see how to select different stocks by clicking on the check boxes; how to select different starting and ending points; how to interpret IRR’s, volatility and beta that are shown for the stocks and how to adjust for changes in inflation and exchange rates.
The video below explains various technical concepts underneath using the comprehensive stock price file with the objective that you can modify the file.
[wonderplugin_video iframe=”https://www.youtube.com/watch?v=ysLvhXSEAvI” videowidth=600 videoheight=400 keepaspectratio=1 videocss=”position:relative;display:block;background-color:#000;overflow:hidden;max-width:100%;margin:0 auto;” playbutton=”https://edbodmer.com/wp-content/plugins/wonderplugin-video-embed/engine/playvideo-64-64-0.png”]
Step 1: Install the VBA Add-in for WebRequest
When you open the file, an instruction panel appears. This panel shows that you should have a check box pressed for “Microsoft WinHTTP Services, Version 5.1.”
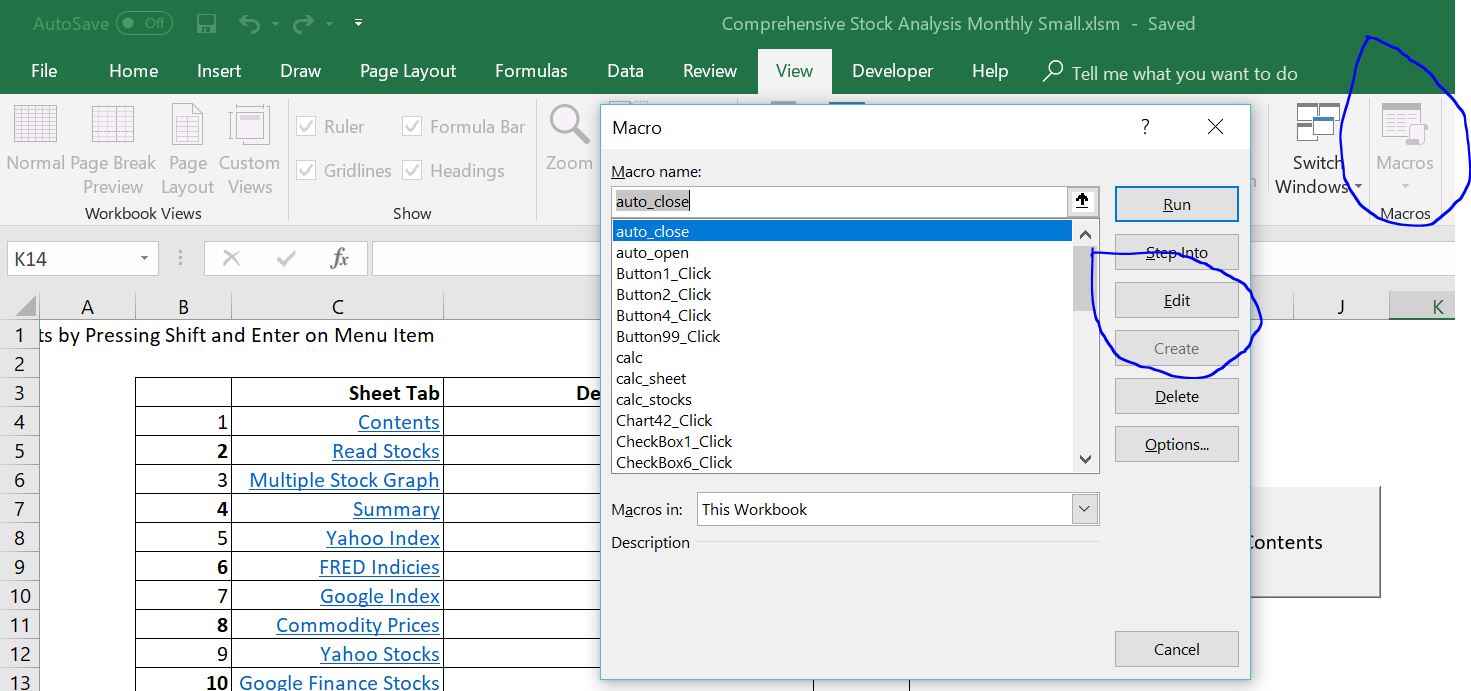
To find this check box you need to get into the VBA editor and go to the Tools Menu. It sounds a little harry, but you only have to do it one single time. To get to this menu you could go to the View menu in excel. Then press the Macros button. Then either select and existing macro or create a new macro. You then get the VBA menu as shown below.
The first screenshot shows how to get to the VBA menu from the View menu. I have circled where you press the macros button. Then, once the macro box appears, select the create button or the edit button. After that, the VBA menu will pop up.
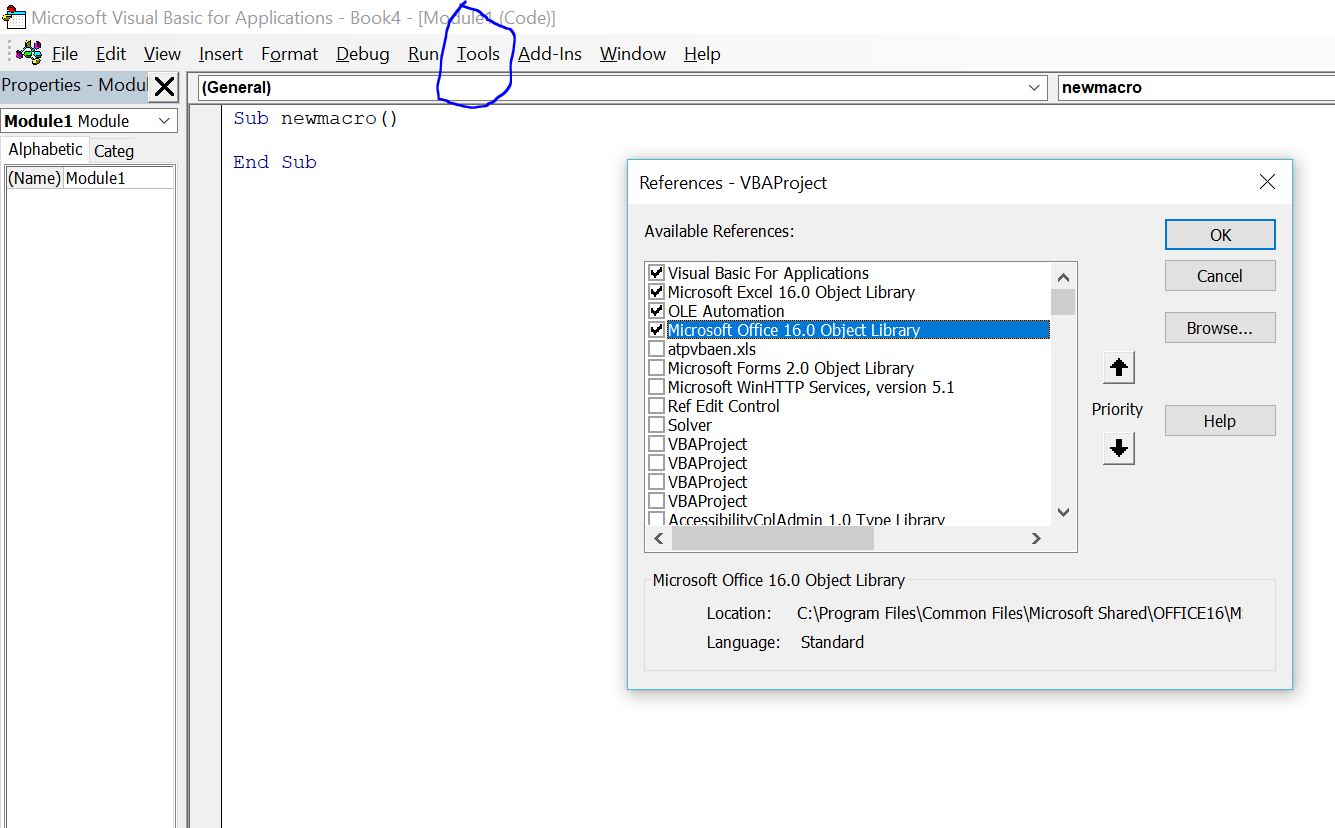
The VBA menu is illustrated on the screenshot below. When this page appears, select the Tools menu as illustrated with my attempted circle. After selecting the tools menu, a sub-menu appears that is not shown. The first option is References. After selecting References, a set of check boxes appears as shown below. Note that “Microsoft WinHTTP Services, version 5.1” is listed and it does not have a check box. You need to make sure that this box is checked.
Comparison of Different Methods for Reading Data
Sometimes the WORKBOOKS.OPEN does not work. This can occur with long URL’s or with URL’s that have crumbs at the end. To resolve this issue you can use the WINHTTP.WINHTTPWEBREQUEST method. To do this you much do the following:
1. Add a dimension to the VBA that defines a variable that will be used to get the data
2. Use the SET command to set the variable defined above as a WINHTTP.WINHTTPWEBREQUEST
3. Use the GET commend to get the data
4. Retrieve the data into a long text.
5. Use a dimension variable and define it to a RANGE to make the process convert the string to a text.
The VBA code for doing this is illustrated below. Underneath the diagram is a short excel file that illustrates different methods to work with this.

When you use the WinHttpRequest, you need to open VBA and select an add-in from the reference menu. If you don’t do this the method will not work as demonstrated below.

To enable the add-in you should first go to the references menu after opening a macro (press the ALT, F8 key to get the VBA menu and open create a new file or use and existing file). After you are in the VBA page, go to tools and references. Then select the WinHTTP services as shown below.
Acquiring, Comparing and Analyzing Stock Price Data
Downloading and Comparing Stock Prices and Computing Betas and Volatility
I have a whole lot of files and analysis associated with reading and performing statistical analysis on stock prices. Indeed, on the google drive I have an entire separate folder for reading and analysing stock prices. The best file is probably a file named COMPREHENSIVE STOCK PRICE ANALYSIS. This file can be used on a monthly or daily or weekly basis. This COMPREHENSIVE STOCK PRICE ANALYSIS file available for download below the videos go to google finance.yahoo.com and read data on different sets of stock prices. I think the best source for reading stock prices was finance.yahoo.com. But now yahoo has removed the possibility of reading the data in a simple manner with WORKBOOKS.OPEN. Somebody from a company from signal.com showed how to use WinHttpRequest and the first file below uses this method. I have also made various files that can read stock prices from google finance rather than from yahoo.
This COMPREHENSIVE STOCK ANALYSIS file is intended to enable you to compare prices of stocks with other stocks, with various different indices, and with commodity prices. Examples of statistical analysis are included and you can make comparisons between stocks in different countries using a common exchange rate. The file that contains the VBA code and the equations to do this analysis are in a file named “comprehensive stock analysis.” There are two ways you can use this file (like many others). You can try to really use it for stock analysis (or you can use it for case studies). But I don’t think many of you will do this. Alternatively you can use this as a collection of different ways to gather data and then make presentations. I have tried to put all of the different methods ranging from WORKBOOKS.OPEN to WinHttp.WinHttpRequest to putting together stock prices from multiple pages of a web page. Sources of data and different methods of download are demonstrated for the Federal Reserve Economic Data Base: http://fred.stlouisfed.org/categories, Yahoo.Finance and GoogleFinance.
I have made two videos that describe this file and also a rough power point explanation. The file includes innovations (for me at least) on how to make the process efficient through only re-calculating ranges. It also allows you to use different indices as a way to evaluate beta. The file can be used to evaluate commodity prices, exchange rates, inflation rates and interest rates. Two videos describing how to use the file and then how to work on technical macro aspects of the file are shown below.
Other files demonstrate how to make statistical analysis with stock prices, make scatter plots, normal plots and various other kinds of analysis. In the files below this paragraph you can enter different ticker symbols as with the COMPREHENSIVE file above. With the downloaded data you can graph stock price history and do different kinds of statistical analysis including computing autocorrelation adjustments. Some of the files were built before Google limited access to data and will not work until Google hopefully allows you to get the data again. Other files use finance.yahoo to read prices for different stocks. Finance.yahoo.com has adjusted stock prices that are somewhat better to work with Google because of the re-investment of dividends and adjustments for stock splits. In the file named “Read Google from List” you can go to google and read indicies such as the S&P 500 or FTSE and/or stock prices that do not have an option to download to a spreadsheet. This technique may be useful when there are many pages of data that you want to stick into a file.
`Read Stocks from Google and FRED.xlsmRetreive Stock Prices Oil Oct 2015.xlsmRead Saudi Stocks.xlsm1. Retreive Stock Prices All Aug 2017.xlsmRead Google from List.xlsm
Downloading and Comparing Stock Indicies in Different Countries
The file below uses the FRED (Federal Reserve Economic Database) to put together a lot of stock indicies including stock indicies from different countries. You used to be able to get many of the indicies downloaded by going to finance.yahoo.com, but sadly this has been eliminated by yahoo. The indicies much be adjusted for local currencies. This allows trends, volatility and beta to computed on a comparable basis. It also uses a list box with multiple entries to reads data for different countries. The file includes many variables and countries allowing you to compare GDP per capita and other variables with things like population age. The file uses a list box function with a macro so you can compare different items.
Link to My Youtube Channel Where You Can Look At All of the Different Videos that I have Made1a. Stock Price World Indicies.xlsm
.
import pandas as pd  # check out from library - this is for reading in the ticker and the data frame
import xlsxwriter as writer # this is for writing out to the excel
import yfinance as yf # his is for getting data
import os  # I needed this for the output; without it I could not write

# Begin with a few flag variables
# Allow pathname to be input or to be current path name

# use_current_path = 1   # 1 is defined path and 0 is path of current file
# index_or_stocks = 1

current_directory = os.getcwd()
defined_directory = current_directory

print(" In the program; first defining path and files ")

use_current_path = 0

#use_current_path = input("\n Flag for Using Inputting Path; 0 - Use the Current Path; 1 - Input Path ..... ")
#use_current_path = int(use_current_path)

if use_current_path == 1:
   input_path = input("\n Enter the path name -- e.g. C:\\sandbox ...... ")

if use_current_path == 1:
   bookName = "C:\\sandbox\\Stock and Economic Analysis.xlsm"   # This is the template input file you should have two slashes
   pathName = r"C:\\sandbox\\"  # need two slashes for creating a path in python
   bookName = input_path + "\\Stock and Economic Analysis.xlsm"   # This is the template input file you should have two slashes
   pathName = input_path   # need two slashes for creating a path in python

if use_current_path == 0:
   bookName = current_directory+"\\Stock and Economic Analysis.xlsm"   # This is the template input file you should have two slashes
   pathName = current_directory  # need two slashes for creating a path in python

sheetName = "Read Stocks"   # define the sheet name for below

# Now work with the input file which will get the number of tickers, the tickers

# now read the template file and find the sheet name
# define which sheet name to use to get the tickers
# puts everyting into a data frame
# First Read the debug code for pausing

workbook_data = pd.read_excel(bookName,header=None,sheet_name=sheetName)   # data frame (like multi-dimensional array, for data in sheet)

row_number = 15   # This is row 15; will subtract 1 because python starts at zero
col_number = 6  # this is for column B
debug_code = workbook_data.iloc[row_number - 1,col_number-1]   # This should be and can be a range name

print(" The current Path is " + current_directory)
if debug_code == 1: input (" Pause ... ")

# now read flag for stocks or indicies from row number 13

workbook_data = pd.read_excel(bookName,header=None,sheet_name=sheetName)   # data frame (like multi-dimensional array, for data in sheet)

row_number = 12   # This is row 12; will subtract 1 because python starts at zero
col_number = 6  # this is for column B
index_or_stocks = workbook_data.iloc[row_number - 1,col_number-1]   # This should be and can be a range name

index_or_stocks = int(index_or_stocks)

print ("\n The File and Sheet Name for Inputs with Defintion of Flag .... \n " + bookName + " with sheet " + sheetName)
print(" Flag for Selecting the Index Page or Stocks Page .....  " + str(index_or_stocks) + "\n 0 is Index; 1 is Stocks ")
# if debug_code == 1: input(" Pause .................")

# os._exit(0)   # This is how you can put an optional exit in your program with the os library installed

# now switch to a different sheet to read the rows and columns must be the same in both sheets

if index_or_stocks == 0:
   sheetName = "Yahoo Index"   # define the sheet name for below
else:
   sheetName = "Yahoo Stocks"   # define the sheet name for below   sheet_name =

print(" Flag for Selecting the Index Page or Stocks Page .....  " + str(index_or_stocks) + " " + sheetName)
if debug_code == 1: input(" Pause .................")

# now get the sheet name code
# Read in the total rows from the spreadsheet in row 6 and column D -- D6

workbook_data = pd.read_excel(bookName,header=None,sheet_name=sheetName)

# now sue the sheet name and get information on the tickers
# Read in the total rows from the spreadsheet in row 6 and column D -- D6

row_number = 6   # will subtract 1 because python starts at zero
col_number = 4   # this is for column D

total_rows = workbook_data.iloc[row_number - 1,col_number-1]   # This should be and can be a range name

# print ("\n The Sheet Name for Inputting Tickers " + sheetName + "\n Has Total Tickers of: " + str(total_rows))
# if debug_code == 1: input(" Press any key to continue ... ") # This is for testing

row_number = 4   # will subtract 1 because python starts at zero
col_number = 4   # this is for column D

time_period = workbook_data.iloc[row_number - 1,col_number-1]   # This should be and can be a range name

print ("\n The Time Period Code in Sheet Name -- " + sheetName + " is the Period Code " + time_period + "\n")
# if debug_code == 1: input(" Press any key to continue ... ") # This is for testing

# This is the output file that goes into the sandbox directory
workbookName = 'stock_output.xlsx'  # If you use xls it does not work. This file name is called in the VBA Code

# Now with the input file and the input parameters defined, define the output file
# For the output file, you must not have the file open when running this program
# The ouput file has separate sheets for each ticker in a time series format with the name of each sheet being the ticker

# end_date = datetime.today()   # I don't use this but if you want to download specific datae you could
output_file = os.path.join(pathName, workbookName)  # Use this to put together the output file

print ("\n The Output File with Tickers in Seperate Sheets " + "\n (a temporary file that should not be open at this point): " + output_file)

# This next part puts the some output for the file name in the first sheet

data = {'col0': ['Output File'],'col1': [output_file],'col2' : [str(total_rows)]}
df = pd.DataFrame(data)
# print (df)  # please note that you subtract 1 from the row and the column
if debug_code == 1: input(" This was Data Press any key to continue ... ") # This is for testing

#df.to_excel(output_file,index=False)

# How in the hell did you know that you are supposed to indent in a loop

start_row = 10  # This is the start of the list - Implies that you should not Insert Lines
col_number = 4   # this is for column D

# index = true puts in the dates in the first column
# You can use 1mo, 1wk, 1d or minutes in the download below
# You must make sure that the output file is NOT open in excel

rows_in_loop = total_rows - 0

for i in range(rows_in_loop):
   row_count = start_row + i
   print ("\n In Loop -- Reading for Ticker Number " + str(row_count))
   tickerName = workbook_data.iloc[row_count - 1,col_number-1]   # This should be and can be a range name
   print ("\n Getting Data for the Ticker -- " + str(tickerName))
   df_yahoo = yf.download(tickerName,period="max",auto_adjust=False,interval=time_period)   # Need to first get the data
   df_yahoo.xs(tickerName,axis=1,level='Ticker')  # This puts the data on one line
   adj_close_df = pd.DataFrame()
   adj_close_df = df_yahoo['Adj Close']
   print (adj_close_df)  # prints some of the data for each stock
   with pd.ExcelWriter(output_file, mode='a', engine='openpyxl', if_sheet_exists='overlay') as writer:
    adj_close_df.to_excel(writer, sheet_name=tickerName)   # This must be indented