This page includes a couple of case studies on creating a solar project finance model, about the simplest model structure you can imagine. I have put together a file with titles that illustrate how you can start from the fundamental operations and end up with investor returns and credit risk measures. I have also put some other simple solar models on this page. My hope is that this exercise will not take too long. I have also included a case write-up that is used in testing people. Below the simple solar project model I have put in a more complex case for a thermal construction project.
A-Z Exercise with Selected Existing Titles for Solar Model
I was asked to prepare an exercise where people could quickly make a model that evaluates bid prices and other model aspects and can get you most of the result without spending too much time on some of the horrible details that can make project finance modelling so difficult. I was told that making a relatively simple project finance model could not be taught in a single day. This is not true. You can see the essentials of making a model including describing inputs, establishing operating cash flow, computing depreciation and project IRR, incorporating debt, making a cash flow waterfall and computing some key financial ratios in a morning.
The file available for download does this for a simple solar case. To make it really simple I have not even included a construction period and made the model and annual model. For some items I have not included titles so that you can do the really important part of a model which is to structure the model. For other parts, I have included titles so that you do not have to waste a lot of time typing. The exercise hopefully applies some of the fast modelling religion, meaning that it is flexible (except for the one period construction), it is accurate — the balance sheet balances and the debt is paid off; it is structured, where you start with physical operations and then move to revenues, expenses and capital expenditures and then to depreciation which allows you to compute operating taxes and project cash flow. After project cash flow you incorporate debt with a sources and uses of funds statement, and a debt schedule. Only after the debt schedule do you create the financial statements. To download the file, press on the button below.
Part 1: Timing
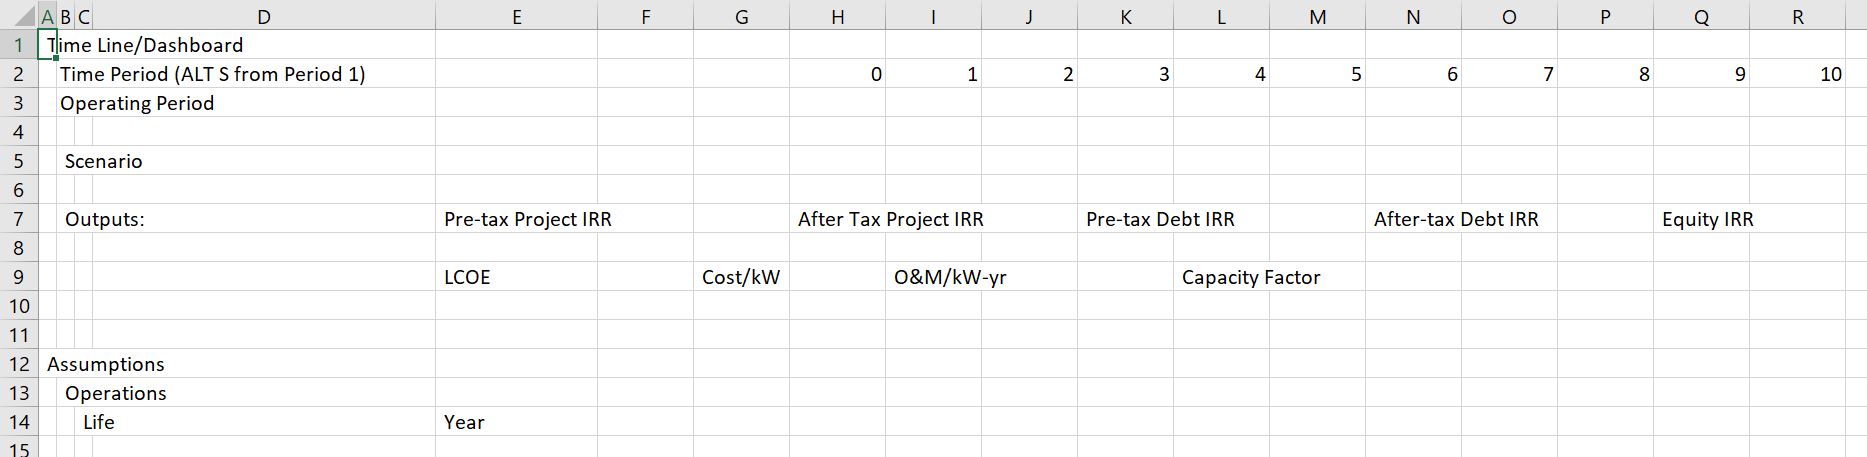
In the second part make a timing switch and use the EDATE function (FETCHA.MOIS) to compute the annual dates. I have put some summary outputs at the top of the page. Use the ALT and –> to group the rows and choose to not show the outputs. In English you can use ALT, E, I, S to get the model started for 40 years. With the GENERIC MACROS open, you can use the ALT, S combination. The timing parts of the model are shown on the screenshot below (note that the latest version of the model has some different line items — I moved some of the stuff to the summary page.)
Part 2: Define Inputs
In the first part, you go to the operating data. You use the INDEX function so you can select one of the scenarios. Also put the developer tab in your excel and make a spinner box with the windscreen wiper method to use the form in other sheets.
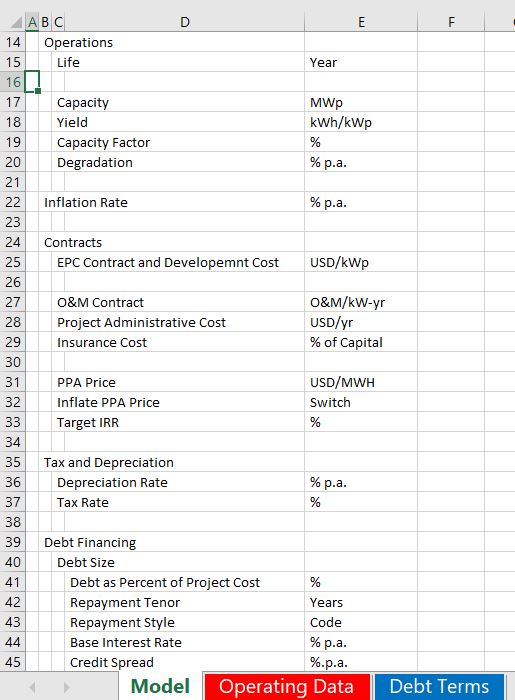
After setting up the time line, pull the relevant inputs from the model from the operating page and from the debt page. The inputs should be discussed and you should see how to change the scenarios with your spinner box. You should understand that the inputs are arranged in a proper order that separates operation from financing; that begins with physical operations; that includes ways to back into the contract price and that includes logical differentiation of the debt parts of the model. When you have linked the outputs, use the CNTL, ALT, C sequence from the GENERIC MACROS to show the location of the inputs and to illustrate the structure of the model. The input section is shown on the screenshot below.
Part 3: Construct the Operations Section of the Model
In the first part of the model I have not provided the titles. You are supposed to get to the volumes produced in MWH which is the basis for revenues. To do this you need to know how much the solar capacity factor or yield will be. I suggest you enter the driver of the formula in a left hand column, that you put in the units in a left hand column and that you use SHIFT, CNTL, R to quickly copy things to the right. You should also compute an index for degradation that begins in year 1 by taking the prior period and multiplying it by (1+degradation). Then you can divide the capacity by degradation and compute the capacity after degradation. You can use whatever method you want to insert the rows. You can create your own short-cut key for the underline.

Part 4: Revenues, Expenses, Capital Expenditures and Free Cash Flow
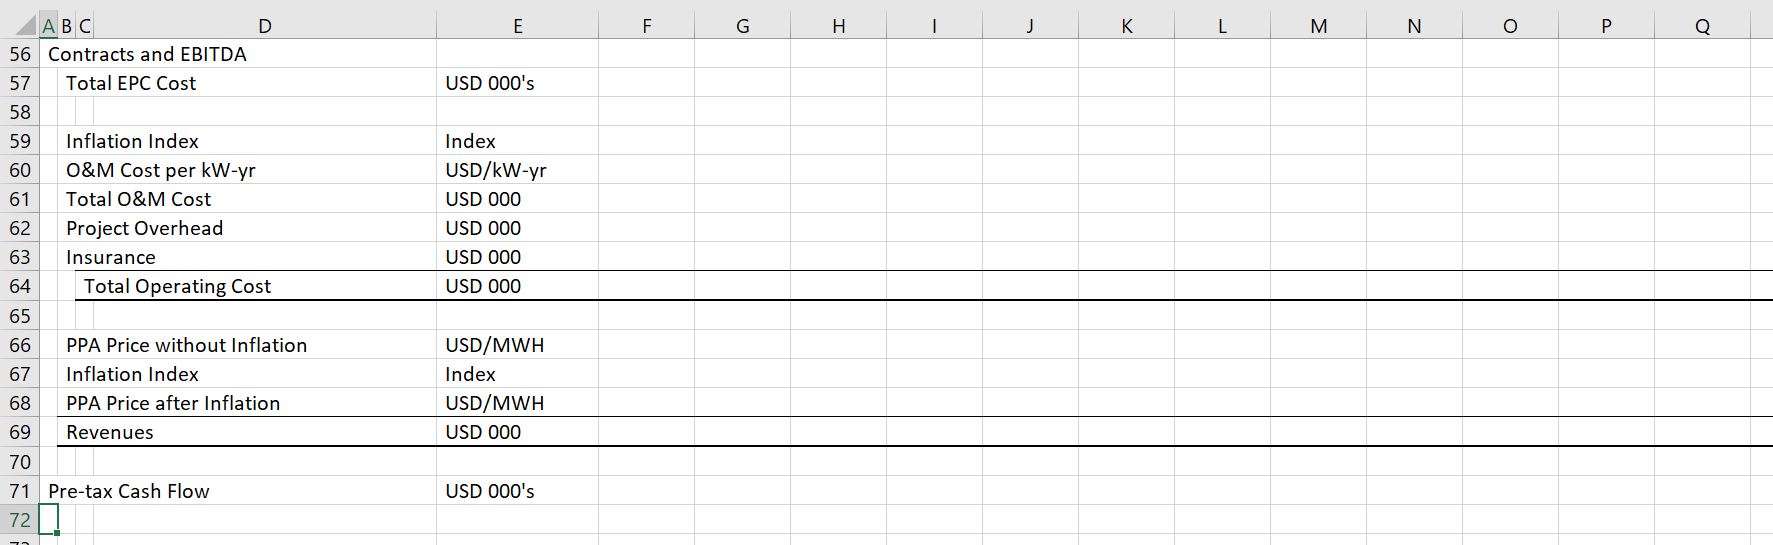
In any corporate finance model, M&A model, real estate model or project finance model, you will need revenues, expenses and capital expenditures. The assumptions that create these three items (along with working capital) will drive all of the rest of the analysis. In the next section you are to compute revenues, expenses and capital expenditures from the inputs. I think it is a really good idea to put the drivers of each formula in a left hand column so you can be transparent (I hate looking around for where the numbers came from). In this part of the analysis I have given you the titles as shown on the screenshot below. Once you have computed the project IRR you can use a goal seek and a macro to evaluate the required price.
Part 5: Depreciation, Operating Taxes and After Tax Free Cash Flow
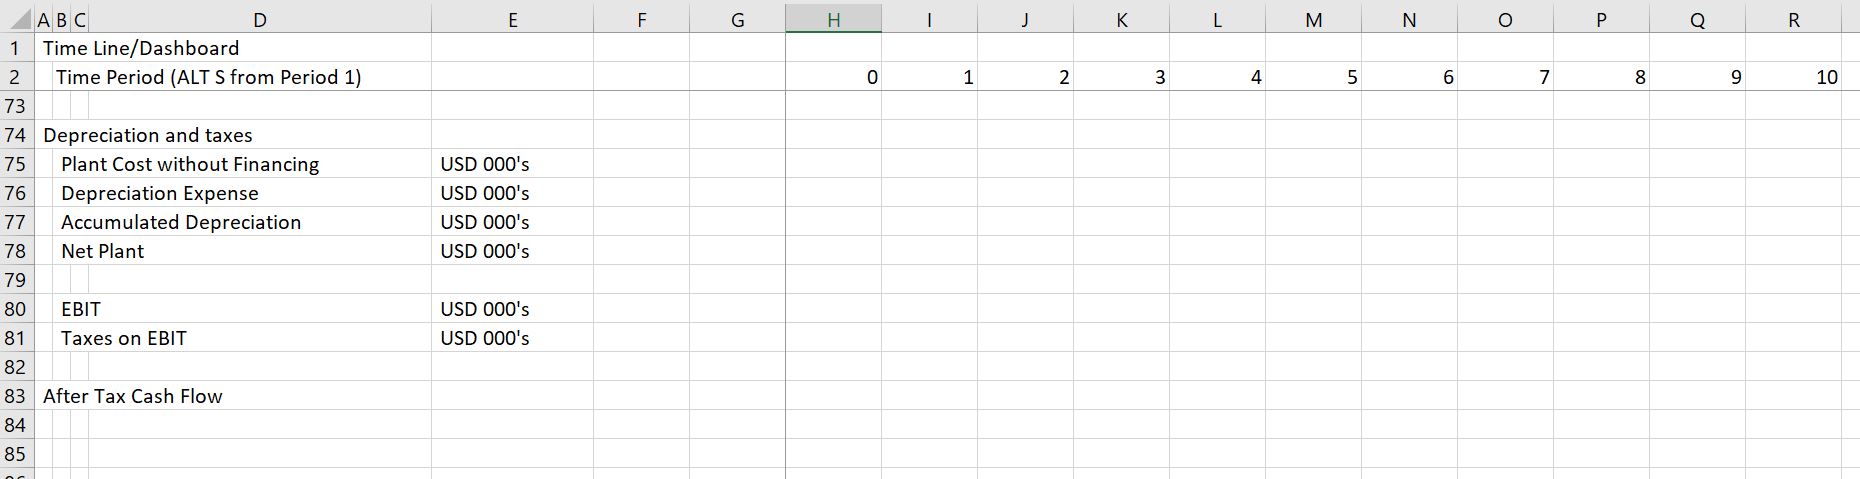
If there were no taxes and you did not want to show a profit and loss statement you could eliminate this part of the model. With taxes, the shield from depreciation is an important item. Compute the depreciation by setting up an account with the balance of plant as shown below. When you compute depreciation you can use the MIN function to make sure the depreciation does not exceed the net plant balance. Once you have the depreciation you can compute the EBIT, the taxes on EBIT, the after tax project cash flow and the project IRR. The screenshot below illustrates this part of the model.
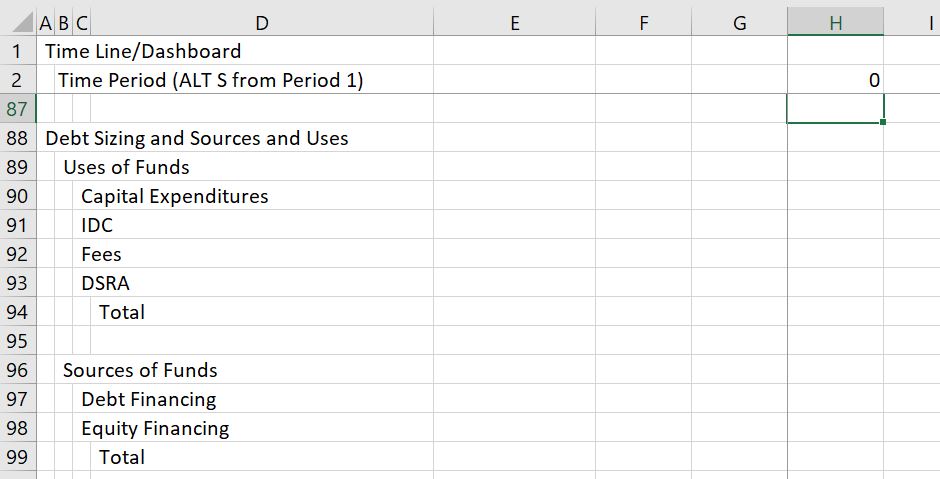
Part 6: Sources and Uses Prior to COD
Once you have completed the operating cash flow and operating taxes you can move to incorporating debt in the model. In every project finance model there should be a sources and uses of funds for evaluating cash flows during the construction period. You can think of this as a way to evaluate debt sizing. In the example, you can fill in items on the sources and uses of funds from the inputs and items above the sources and uses. Note that this is not realistic as items such as interest during construction and fees come from below not above and you get a circular reference.
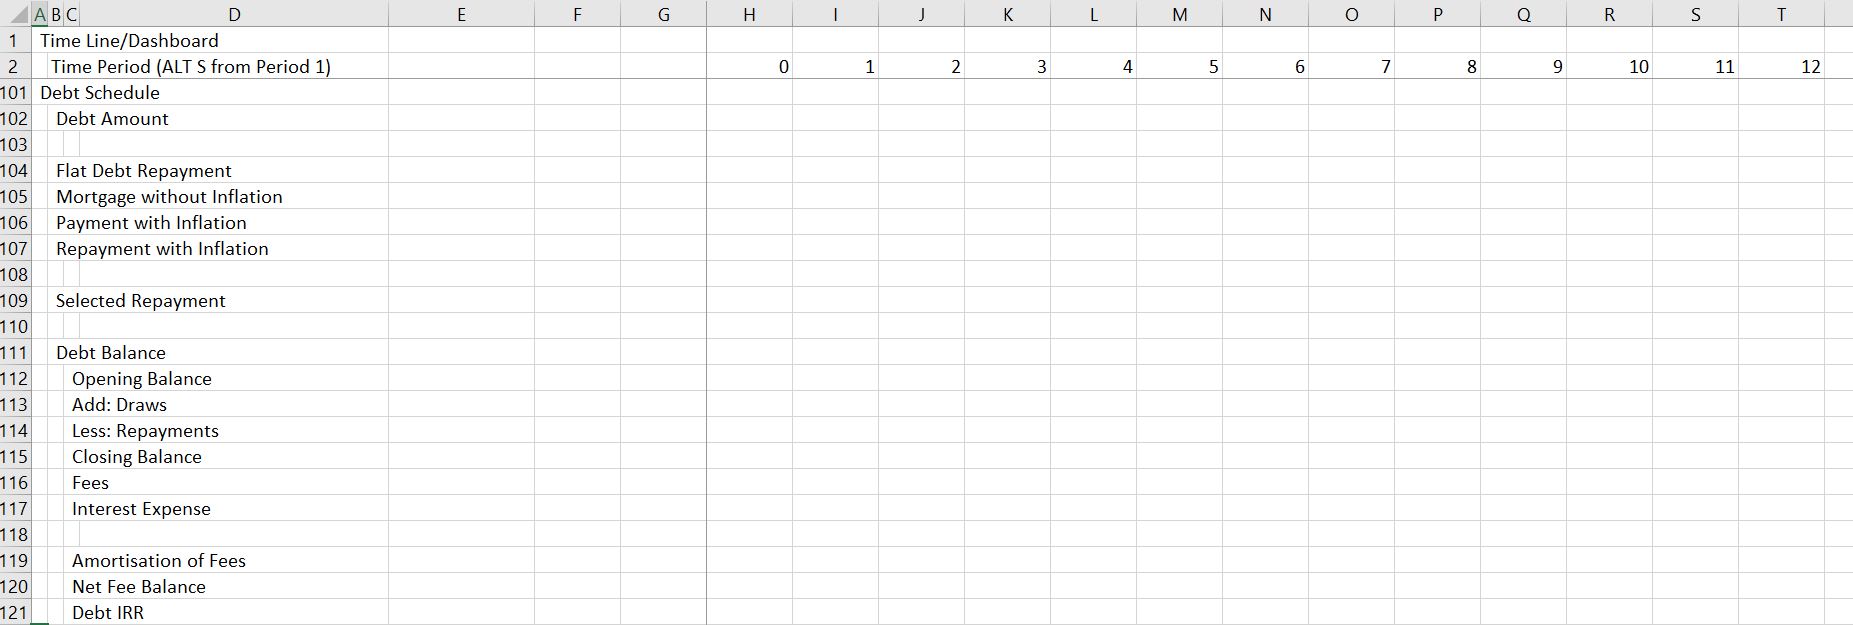
Part 7: Debt Schedule
The debt schedule must have calculations for debt repayment, interest expenses and fees. Repayment is often the most difficult aspect of a model. There are alternative methods demonstrated to compute the repayment including flat repayment, mortgage repayment and inflated repayment that matches the cash flow when inflation is applied in the price. Use the INDEX Function to select one of the three methods of repayment. A screenshot is shown below.
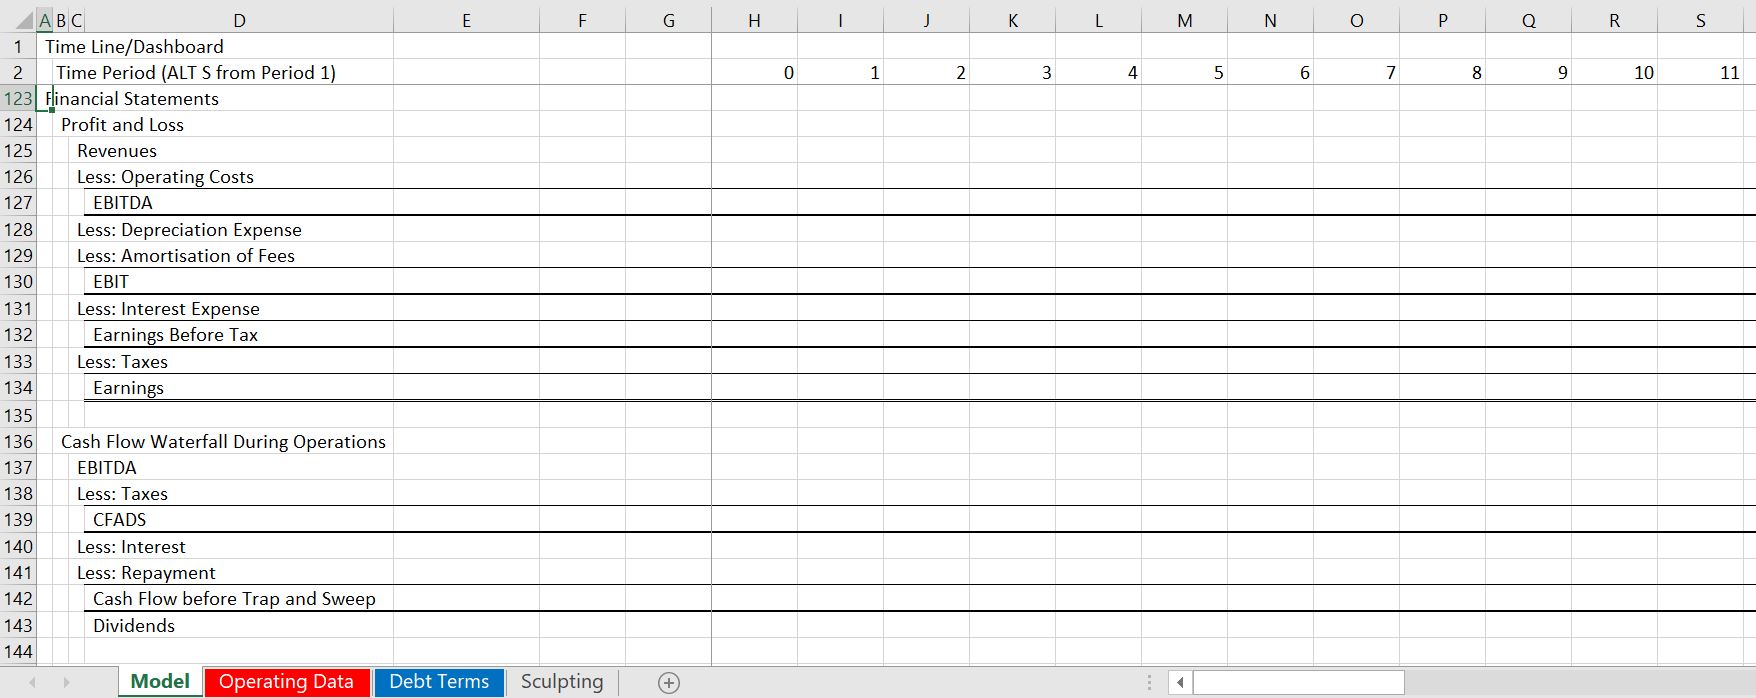
Part 8: Profit and Loss Statement and Cash Flow Statement
Now you are to the easy part. The only reason that an income statement is necessary in a project finance model is to compute taxes and to compute net income for purposes of balancing the balance sheet. The cash flow statement can be more complex if there are cash sweeps, covenants and other items.
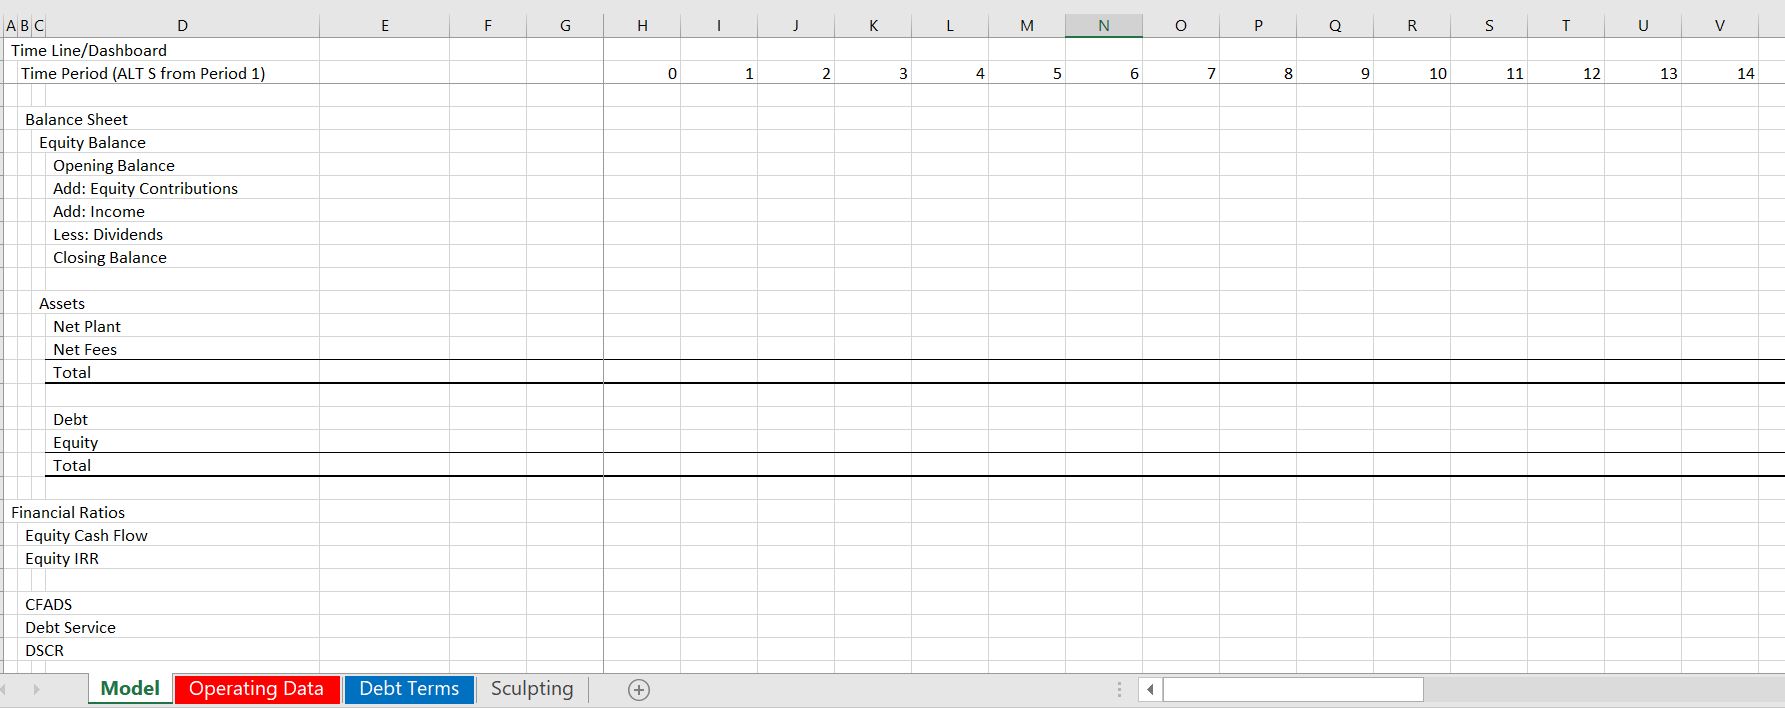
Part 9: Balance Sheet and Financial Ratios
The final part of the exercise is to put together a balance sheet and compute a couple of financial ratios. The balance sheet components should all come from items in the model and the equity balance should be computed. Ratios like IRR, DSCR and LLCR come from the cash flow statement.
Exercise that Includes Construction Period
I was asked to prepare an exercise where people could quickly make a model that evaluates bid prices and other model aspects and can get you most of the result without spending too much time on some of the horrible details that can make project finance modelling so difficult. I was told that making a relatively simple project finance model could not be taught in a single day. This is not true. You can see
Excel File with Exercise for Creating Combined Cycle Model with Timing and Construction Issues
Case Study Exercise on How You Can Evaluate and Existing Model
Some unlucky people have to create models and deal with circular references and many horrible details like withholding taxes on four tranches of debt. More people have to interpret and use models that is arguably even more disagreeable because of the way models have become cumbersome and overly detailed.
This case study and exercise is designed so that you can more efficiently evaluate models created by other people including dissecting cash flow in the models, computing alternative financial ratios, adding your own scenario analysis, dissecting the model with sensitivity analysis, creating an summary page the conveys the transaction, making effective graphs the illustrate risks and finally formatting the model with nice colours and titles. My hope is that this exercise will be practical for you and that you can use some of the ideas in your current job immediately.
The file that I have used for this case is the completed case from the above model. But it could be just about any project finance model, corporate model, M&A model or other financial analysis that has a few inputs and outputs. The base model that I have chosen for this exercise is available for download by clicking on the button below.
Introduction to the Model Review Assignment
I have structured this assignment by attempting to explain the details of how to complete the excel stuff. Then I have included questions that should be completed with only one or two sentences where you tell me the implications of the modelling tasks. I have also provided titles for many of the items so that you do not have to waste a lot of time typing stuff and the exercise will not take too much time. I strongly suggest that you do not do this exercise on an Apple computer; that you open and use the GENERIC MACRO file, the LOOKUP INTERPOLATE file and the SCENARIO REPORTER file to make the case go faster. These three files are available for download below.
Part 1: Dissecting Cash flow
Use the SUMIF function to get the data to annual amounts. When you use the SUMIF, click on the entire row. Question – how does the IRR on the project and equity compare to overall stock market returns. Do you think this is realistic.
Part 2: Computing Alternative Financial Ratios
I hope that you learn to look at ratios other than the DSCR. In this case you can examine the LLCR and the PLCR. The only calculation you have to make for this is to use the SUMPRODUCT function below the cash flow statement with the interest rate index and to find the debt at COD from the sources and uses. Explain how to interpret the DSCR, LLCR and PLCR.
Part 3: Adding your Own Scenario Analysis
Use the scenario manager to add a scenario. In this case could you invent a few cases with different inputs. To do this, you should first copy the scenario reporter from the scenario reporter file to the file used for the analysis. Then, you can add different scenarios with the following: the project cost, the life of the plant, the availability. Then open the scenario reporter and create a scenario report.
Part 4: Dissecting the Model with Sensitivity Analysis
I have provided a scenario analysis with a base case, a downside case and an upside case. I have also used the INDEX function to link the cases to the model inputs. Thirdly, I have used the TRANSPOSE function to isolate different variables so that you can compute the effect on the DSCR, LLCR and different IRR’s. In this task you are to finish the sensitivity analysis and create a tornado diagram. To finish the data table, you should select the area of the data table as illustrates on the screenshot below.
Part 5: Making Effective Graphs that Illustrate Cash Flow and Risks
In this part of the assignment I would like you to create a flexible graph that you can use to look at different cash flows and combinations of cash flow. Use the INDEX Function to make select different cash flows.
Part 6: Creating an Summary Page the Conveys Key Aspects of the Transaction
In this part of the assignment I would like you to create a summary page that can be used to illustrate the risks and the structure of the project finance transaction. Unlike other parts of the assignment I have left this one open ended.
Part 7: Formatting the Model with Nice Colours and Titles
Review Concepts
In this final section I have included a couple of ideas that I think are important in financial modelling for finance analysis. I have listed a couple of bullet points and some ways that you may think about the issues. I have also included references to my set of power point slides that describe project finance theory.
- Essence of Project Finance Model versus Corporate Finance Model, see slides 36 to 43 in the presentation below.
- The philosophy of FAST. The philosophy of FAST is discusses on slides 8-23 in the slides below.
- Structure of Models. Explanation of the structure of a project finance model is in slides 68 to 72
- Scenario Analysis. Explanation of scenario analysis can be found on a few slides in the file below: Slides 73 to 78
Power point slides where you can find discussion of these items is included in the file that you can download below.
Power Point Slides that Accompany Project Finance Modelling A-Z Analysis and On-line Course
Example of Actual Model for Solar Project Demonstrating Complexity and Size of Real Models