This article describes the relationship between wind power production and merchant prices. In many if not most wind power projects there is some merchant power risk and a requirement to evaluate merchant power prices. In some cases, virtual PPA contracts are used where a quantity of power is locked in with a buyer and a seller. The case study of Denmark is used on this page to demonstrate how increased wind power production can affect merchant prices. In addition, a simple LCOE analysis of wind is presented to emphasize that you should be careful not to accept consultant forecasts of merchant power prices that are completely inconsistent with the ability to produce wind at relatively low production costs.
Files that you can download for this webpage are presented below. The first file is an analysis of merchant prices and wind power in Denmark. The second file is a file the evaluates the levelised cost of wind using alternative cost and capacity factor assumptions.
Case Study of Denmark with Merchant Prices and Wind Production Data
To introduce why the case of Denmark is interesting to study, the map below illustrates that Denmark has a lot more wind power than other areas. The second reason for studying Denmark is that it is part of the Nordpool system which has very transparent data including hour by hour wind production.

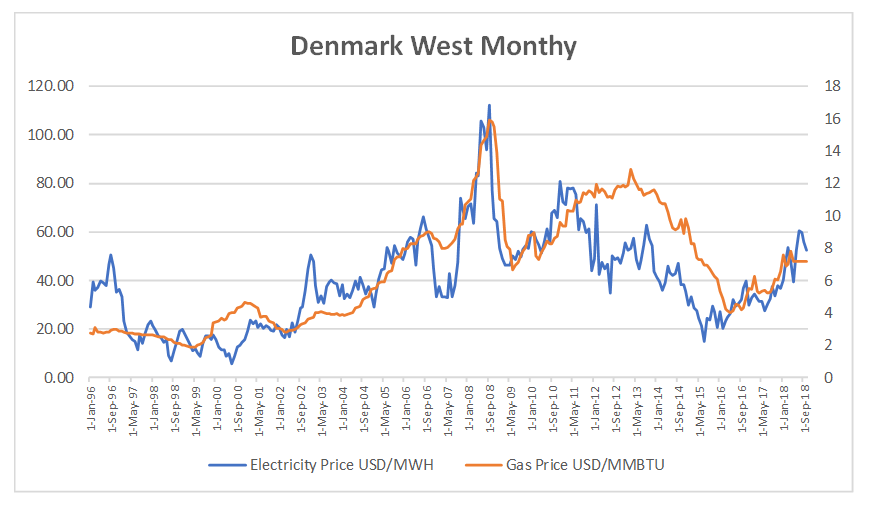
Before evaluating the relationship between wind production and electricity prices, I review the trends in the levels of electricity prices. The screenshot below shows month by month electricity prices in Denmark along with natural gas prices. The graphs shows a clear correlation between electricity prices and natural gas prices (almost the same correlation as exists for German prices). After 2011, the prices of electricity fell relative to natural gas prices (probably because of low demand growth and renewable energy increases). The high correlation between natural gas prices and electricity prices suggests that electricity prices should be evaluated in the context of gas prices.
Levelised Cost of Energy from Wind and Merchant Prices
Computing the real LCOE is a way to test the merchant price assumptions. If the merchant price assumptions are above the real LCOE, you should ask a basic question. If You can find hundreds if not thousands of studies of LCOE and feed-in tariffs for wind and solar power. Referring to these studies is largely a waste of time. Instead you should make your own calculation. All you need is the cost of the project, O&M cost, capacity factor and, most importantly, carrying charge rates. A couple of references for the cost data are presented in the screenshots below. Please go to the menu on LCOE and carrying charges to see how to incorporate the carrying charge rates.
On the screenshots below note the difference in O&M cost. The equivalent O&M cost per kW-year is about $ 56/kW-year. This is above the entire range of USD 30-40 per kW-year in the Lazard study.


The screenshot demonstrates the LCOE using different assumptions. In the middle of the page I show a couple of scenarios for on-shore wind farms. The first scenario with relatively low O&M and capital costs along with a 34% capacity factor illustrates that you can obtain a LCOE of USD 36/MWH. In the high case with higher costs and a lower capacity factor and a higher carrying charge rate, the LCOE increases to USD 68/MWH. It is these costs that you can use to question assumptions with respect to merchant prices. Again, if you believe that it is possible to construct a wind farm for an LCOE of USD 36/MWH, assuming the overall price faced by a wind farm is above the USD 36/MWH is not logically consistent. If the merchant price is something like USD 50/MWH, then one way or another a lot of wind capacity will be built (either directly merchant or through bidding). With the increased supply, the price will fall.

With wind farms I go a bit crazy with O&M costs. O&M costs are a lot higher for wind than for solar. Perhaps people over-pay wind turbine suppliers because these suppliers are in a very strong position. On the screenshots below I illustrate actual examples where the total cost (not only the cost of the turbine supplier) is around USD 100 per kW-year.

Virtual PPA