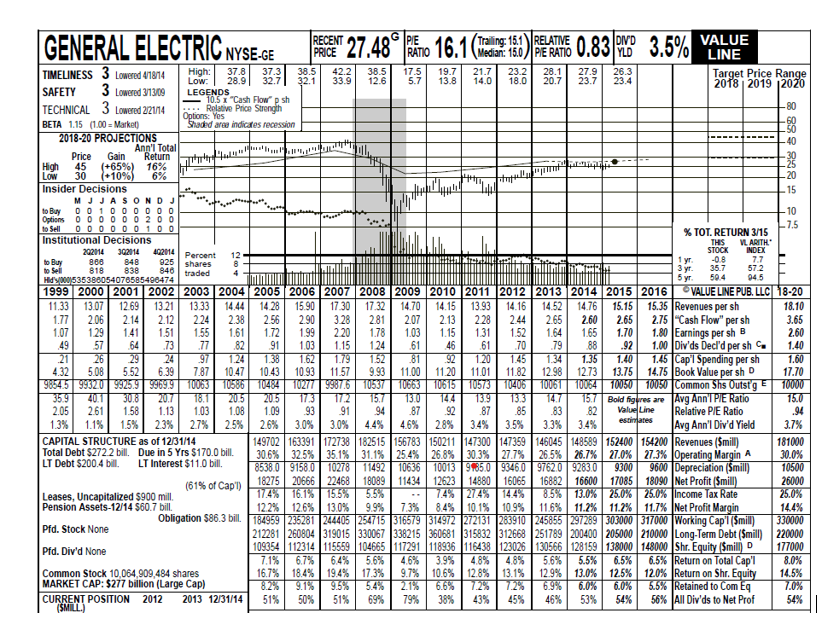
I used to think this page was one of the most important on the website. I wanted to do something like you can do with Bloomberg where you can get a nice summary (I have never been able to afford Bloomberg). I wanted to make something like a Value Line page shown below where you can find a summary of financial statistics and use this to evaluate a forecast. The Value Line page was very nice how all of the data is on one page. On this page you can see how the P/E ratio is used to make a valuation from projected earnings per share; how analysts compute a return on investment (an IRR) by comparing the current stock price with the projected stock price. You could find the projected ROE on the page, multiply it by the book value of equity per share to get the projected EPS. Then you could multiply the EPS by a reasonable PE ratio to get a projected price. This is shown in the top left where the High and Low price is shown.
A really nice thing is how much history you could peruse very quickly (by the way, the actual price of GE was dramatically below the projected price). Using the discussion above, this means that you could look at the historic ROE, the historic P/E ratio and other factors that drive the earnings. This page explains how you can get a similar report with long-term data from yahoo finance. I have worked on this for many years and I think nobody uses it, but I will keep going.
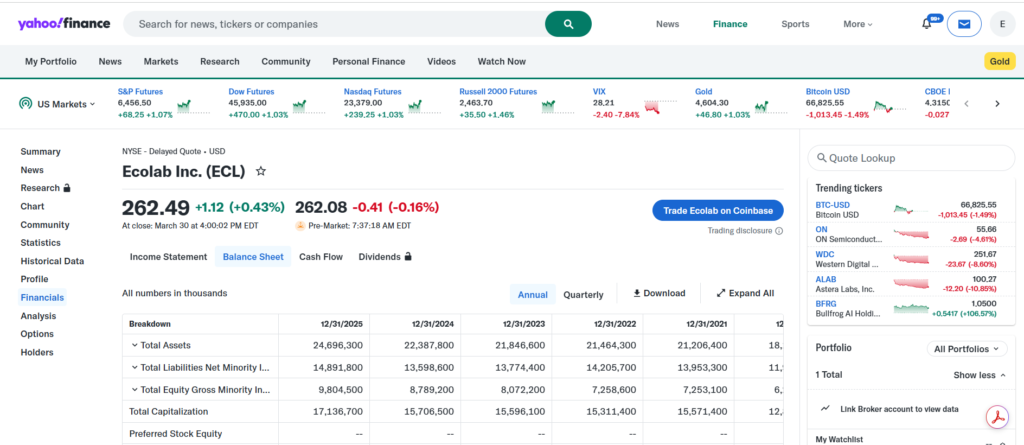
I am generally late to use the most current tools, but when I first saw the data presented on finance.yahoo a long time ago, I was stunned. You could find the stock price adjusted for dividends, much of the financial data shown on the Value Line page (with not as much history). I began to try to automatically scrape data from finance.yahoo and I was surprised that this was pretty easy. I was able to use some of the finance.yahoo data in my cost of capital testimony and to explain relationships in my courses. Eventually the finance.yahoo website became more difficult to use. Suddenly, because of the API (application program interface), you could no longer download the stock prices automatically. I found that you could get better history on the financial statements, but you had to buy a subscription (which I did as shown below). Can you see the gold button at the top left. This proves that I am not lying about paying a few hundred dollars to yahoo finance. In the meantime yahoo finance also became better in terms of the coverage of stocks around the world. Now you could get data for just about any stock including a lot of history, financial statemets and market indicies.
.
.
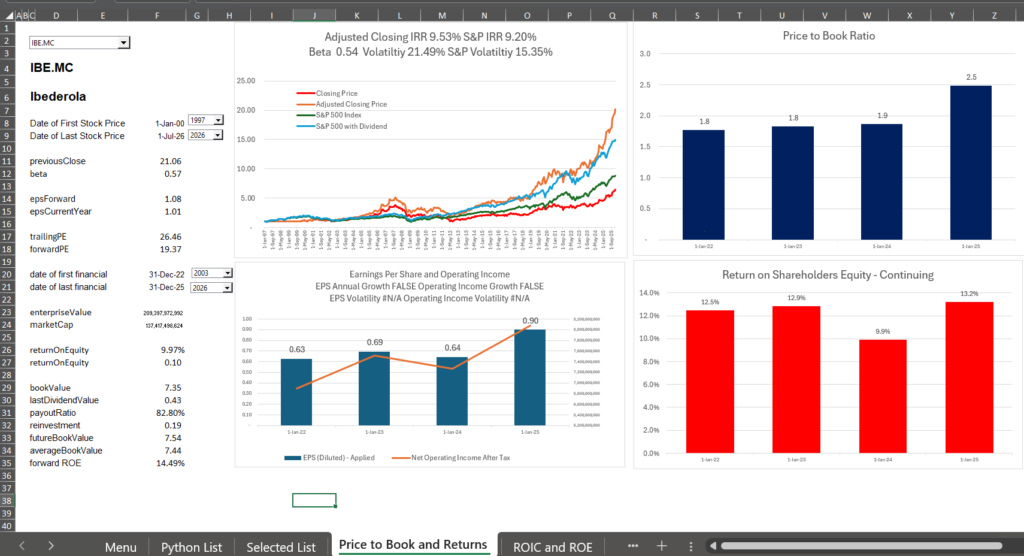
The next thing in the history of acquiring financial data is the availability of something called a library with a lot of functions in the computer language called python. It is a bit painful to learn another language, but a library of functions developed by somebody smart named Ran Aroussi. If you can do some painful programming in python to read and write things to excel, you could now make something like the Value Line report for a period of four years. The really cool thing about this is that you can get the data for free. Yfinance meant that I had to re-think my process for getting the data. But it could be done. The screen shot below illustrates the kind of analysis you can get from using python combined with yfinance and some excel. If you want to do this yourself. You do have to have python installed for this and you have to install some python libraries like yfinance. If you are doing this for the first time, it is painful, but you dont have to be a fancy programmer. I have explained how to install python in the menu of this website related to analysis of stock prices.
To match the Value Line presentation, I want to get the long-term data into the presentation. This poses dilemas including the issue of payment and the issue of how to get the data. I have wasted some time on using something called beautiful soup in python but I have not found a way to reasonably get the data into excel without a mannual process. My ultimate solution is to save a bunch of financial statements in a file and then get the data into excel with a method that reads all of the files in a directory (a folder). This method which is more tedious is explained in a separate section below. An illustration of the result of this method is shown in the screenshot below. This is one page out of a few pages. The good thing about this is that you can modify the stuff yourself.
.
Running the Program after Downloading Files and Installing Python
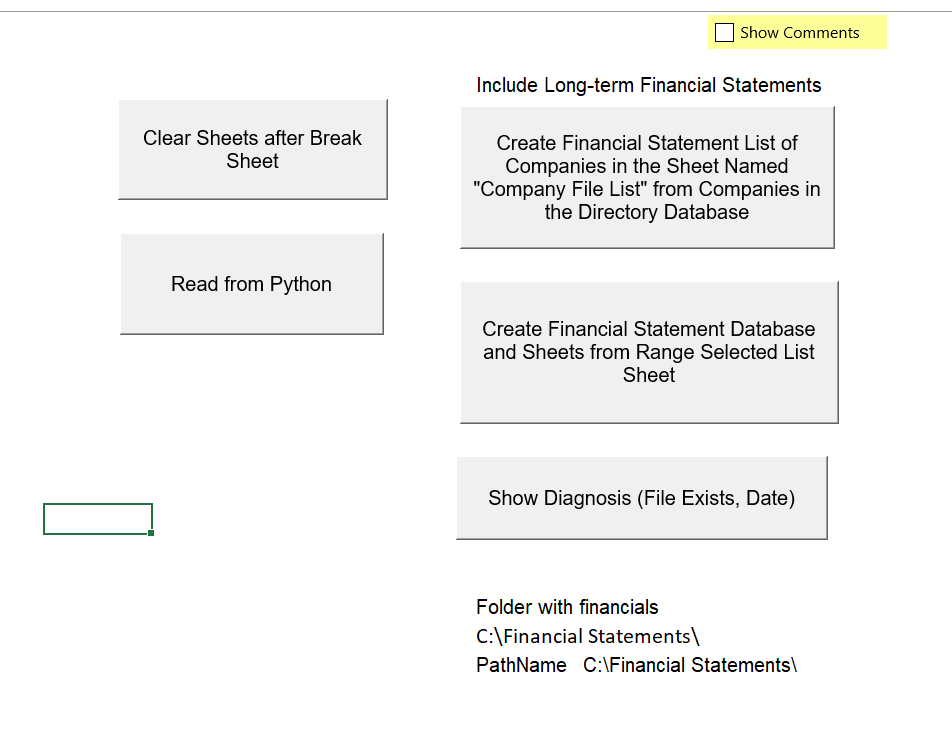
I have tried to explain the step by step process for downloanding the excel files and the python files (you just need two files to run the program). But you have to download both the python compiler and then install a couple of libraries. Once you have these downloaded, you can open the file “integrated financial analysis.xlsm.” When you open the file you will see a couple of buttons attached to VBA macros. A screenshot for running the model is shown below. There are two buttons to extract the stock price data. The button on the left allows you to read data for the last four years without extracting longer term data. The buttons on the right allows you to access a database with long-term financial data. To use this you must download the database. When you are first trying to use the model, I suggest using the button on the left.
.
.
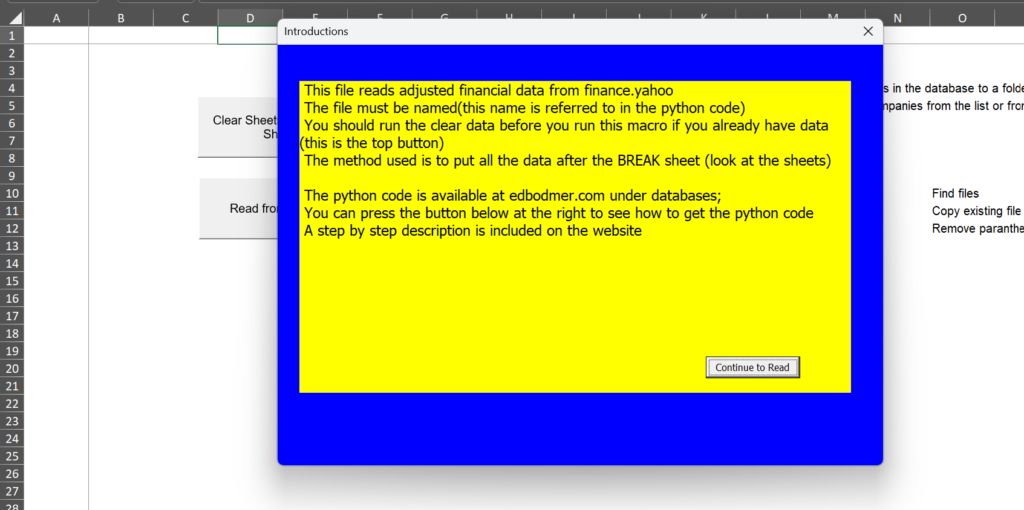
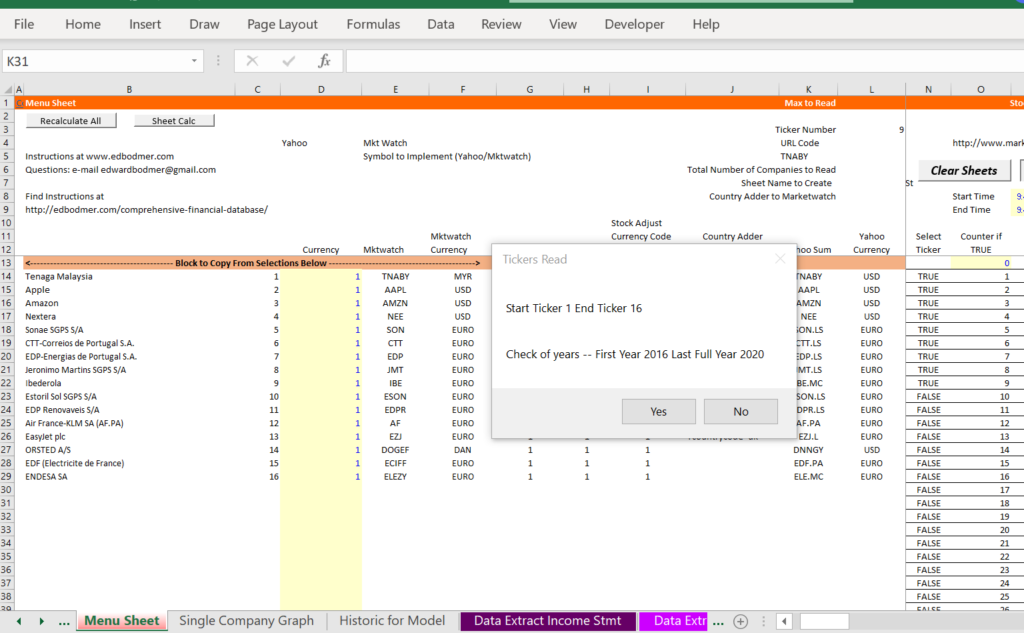
After pressing the first button, the VBA program will show the following screen as instruction to let you know that you are about to move from VBA to python.
.
.
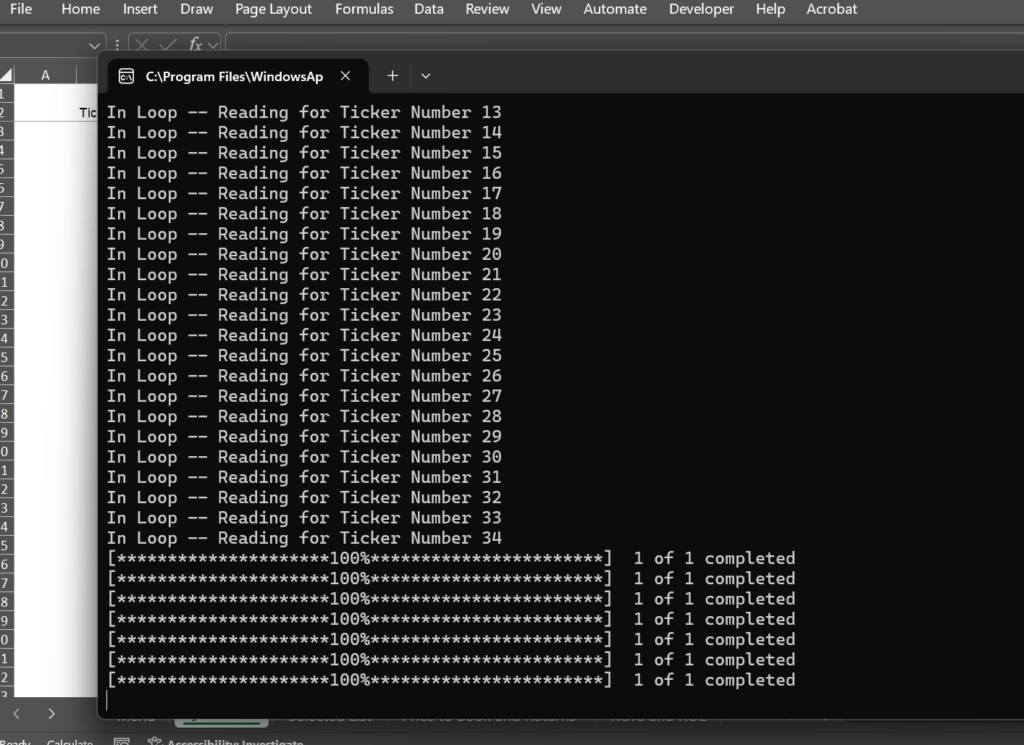
After you press the continue button, you should see a separate black screen which means that python is running and collecting data from yahoo finance. This reads stock prices, financial statements, general ratios and stock indicies so that financial data can be presented. For this, you do not need any special premium payment to yahoo.
.
.
.
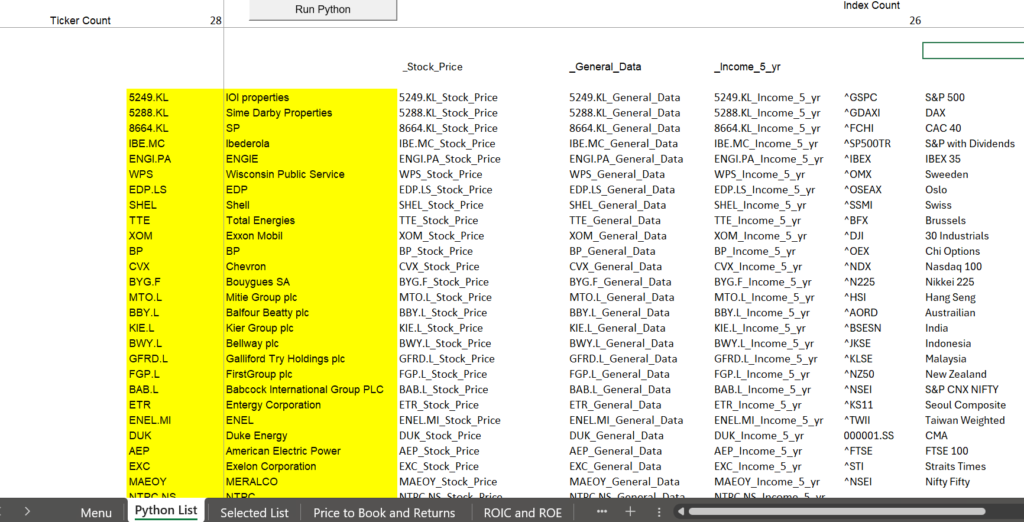
Before running the macros, you should enter the yahoo ticker symbols and the company names. These tickers and company names drive the analysis.
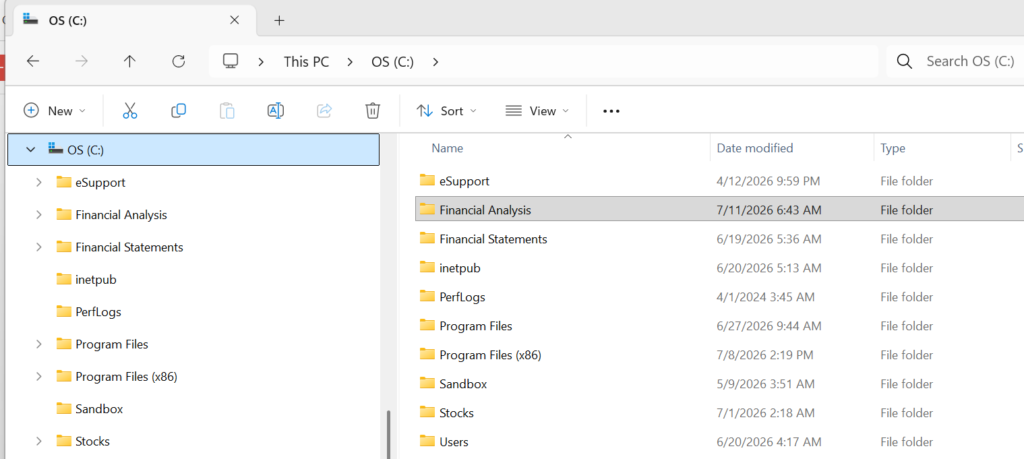
The first step is to create a folder directly in your c: drive. The process does not work well from the onedrive (I admit I dont know exactly why).
.
.
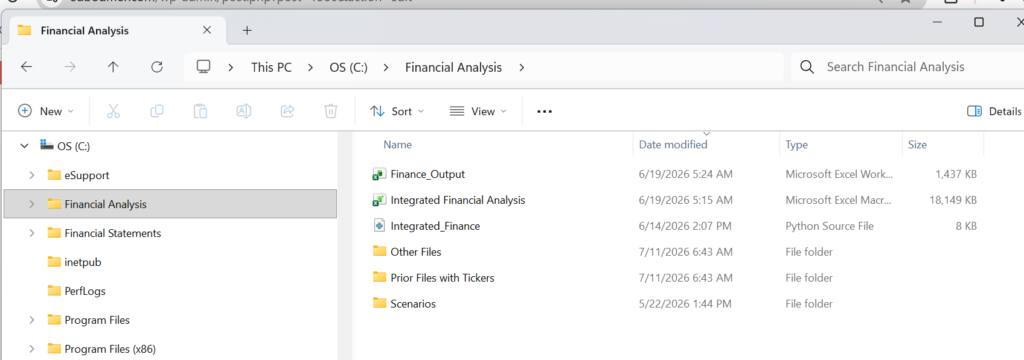
Once you have created the folder, you should have three files in the folder (you could change the python program to allow it to read different files). The three necessary files are shown in the screenshot of the folder below. These files are included in the zipped file attached to the button below.
.
.
Fetching data with Limited History
If you want to get data for a few years and compare this data to the stock price to get a presenation, you can use the library in python called yfinance. If you install python on your computer and then get some libraries (yfinance, pandas, openpyxl) you can download the excel file below. This file can get financial data, stock price data and general data for a long list of companies. The data is put into separate sheets and then I use excel to do make analysis of graphs and other data. By using the INDIRECT function in excel along with XLOOKUP we can scrape a whole bunch of financial data from the internet and create a historic database of Financial Statements, P/E ratios, EV/EBITDA, operating ratios and other multiples for financial statement analysis, valuation, modelling and cost of capital analysis.
To get the analysis, you can click on the blue button below the screens shot and you will get a zipped file with the files that I zipped. This zipped file has the pyton code and the base excel file necessary for the downloading process (the python file named integrated_finance.py and the excel file named Integrated Financial Analaysis are the only files that you really need. You should put the files difectly on your computer (e.g. on the C: Drive) and not on your one drive. You also need to install python as I explain in the stock price download section (I include the video below).
.
.
.
The way the python program works to create the financial analsysis is discussed in the video below.
.
.
.
The financial statements, ratio analysis and cost of capital analysis that you can create from downloading various information contains a lot of detail and can be used as the basis corporate financial models (comprehensive financial statements are included). All you do is enter some ticker symbols, then wait as the download proceeds, and you will get a database with valuation multiples and financial statements. I have spent many years on trying to get this database correct and gone through many different iterations. For analysis with a relatively short period I hope it is in good shape. But I do continually adjust the database.
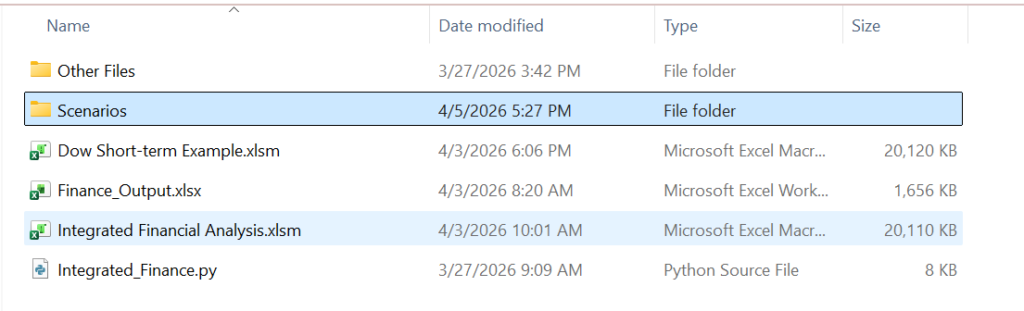
First, I begin the discussion on this page by explaining how to use the database. Later, I discuss methods for adding more history to the database so that you can make your analysis like the Value Line page shown above. Of course the good news is that you do not have to pay a lot of money for all of this. As with downloading the stock price and economic data shown on an associated page (go back to the menu and look for this), you can download a couple of zipped files and it should work (email me at edwardbodmer@gmail.com) if you are having problems. The zipped files are shown in the screenshot below. This method is more tedious, but you can put things together.
.
.
Step 1: Link the companies to evaluate from one of the lists, or make your own list.
.
.

.
.
.
The files should be in a folder that you have downloaded from yahoo finance.
Creating Database with Long-term Data
.

.

.

.
The database is created by download and retrieving data from the internet (Market Watch and Yahoo finance) as well as a couple of data series from FRED for interest rates and for exchange rates. The real advantage of the process explained on this page is that if you were to go to MarketWatch that has very nice historic data it would take you a very long time to re-type the data by hand. You would also have to change the B that is in MarketWatch to billions and M to millions and so forth. Finally, you would not be able to easily compare the financial data to stock prices because MarketWatch has nice financial statement data but no stock prices. With the data downloading procedure you can present historic multiples for at least five historic years along with financial data like ROIC, ROE, Price to Book and other ratios like the growth rate in revenues and EBITDA. You can also evaluate the cost of capital using the horrible CAPM as well as more interesting methods that use a regression analysis of the market to book ratio and the implied P/E ratio. You can also go to the financial statement page and get a big head start on creating financial models. The databases are flexible meaning that you can pick your ticker symbols, press a button, patiently wait for a while and you get a comprehensive financial database. Please note that you may have to sometimes update the database when yahoo changes the URL or when I add some enhancements to the file. You can download the Financial Database with examples and without tickers filled by clicking on the button below. Please not that when yahoo changes the format of its reports the database must have little revisions. You can try this yourself or send me an e-mail at edwardbodmer@gmail.com where you find snags.
Please note that I have worked on this database for 20 years since I first discovered how to scrape data into excel. I used the database originally for my cost of capital testimony. My point is that I continually update the file and if you tried toe file a while ago you may have been pissed at me. I promise that it is getting better and much more easy to use. The current version of the file is attached to the top button below.
General Description of the Financial Database
You maybe saying to yourself what is the big deal; I can get so much data from the internet anyway (or maybe you pay scads of money to Bloomberg). You can indeed get amazing financial data websites like Market Watch for free including historic financial statements and analyst earnings projections. But key information is missing. Take the case of Market Watch. While historic financials are reported, Market Watch does not allow you to download stock prices so you can compute historic P/E ratios etc. Also Market Watch reports 2.5 billion as 2.5B and you need to adjust for the B,M and even T for trillions. Yahoo Finance has a lot of data also, in particular for stock prices. But the financial statement data is not as detailed and, again, the historic ratios for things ranging from ROIC to forward P/E are not available. Further, after may 2017, yahoo data is a pain to download.
The ability to scrape valuation multiples, cost of capital and historic financial data is, I believe, one of the most important items on my website although few of you seem very interested. As shown below, in one of the pages you can set-up your financial forecast; in another one of the pages you can review a whole bunch of ratios for a company to get a background for valuation and forecasting; in other pages you can create valuation analyses from comparative multiples; in yet other pages you can develop cost of capital analysis that is far better than the traditional CAPM B.S.
Using the Database File for Extracting Financial Statements and Creating Historic Analysis for Financial Models
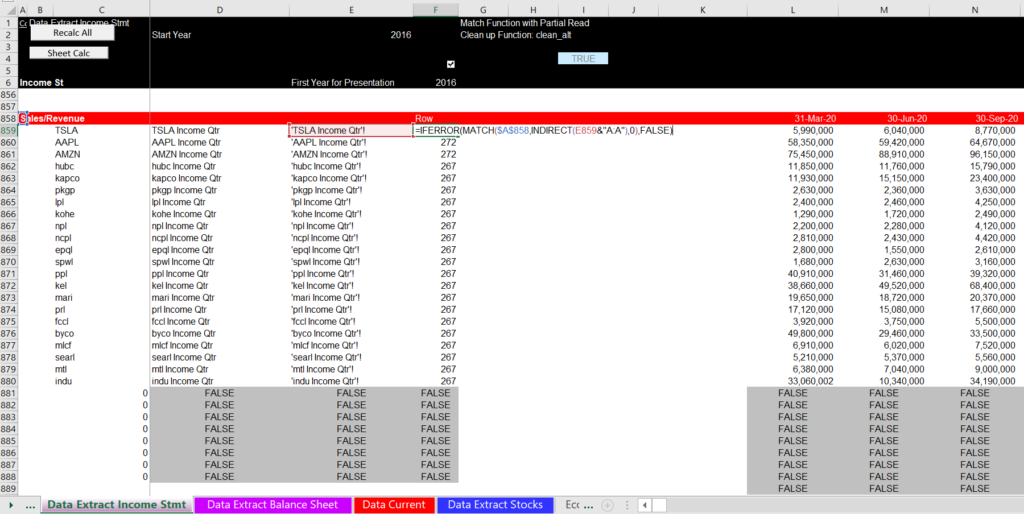
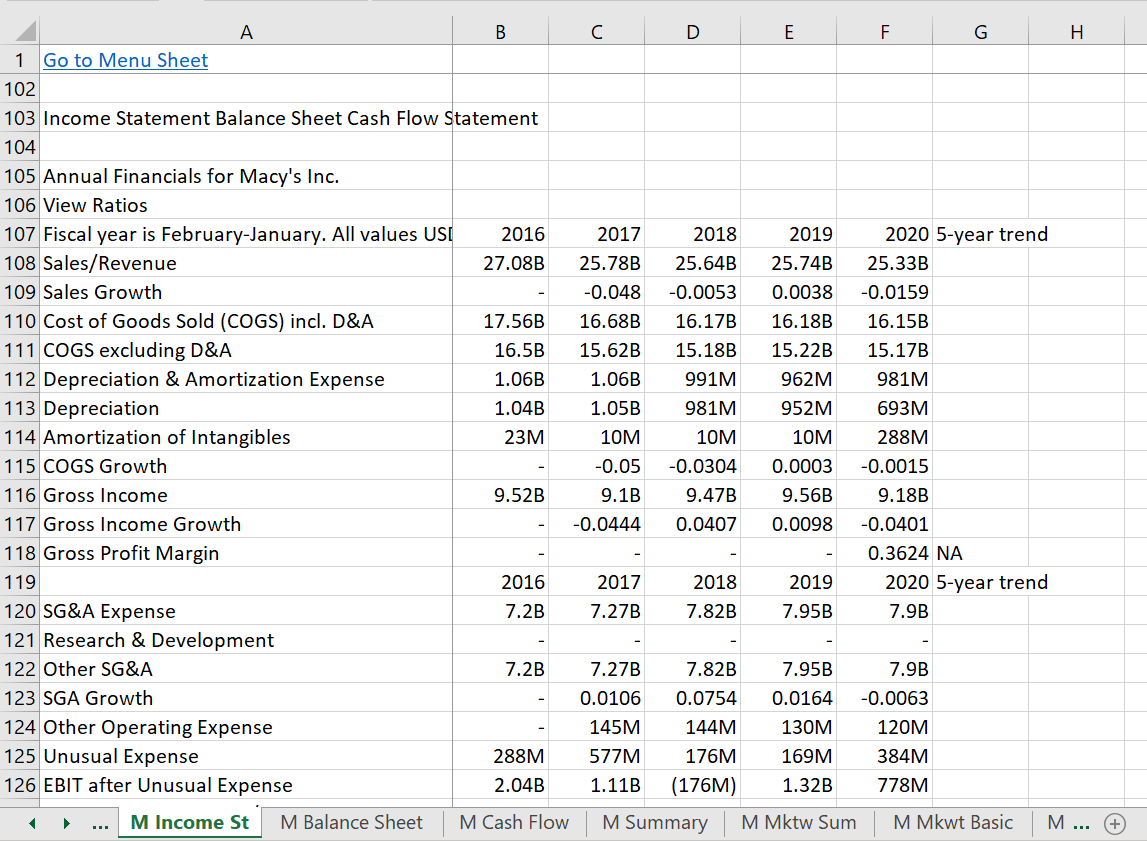
After you press the read button for one company you can watch as the data is read into the file. Then you will see separate sheets for the data that has been read into the file. The screenshot below illustrates one of these sheets for the income statement. There are a whole lot of these sheets for each company and if you include many different companies, there will be very many sheets. Once you have all of the data collected including the stock prices, the rest of the sheets organize data and compute ratios from the data using INDIRECT function along with LOOKUP and MATCH. In the screenshot below you can see that the data still has M for million and B for billion etc. The file includes functions to fix this and multiply the numbers to make sure the numbers have a common currency.
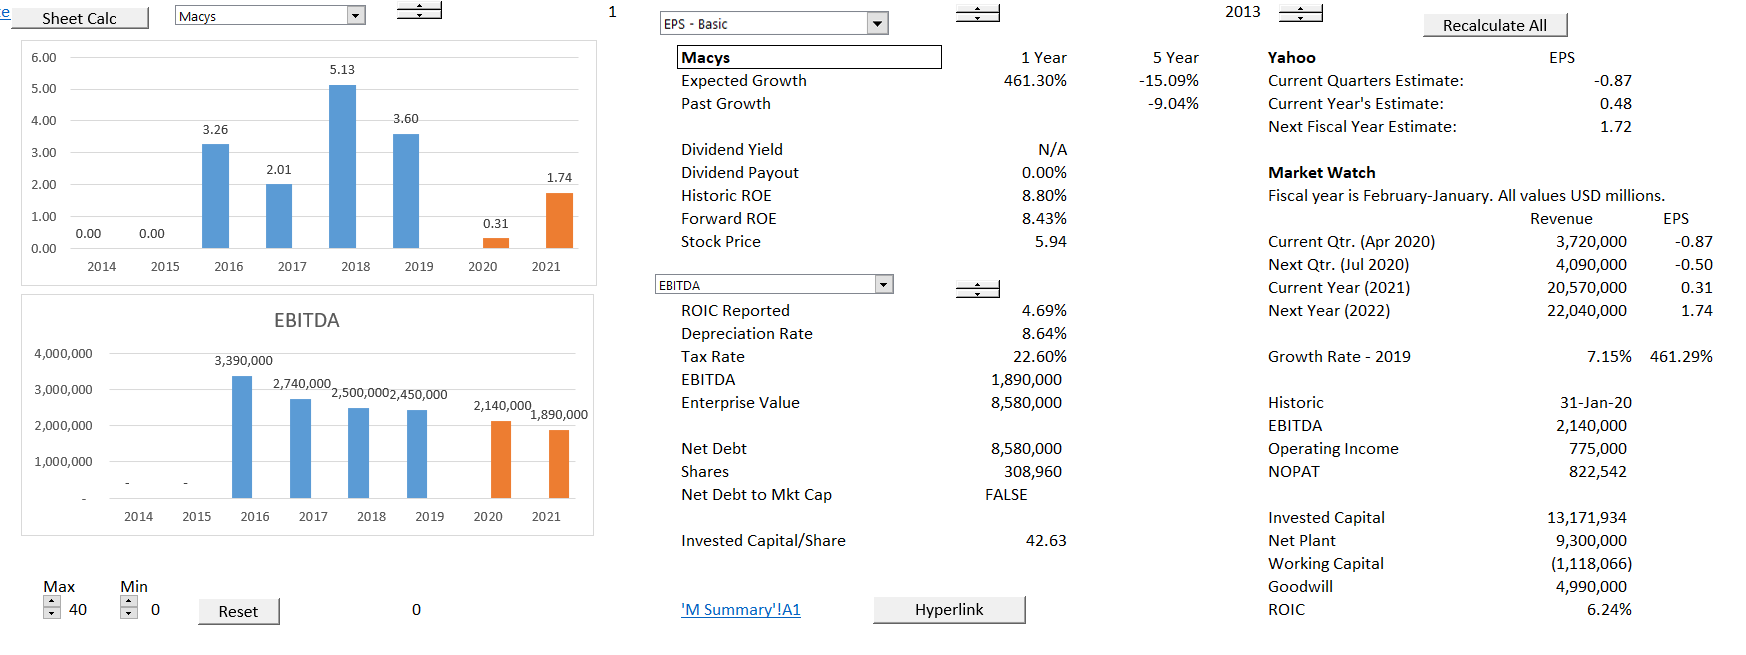
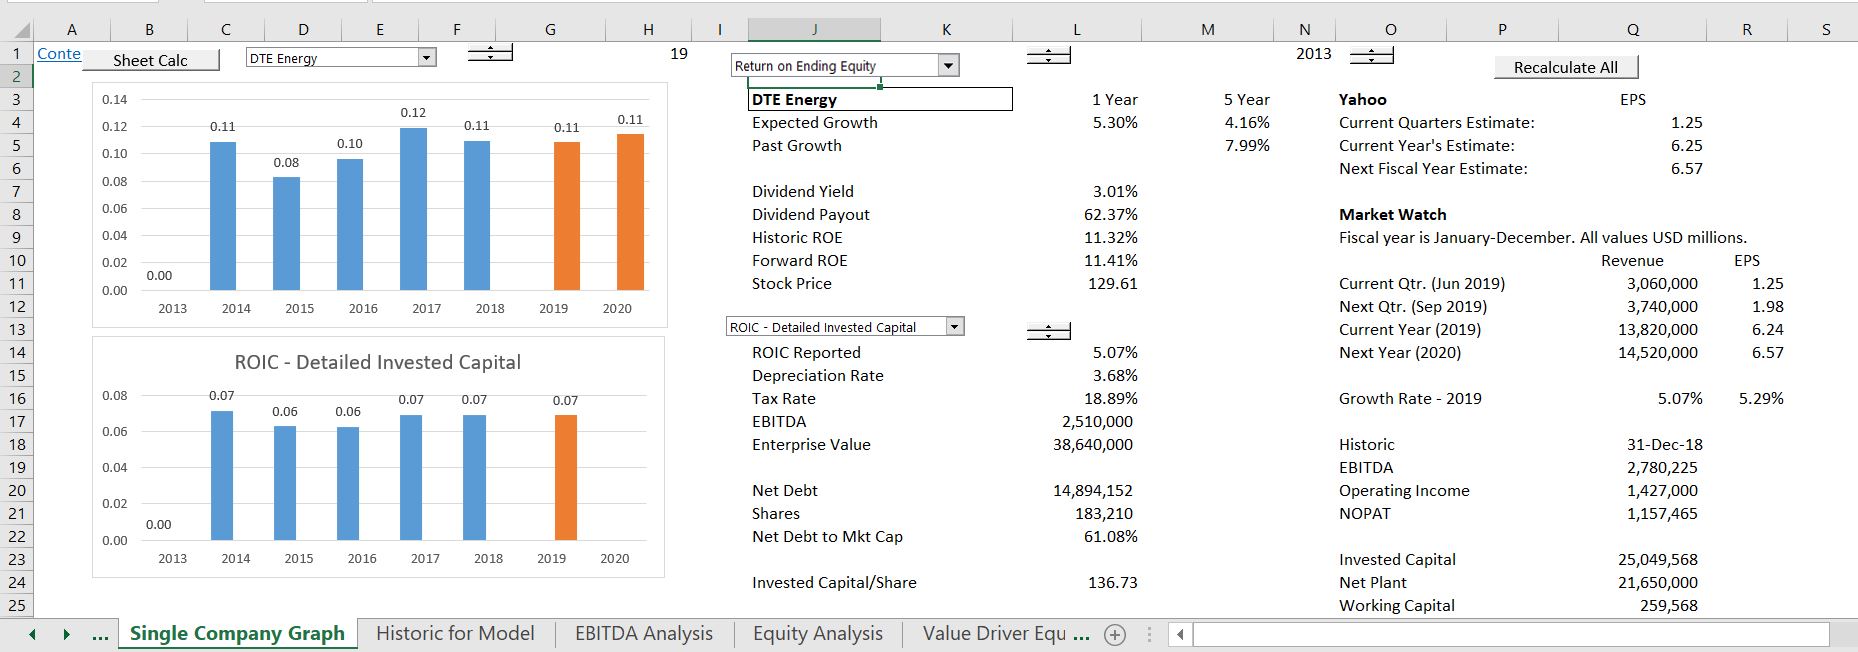
Once you read in the data you can look at some financial ratios. A good sheet to look at is the is the sheet named “Single Company Graph”. This sheet evaluate various ratios from equity perspective and free cash flow perspective. The first sheet illustrates the EPS and EBITDA. The top graph is the equity perspective and the bottom sheet is the free cash flow perspective. I have include a few graphs that illustrate the types of ratios you can use once you have the data loaded. This analysis of graphs can be more effective if you compare graphs within and industry. You could also work through the calculations and create your own ratios.
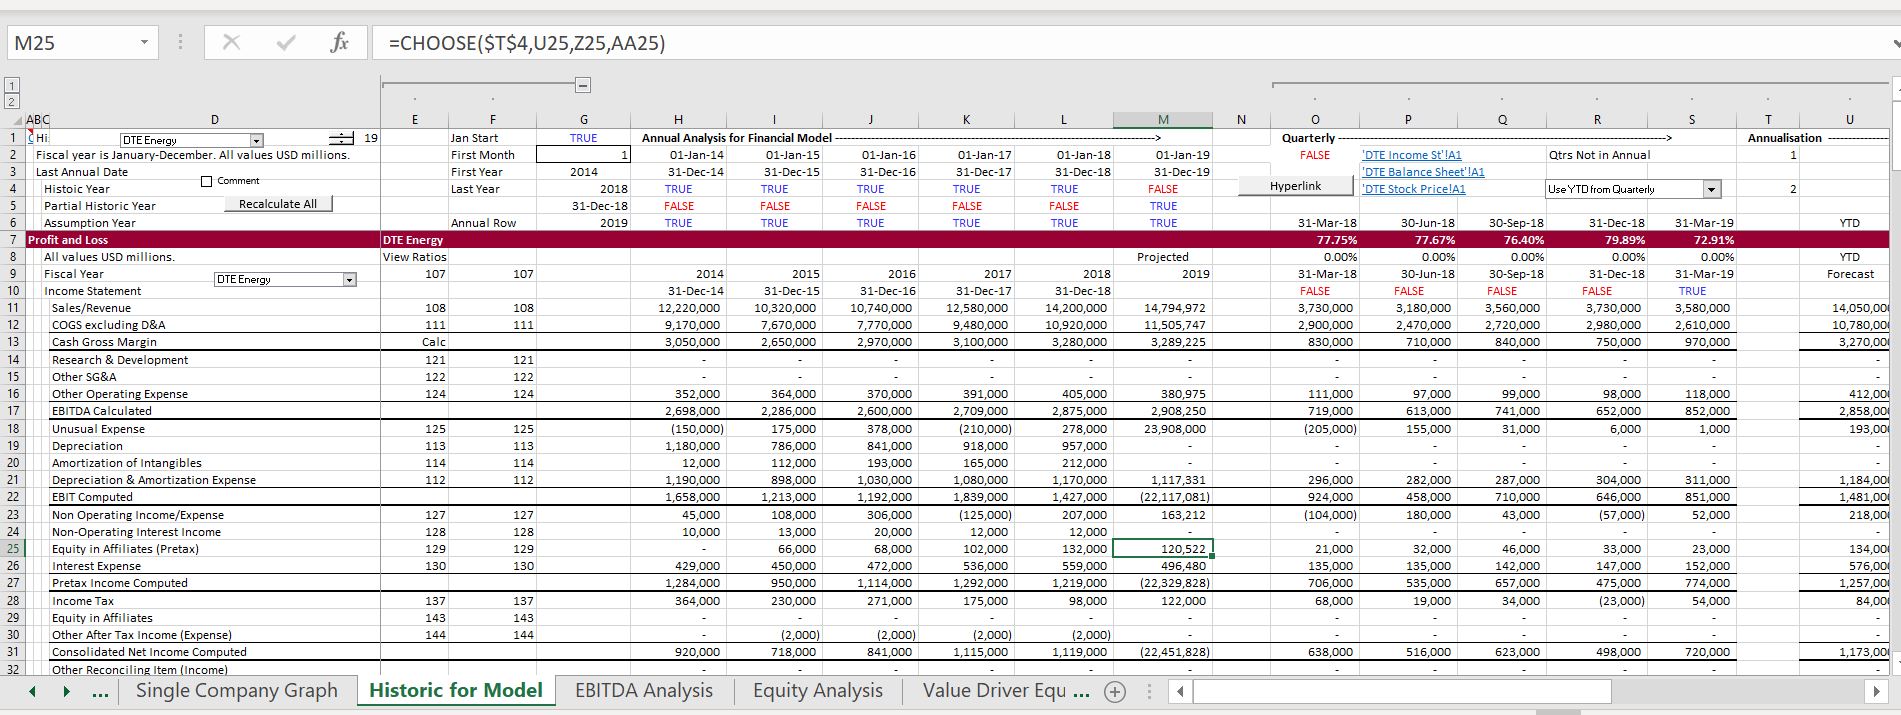
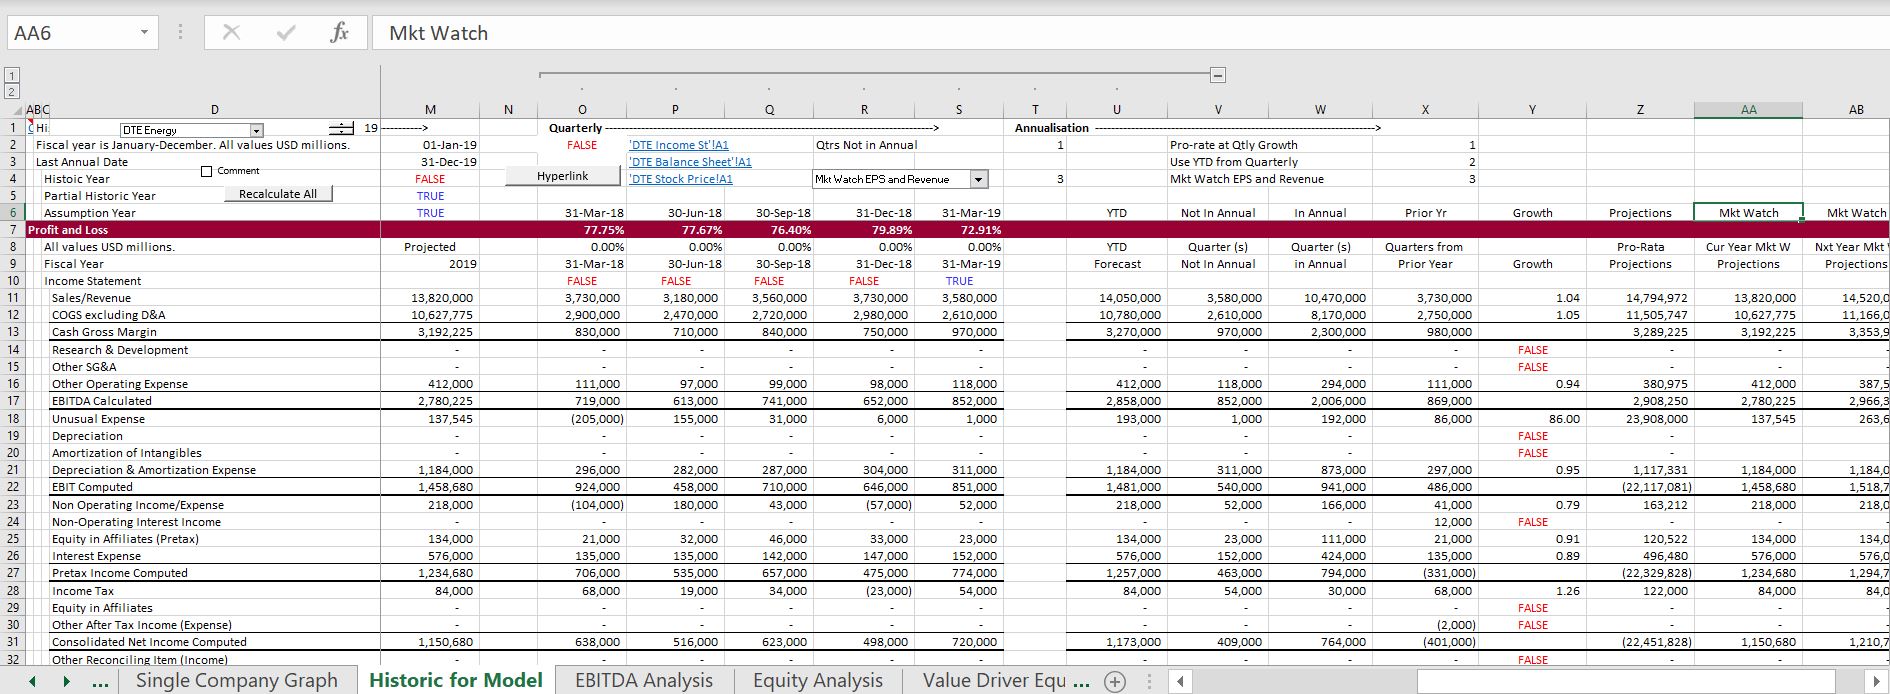
Let’s say that you are in the middle of a year and second quarter results have been published. If you use the last full historic year when making your forecast, the historic data may be stale. To rectify this situation you when you go to the page for downloading data, I have put a couple of techniques to use the quarterly data and create a forecast of the current year. As shown in the screenshot below, you can just use the quarterly data to create a year to date numbers (maybe this is ok when you are in the third quarter). Alternatively, you can evaluate the growth rate in quarterly data compared to the same quarters of the prior year and then create a growth rate. Finally, you can use the EPS forecast and the revenue forecast published by MarketWatch and Yahoo and try to derive the remaining expenses and revenues. These methods are illustrated on the screenshot below. There are a few different ways to use the quarterly data and some of these are illustrated in the page. The video below the screenshot explains how to find the ticker symbols and create a database that you can then use to create a corporate model.
[wonderplugin_video iframe=”https://www.youtube.com/watch?v=YeKy27iVLpI” videowidth=600 videoheight=400 keepaspectratio=1 videocss=”position:relative;display:block;background-color:#000;overflow:hidden;max-width:100%;margin:0 auto;” playbutton=”http://edbodmer.com/wp-content/plugins/wonderplugin-video-embed/engine/playvideo-64-64-0.png”]
Using the Financial Database File to Compare Financial Performance of Individual Companies
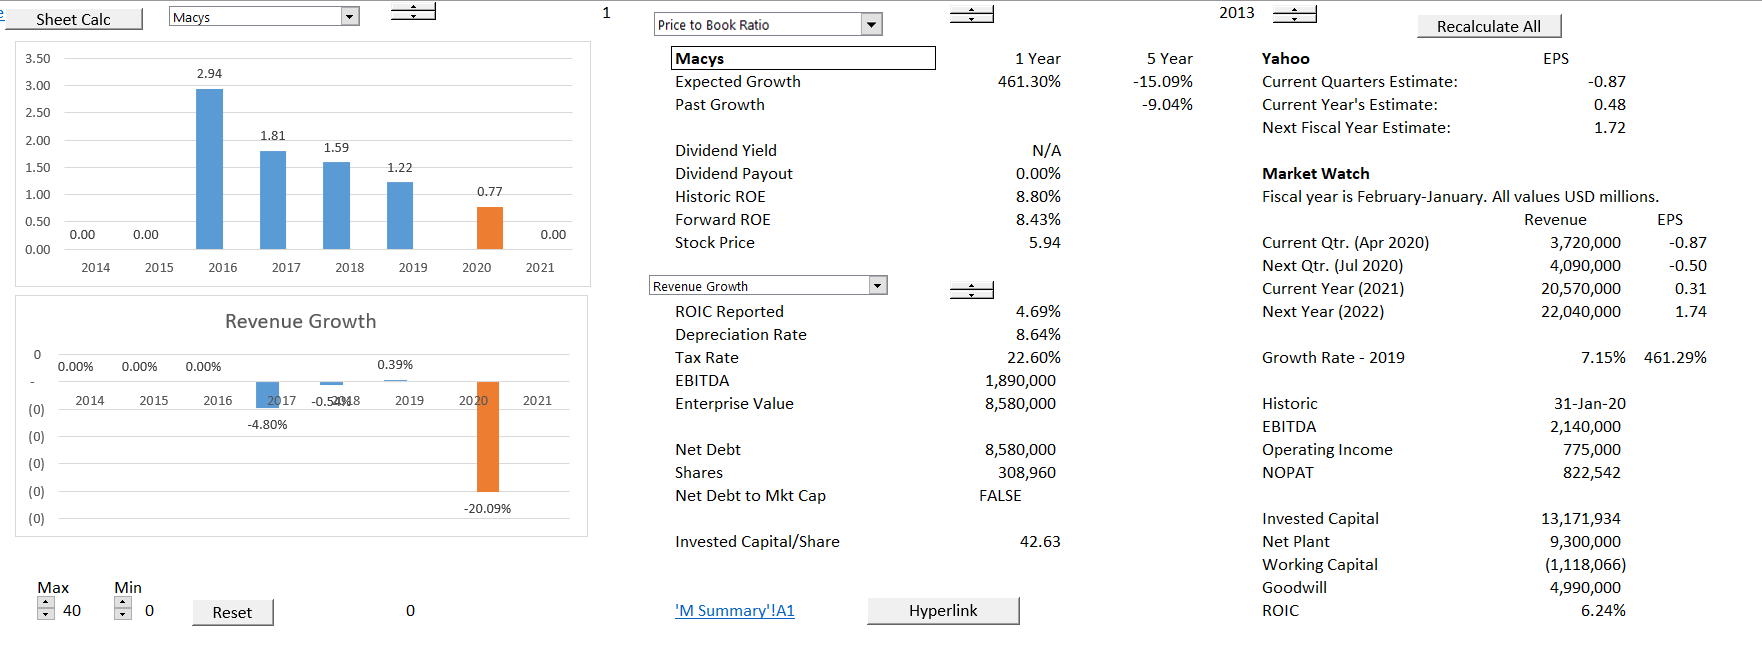
The excerpt below is an example of how you can look at different companies to try and tell a story. You can use drop down boxes for selecting different ratios and selecting different companies. Then you can do things like quickly working through different companies and observe the ROIC, growth in EBITDA, forward P/E ratios etc.
Using the Financial Database File to Evaluate Time Series and Comparative Data and the Proposition of Stability.
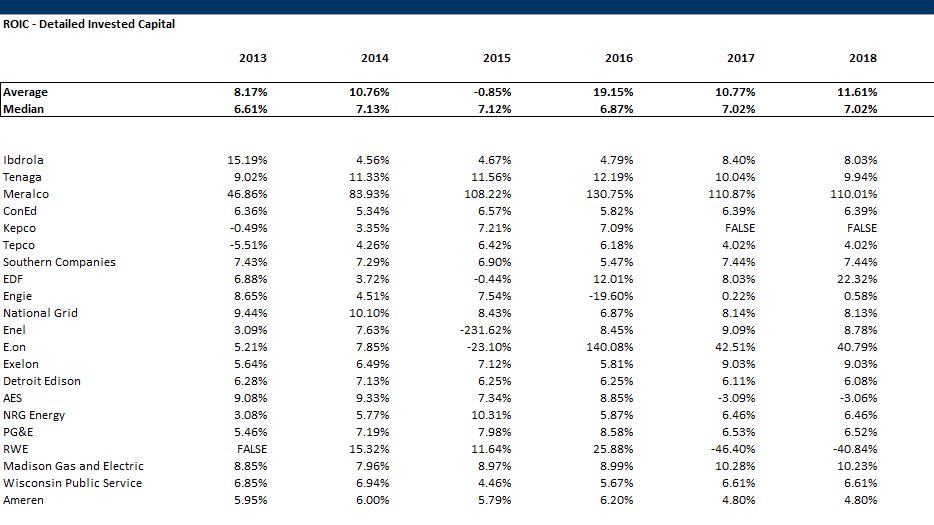
If multiples are used in valuation, they should be stable across time and stable within an industry. One of the main advantages of this database is that you can evaluate this proposition of stability. Most of the analyses demonstrate that the proposition of stability is false. You can use the drop down box to compare EV/EBITDA multiples, P/E multiples, P/B multiples and so forth. The first screen shot from the file demonstrates how you can compare ROIC across companies. If a company has a low ROIC, it may be difficult to increase to the industry average.
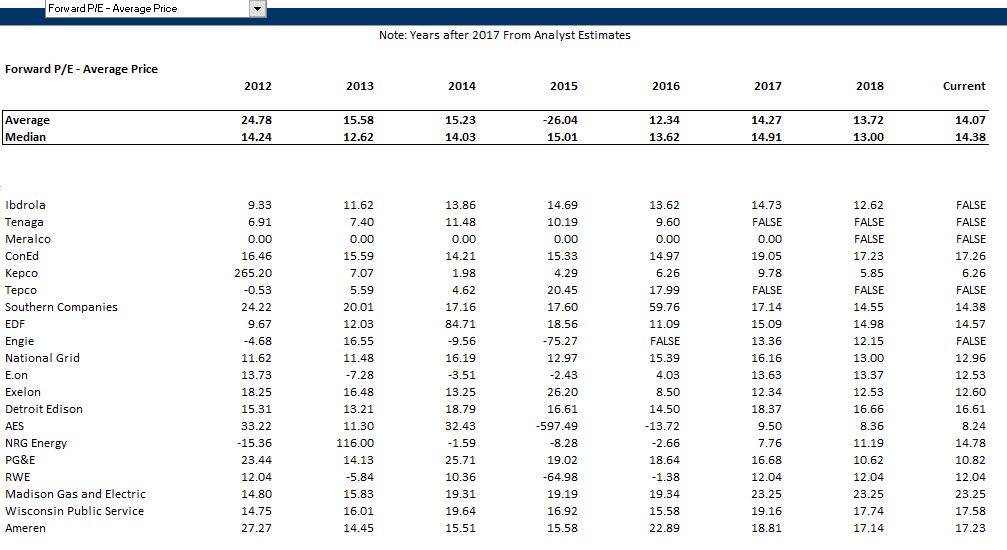
The second example demonstrates comparison of the P/E ratio across companies. The first question from looking at a table like this is determining whether you believe the ratios are constant across time and across the sample. As explained in the corporate finance theory pages, there are very good reasons that P/E ratios should should not be constant across either companies or across time. In this case, the median P/E ratio is pretty stable. But don’t be mislead. The individual companies have wide swings.
Using the Database Files for Analysis of Cost of Capital
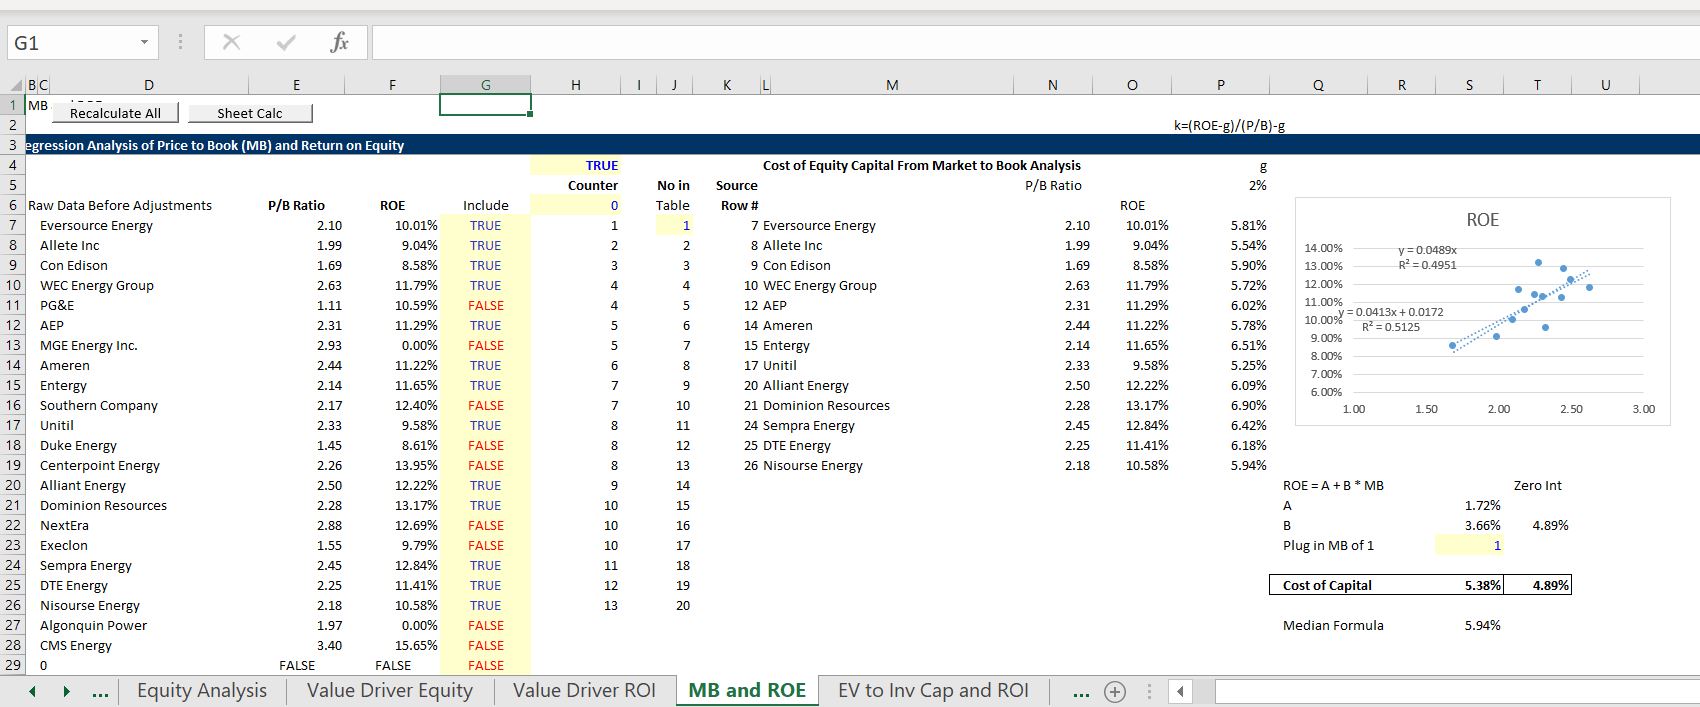
I originally created the database file to analyse cost of capital using price to book ratios and market to book ratios. For years I have been going crazy about finding alternatives to the CAPM that do not depend on the estimated equity market risk premium, the beta or the alternative possible risk free rates. The screenshots below illustrate a couple examples of how to use the financial database in computing the cost of capital. The first screenshot is for utility companies in the U.S. where I make a regression equation from the price to book ratio and the forward return on equity. When you try this, you should understand that the relationship can be affected by changes in expected return and growth rates. The simple formula for price to book is P/B = (ROE-g)/(k-g). In solving for k, the formula is k-g = (ROE-g)/(P/B) or k = (ROE – g)/(P/B)+g. The screenshot below illustrates computation of the cost of capital using the price to book ratio with a regression equation and with the growth rate formula. In the screenshot you can see how to change the sample of companies to come up with different cost of capital estimates.
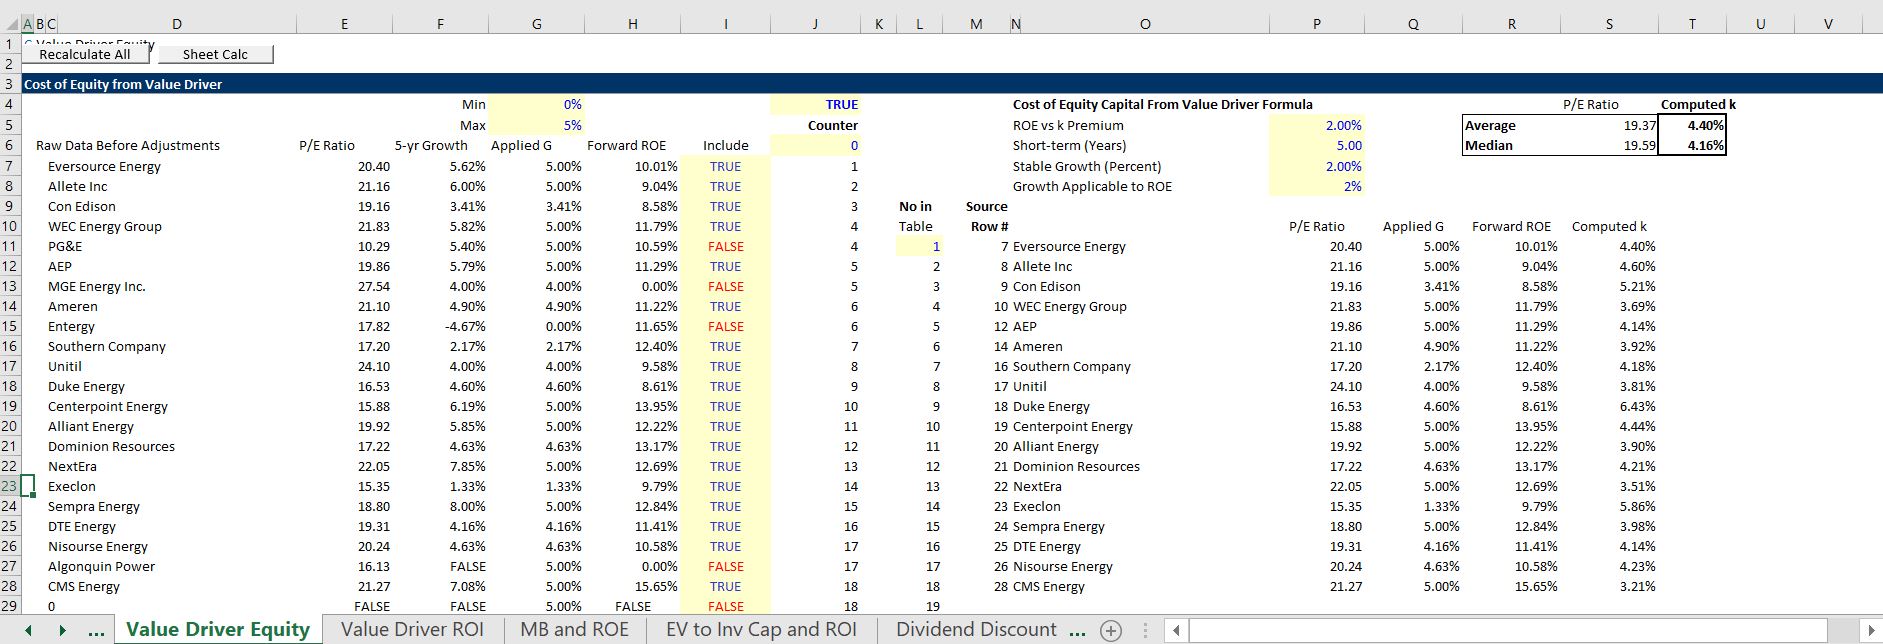
The screenshot below illustrates how cost of capital is computed using the value driver formula. The formula for the P/E ratio is P/E = (1-g/ROE)/(k-g). This formula can be re-arranged as k-g = (1-g/ROE)/P/E or k = (1-g/ROE)/PE + g. In the analysis below the growth is adjusted and the long-term growth is estimated. The formula is very sensitive to the growth rate. A user defined function is used to compute the cost of capital with different long-term and short-term growth rates.
Creating a Database: Step by Step Case with A Couple of Companies without Exchange Rate Issues (All Data is in USD)
In this section I describe how to use the financial database in a simple case. I hope this takes away any intimidation you may have about using the file. If you want to follow along with this you can start from a blank sheet. Putting a few companies into the file should only take a few minutes. You can download the Financial Database with examples and without tickers filled by clicking on the button below.
You can create the financial database that includes historic multiples, cost of capital analysis and historic financial data structured for financial models by entering ticker symbols on the first page of the spreadsheets available for download below. The historic database can also be used for cost of capital analysis and many other analytical tasks.
Step 1: Clear the Sheets
To work through a case using the financial database from A-Z first clear the data in the sheets. You can do this by pressing the box named “Clear Sheets” on the menu sheet as shown in the screenshot below. When you press this button, all of the sheets after the sheet named “Break Sheet” will be deleted. (Do not delete the sheet named Break Sheet or the Clear Sheets macro will not operate properly.) Note the #N/A is shown.
Step 2: Enter Ticker Symbols in Menu Sheet
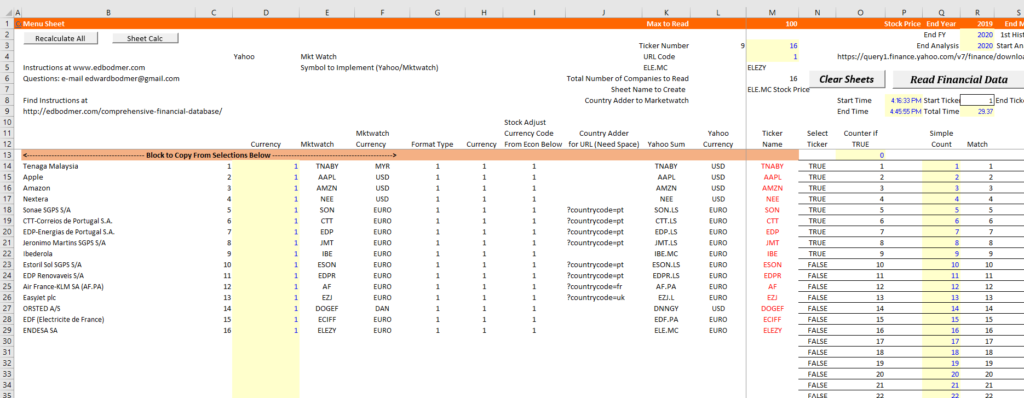
After clearing the sheets, enter the ticker symbols on the menu sheet. Finding the appropriate ticker symbols can be the most time consuming part of the process. This can be a bit painful for companies outside of the US where the company has an ADR stock price as well as a stock price in local currency. For the simple example to start with, I have entered three ticker symbols for U.S. companies as shown in the screenshot below. To get the other tickers, I suggest that you use go to a search engine and then throw the markewatch ticker and the yahoo ticker into the spreadsheet.
If you want to use and existing set of tickers such as for the Dow 30 stocks, you can also go to the bottom of the sheet where I have put in some examples of companies to use. To use the selected companies, just copy the ticker symbols in to column D and column F of the menu sheet and then copy the company names into column B. You can also copy the currency adjustment factors into column C which will normally be 1.0 except for UK companies and the pence/pounds problem as well as companies that do not have stocks in local currency on yahoo.
For the selected companies I have included the ticker symbols and potential adjustments for currencies (one of the horrible examples is that Yahoo Finance uses Pence for UK companies while Market Watch uses Pounds. This means when comparing earnings to stock price and other statistics, an adjustment is required.) Another problem occurs for Japanese companies where Yahoo does not report stock prices in Yen. Note that you should put the extra end of the URL into the main sheet.
Step 3: Download Data by Pressing Buttons on Menu Sheet
After you have collected the ticker symbols, you can run the three downloading buttons (the third of which is not be necessary unless you are making a CAPM analysis). The screenshot below shows the buttons that you press on the menu sheet. After you press the buttons, there should be a message at the bottom of the sheet that shows which URL is being scrapped. This is illustrated in the second screenshot. Please do not forget to clear the sheets first. Reading the financial data may take a long time and it may be a good idea to even re-start your computer or get more RAM.

Finding the correct tickers on Market Watch and Yahoo can be the most time consuming part of the process for companies outside of the US where the company has an ADR stock price as well as a stock traded on a local exchange. As explained below, the Market Watch financials are expressed in the local currency of the company. This means that to compare the company to stock prices, the stock prices must also be expressed in the same local currency.
Downloading Comprehensive Financial Data for Different Industries and Selected Groups of Companies
You can create your own files for different industries by entering ticker symbols in the menu page of the files that are available for download below. This ticker symbol business can be a bit tricky if the companies report financial statements in different currencies than the USD. I have included a few examples of how you can download files below for various industries that are attached to the buttons below so you can see how the programs work before you try things yourself. After you look through the stuff that is produced, you can to press the buttons to download and arrange the data. The file for insurance companies is different from the other files because of financial reporting. For insurance and financial companies, financial statements are reported in a different format from industrial companies. The file to download named insurance companies includes an example of how the process can work when there are different financial statements. . Please note: When you open the files, run the macro titled “RECALCULATE ALL” (find the button on the second page). .
Videos that Demonstrate how to Collect Ticker Symbols in Different Countries and Put Together a Database
The video below demonstrates how to use the file once the tickers have been entered and the types of information you can get from the file including: (1) comparative reports of P/E, EV/EBITDA, P/B, ROE etc.; (2) a historic layout of data that you can use as the basis of financial models; (3) an interactive report for single companies; and (4) cost of capital analysis.
[wonderplugin_video iframe=”https://www.youtube.com/watch?v=MUAZj-1Cv3U” videowidth=600 videoheight=400 keepaspectratio=1 videocss=”position:relative;display:block;background-color:#000;overflow:hidden;max-width:100%;margin:0 auto;” playbutton=”http://edbodmer.com/wp-content/plugins/wonderplugin-video-embed/engine/playvideo-64-64-0.png”]
Technical Discussion of the Financial Database File
Macros are used in the files that allow you to enter ticker symbols and then get a whole lot of data. The process adjusts URLs market watch and yahoo.com according to ticker symbols and then puts financial data into a lot of sheets. The INDIRECT function is then used to gather data together and summarize data in different ways. You can update the data like with other files although depending on your internet speed it may take a bit longer to read all of the stuff when you update your analysis. It has taken a lot of iterations to develop this file and I will probably change it in the future. I had thought you may be interested in the method for reading the data into the file and then arranging the data for comparison. I am told by young people that this is not interesting. People seem to want to press a button and just be finished. Apparently you do not want to look at any VBA code or other techniques.
Despite what I have been told, I have made various videos that describe technical details of how to develop the databases. I have also put a set of power point slides together that documents technical details of developing the file.
Power Point Slides that Describe Technical Details of the Financial Databases
[wonderplugin_video iframe=”https://www.youtube.com/watch?v=MTskVI_VERk” videowidth=600 videoheight=400 keepaspectratio=1 videocss=”position:relative;display:block;background-color:#000;overflow:hidden;max-width:100%;margin:0 auto;” playbutton=”http://edbodmer.com/wp-content/plugins/wonderplugin-video-embed/engine/playvideo-64-64-0.png”]
[wonderplugin_video iframe=”https://www.youtube.com/watch?v=UZhAWLk_b0Y” videowidth=600 videoheight=400 keepaspectratio=1 videocss=”position:relative;display:block;background-color:#000;overflow:hidden;max-width:100%;margin:0 auto;” playbutton=”http://edbodmer.com/wp-content/plugins/wonderplugin-video-embed/engine/playvideo-64-64-0.png”]