This page describes how to work with and update comprehensive databases on merchant electric power prices in U.S. markets with multiple decades of history. The historic merchant electricity prices and natural gas prices are complied for the ERCOT region; ISO New England; PJM; California and other regions compiled by the Energy Information Agency of the U.S. I have tried to provide some history that for some reason is not easily available in the websites without going to the sites, searching for some CSV files and then painfully putting the prices together in some sort of consistent manner. When providing history, I have also compiled the regional natural gas prices. My general idea is to put the history together and then provide you with instructions as to how to update the data so that you can keep your data current. In terms of merchant electricity markets, there are different regions of the U.S. with different market operators which makes it difficult to read in all of the data in an easy manner. As with the other markets, you can use the historic data that I have retained in the separate files and then update the data by yourself.
I used to have a crazy dream that you could go to a bunch of files and simply click a button to update all of the files. This was a bad idea. So now my idea is to create a lot of history and allow you to in a short period go to the market websites and update things pretty quickly. I have included this file because you cannot go to a website like yahoo finance and simply get all of the prices. I have extracted data for separate markets such as PJM, ERCOT, NE ISO and the California ISO as well as extracting data from the EIA website that includes regional gas prices and on-peak daily electricity prices. With this data you can look at a lot of historic case studies including the California crisis of 2000 and the ERCOT mess of 2021. Each of the files is available for downloading below and for each of the files, you can compute market heat rates and evaluate the value of alternative strategies.
.
.
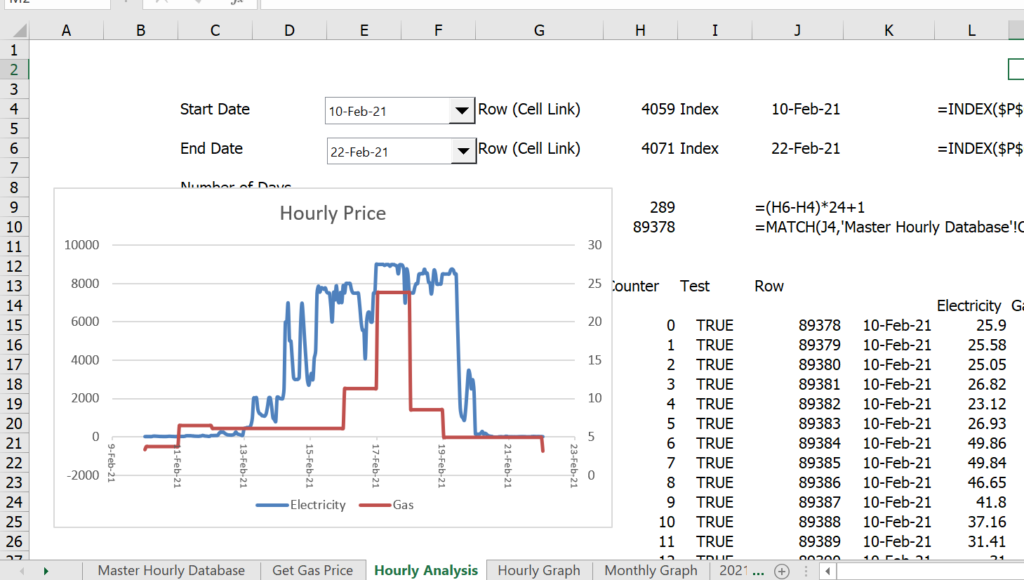
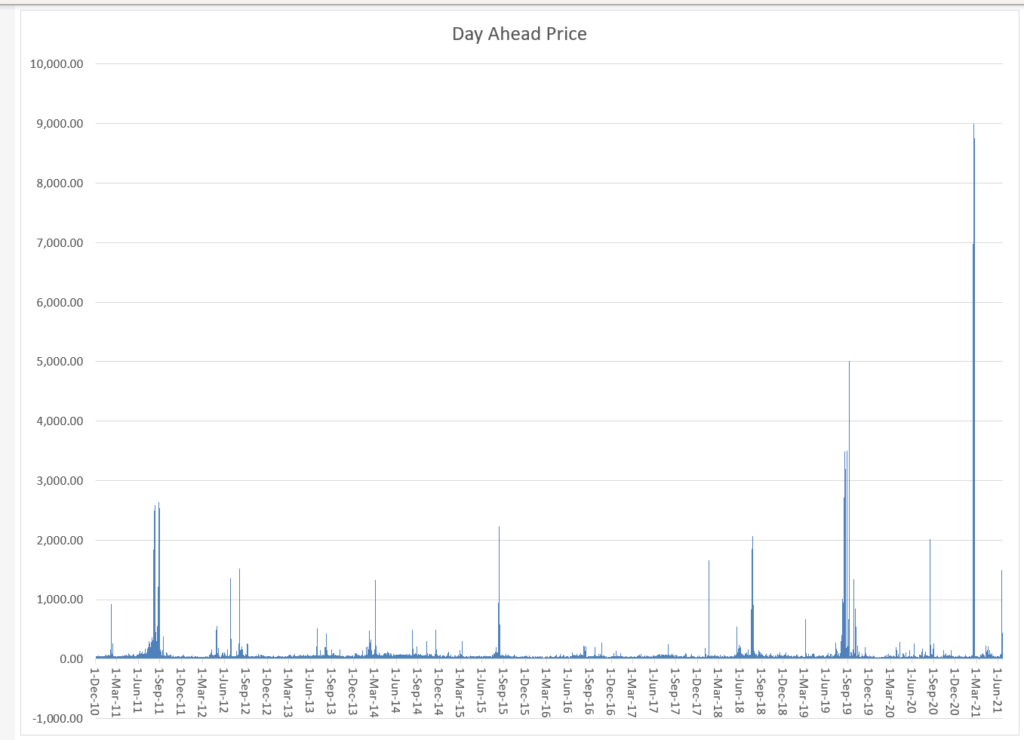
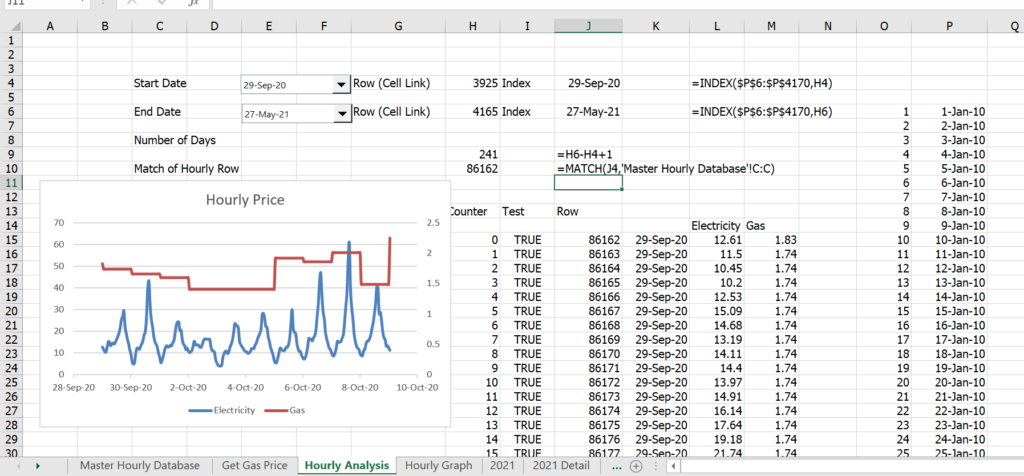
When I started thinking about merchant prices a long time ago, we had to come up with theories about how merchant prices could behave. Now we have some actual data and can study selected cases. A couple of things you can do with the databases are illustrated below. The first graph shows the approximately 10 days of the price spike.
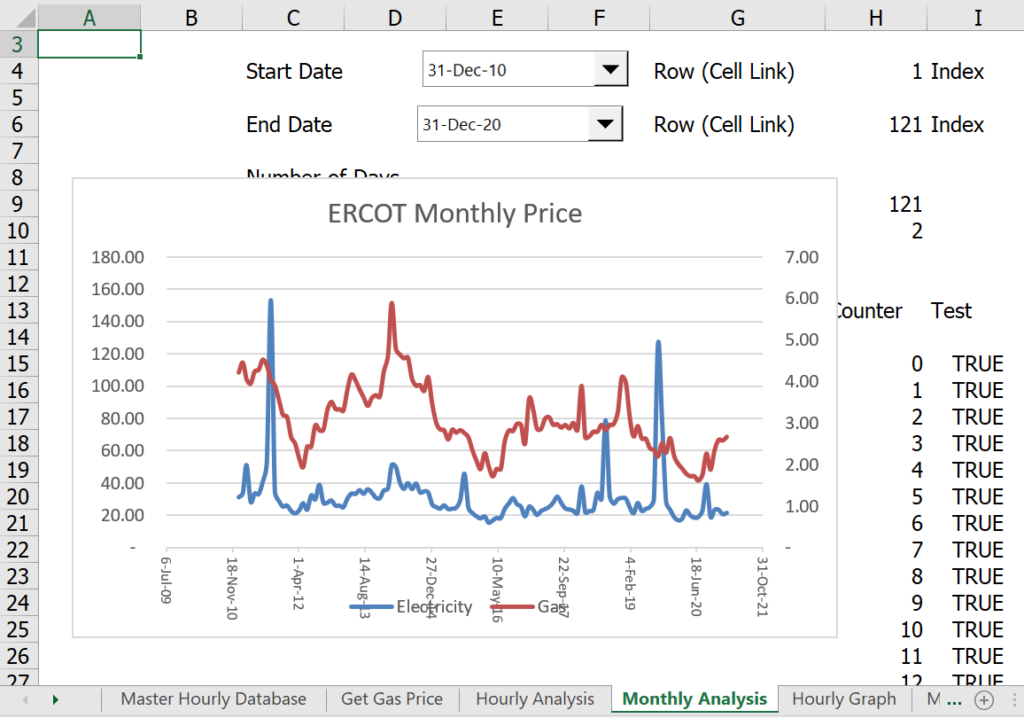
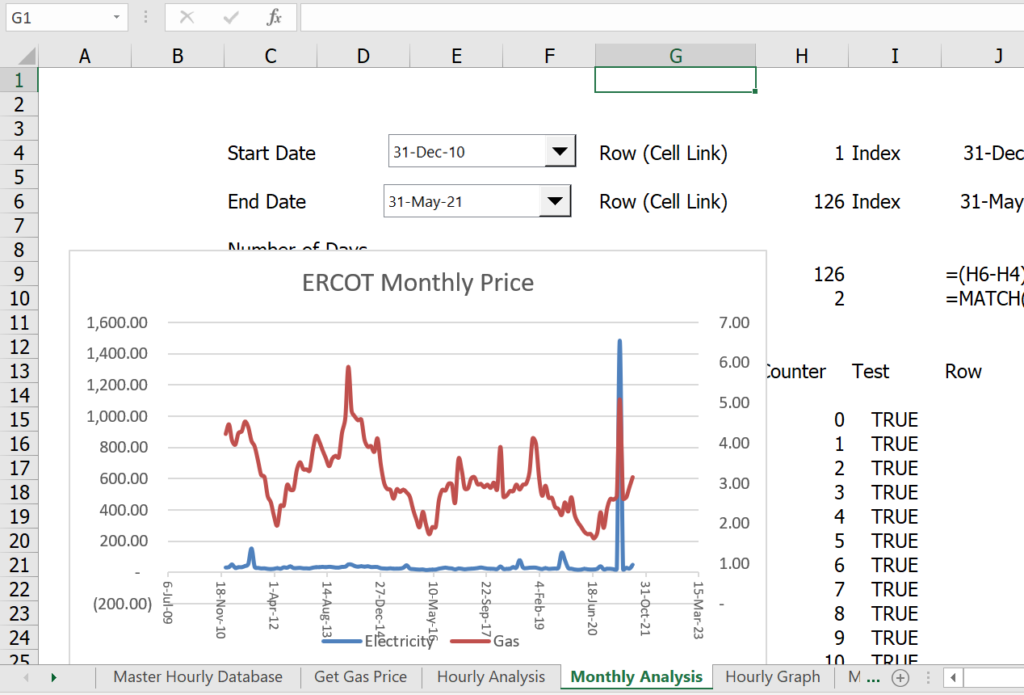
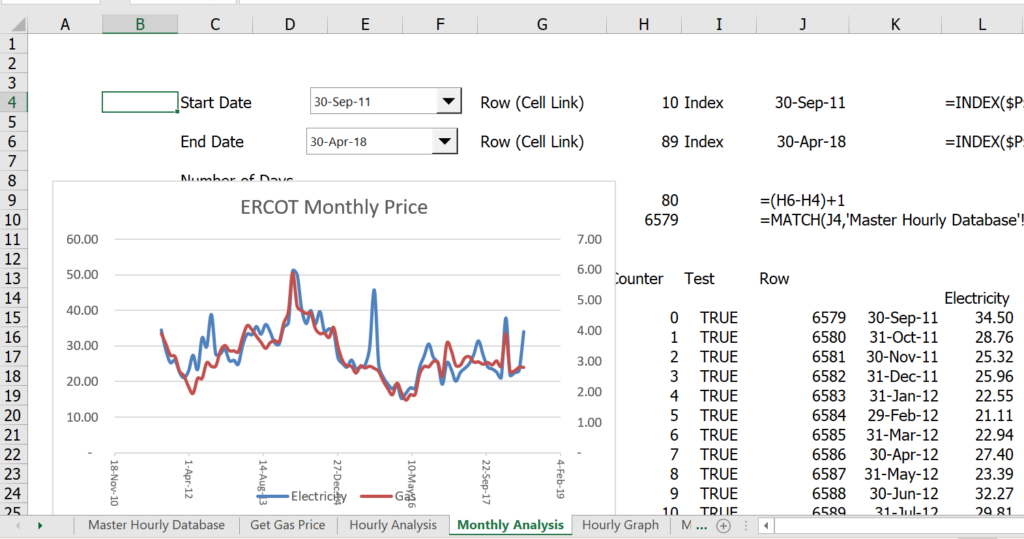
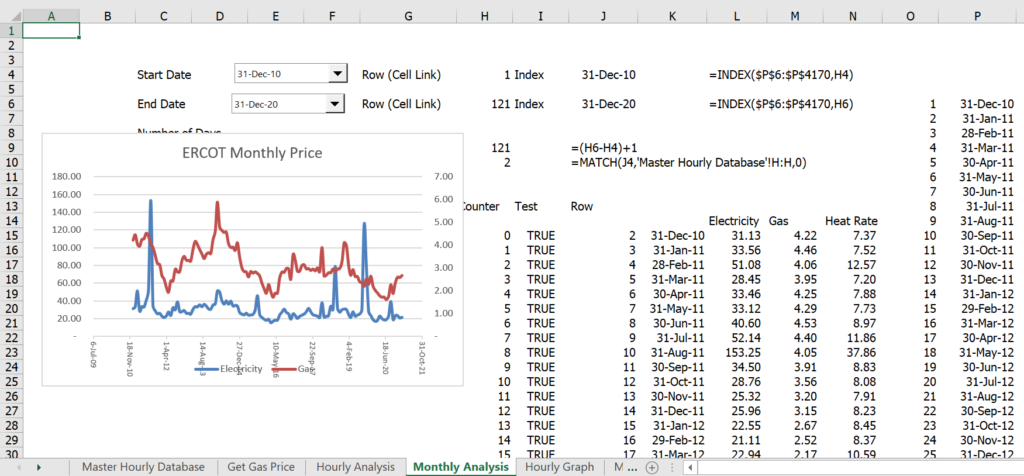
The two graphs below show the ERCOT monthly prices with and without the price spike in March 2021. In both graphs the effect of the spike is dramatic. This shows that you cannot really make a simple forecast of an implied heat rate. The bottom graph shows the very close correlation between electricity and gas for a large block of years between the price spikes.
Because the files are large, they cannot fit on the website properly. Here is the link for the ERCOT file.
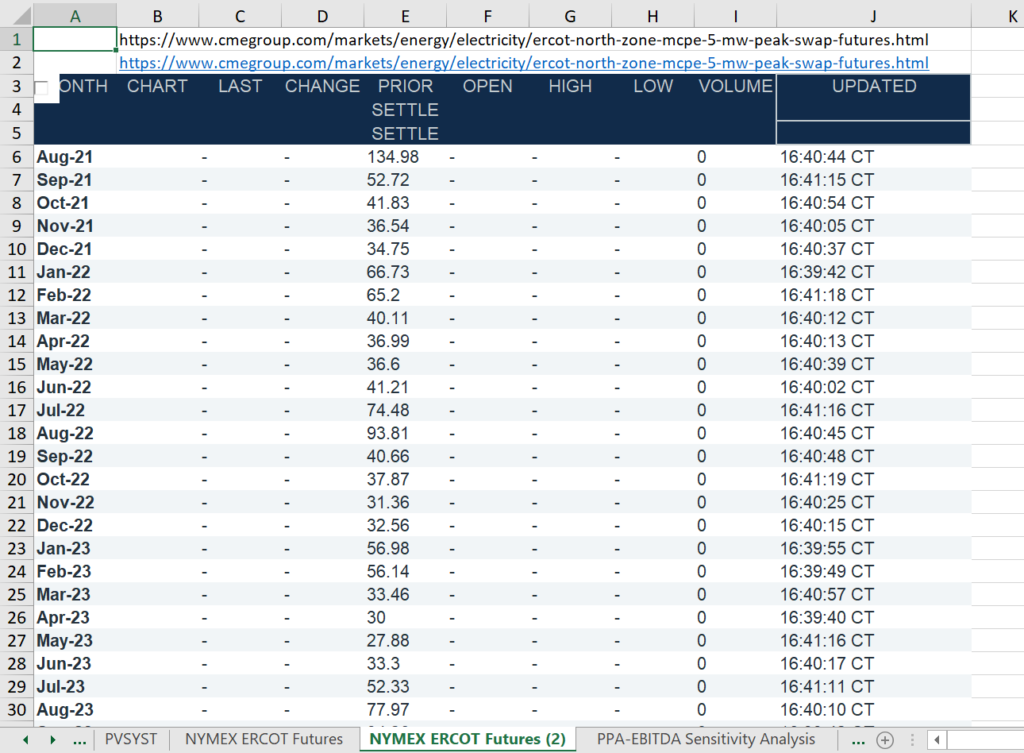
You can compare the merchant prices to the forecast prices and you can derive the implied heat rate for forward curves. The screenshot below illustrates the futures price that is published on the NYMEX for the ERCOT North Hub. Unfortunately I cannot get this to automatically download and I cannot find the old forward prices, but you can get the recent prices.
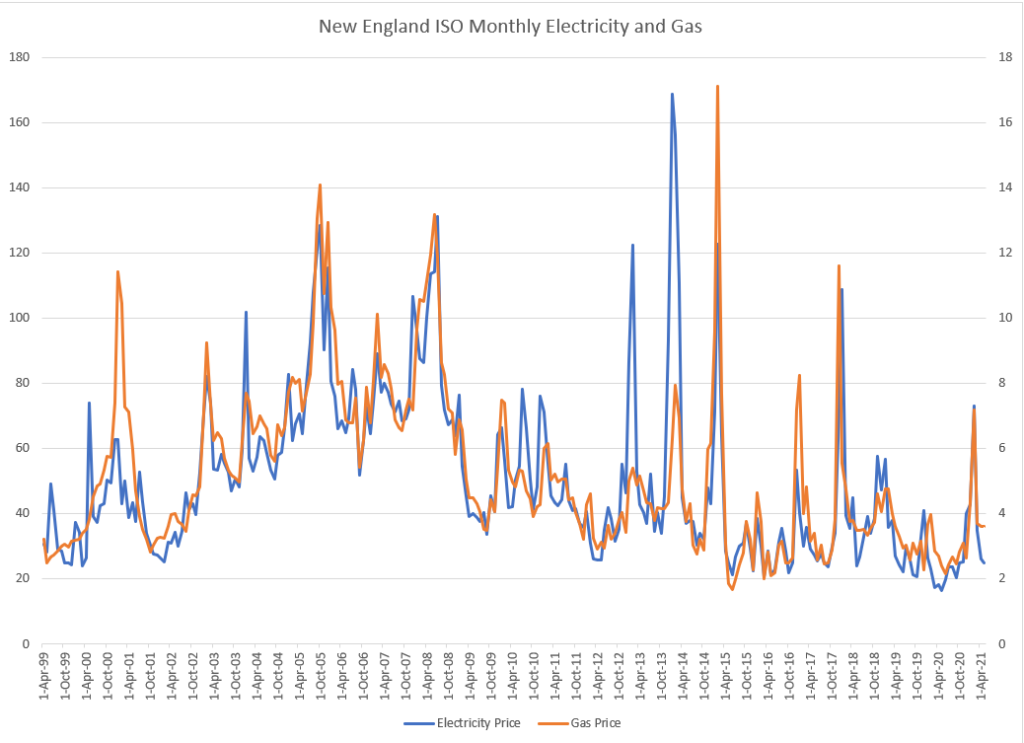
In the case of the New England ISO, there are no price spikes and correlation between electricity and natural gas price is very close. But this does not really tell the full story.
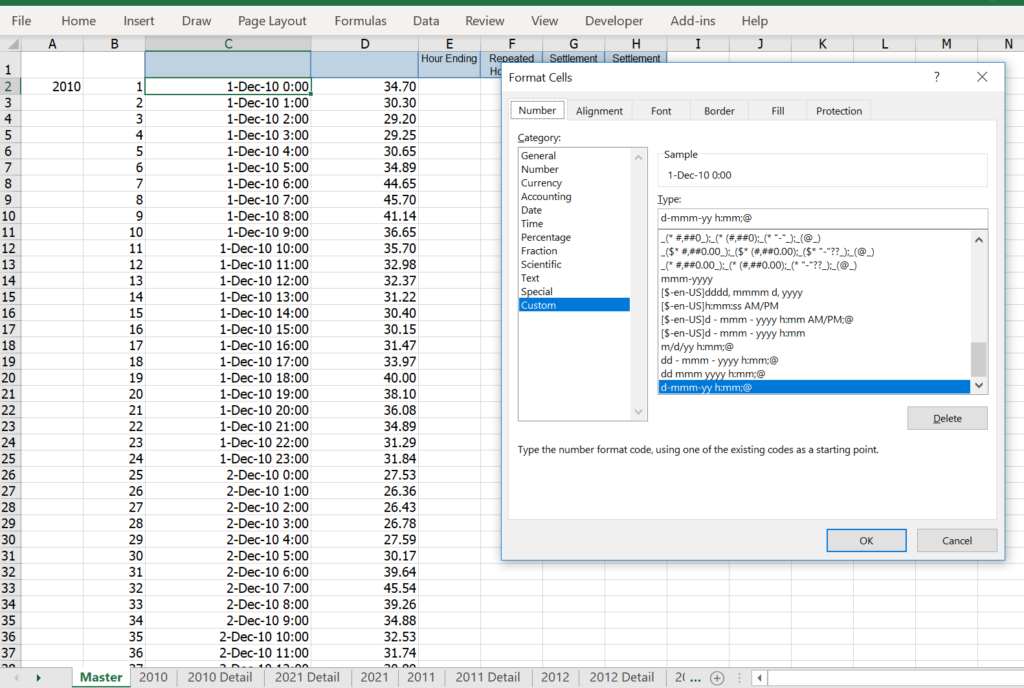
So, here is the step by step process for updating the UK price data. As with other databases it is helpful to use the following data format for the hours and the days. I use this so that I am not confused by U.S. date formats. Press CNTL, 1 to get the format etc.
d-mmm-yy h:mm;@
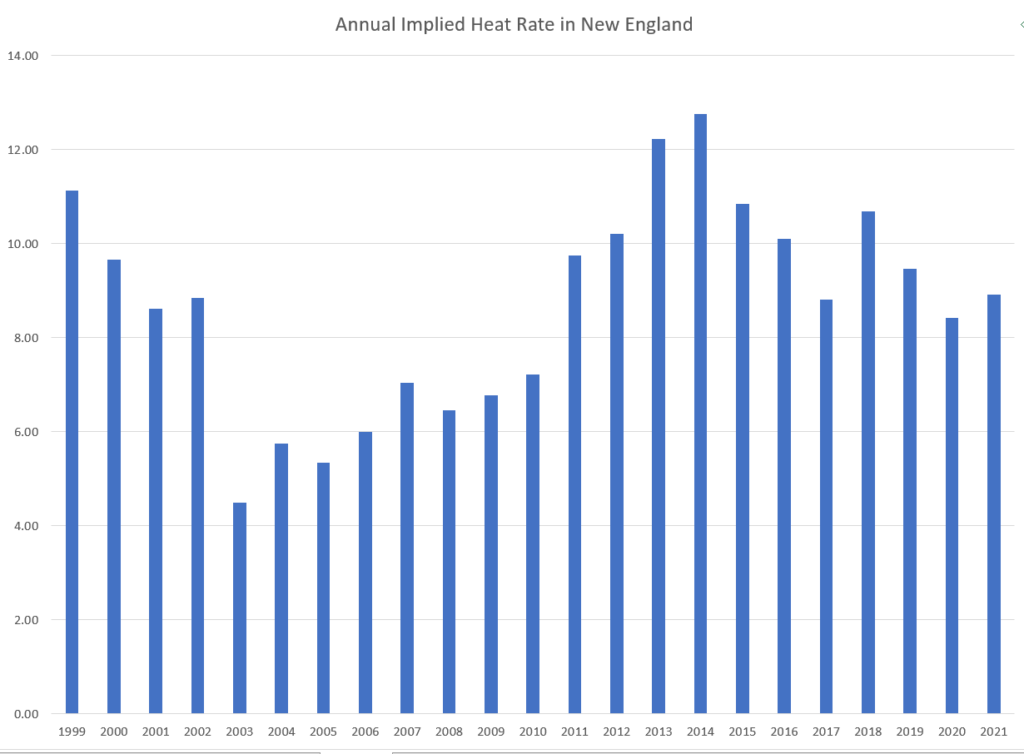
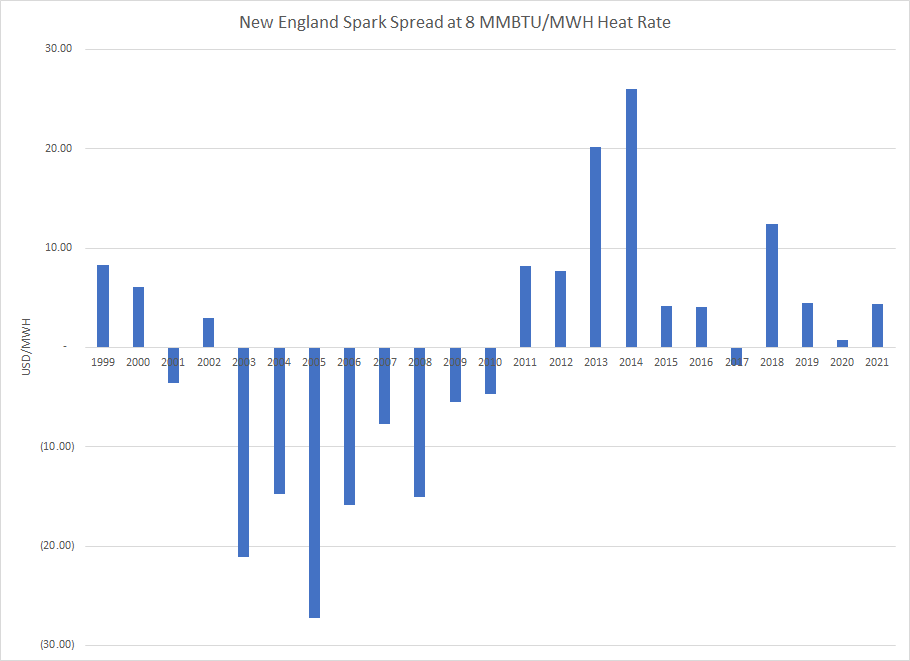
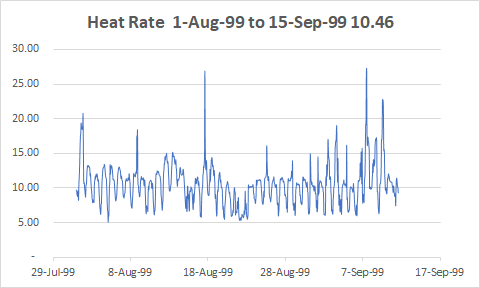
The real story comes from computing spark spreads and from computing the market implied heat rate. While the data is hourly, the implied market heat rate is shown below using AVERAGEIF.
.
Introduction to Databases
In the databases below, Electricity prices are tabulated in nominal USD per MWH terms and also relative to natural gas prices, in MMBTU/MWH. To express electricity prices relative to natural gas prices, the electricity price (USD/MWH) is divided by the natural gas price (USD/MMBTU), yielding MMBTU per MWH. The market heat rate provides a better indication of the relative price of electricity in most markets. It can also be used to gauge the profitability of a operating a natural gas plant — when the market heat rate is above the plant heat rate it is profitable to operate the plant.
I have tried to go back as far into history as I possibly can for the different regions which involves taking data from different sources. In developing a database of merchant prices, I think the aim is to make an hour by hour file that is flat. This means that prices of electric power in different currencies as well as natural gas prices and coal prices are in a single column with multiple rows. After you get this, you can use all kinds of LOOKUP’s, AVERAGEIF’s, MATCH’s and INDEX’s to put together different kinds of analysis. For me, when I update the files and maybe for you, I begin by describing how to update (and create) this big flat file which is a page in all of the merchant plant databases. As with many things in life, you can try different things in different files on a kind of random basis and then find something that is really effective. A few of these things are to created a column with the year so you can navigate with the CNTL up and CNTL down. Also using ALT, E,I S with 8760 or 8784 to count the hours in a year is very helpful. Finally, using date counters when you add 1/24 instead of 1 to count by hour is very helpful. As I wrote above, every time I go to the Philippines, I sit in a little hotel room and I update the database.
The data on this page U.S. electricity prices is for day-by-day on-peak. The U.S. electricity price data can be obtained from the EIA or individual ISO websites. Tabulating hourly data from ISO websites is included in a separate webpage.
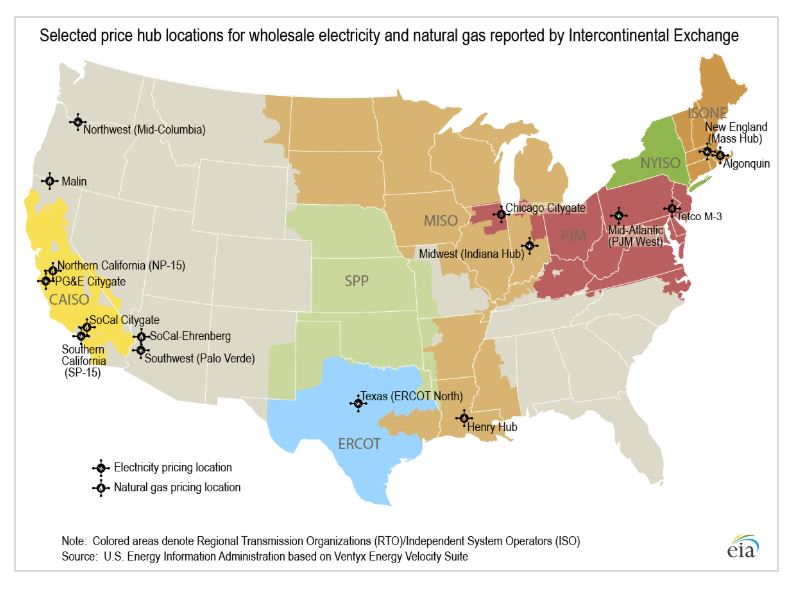
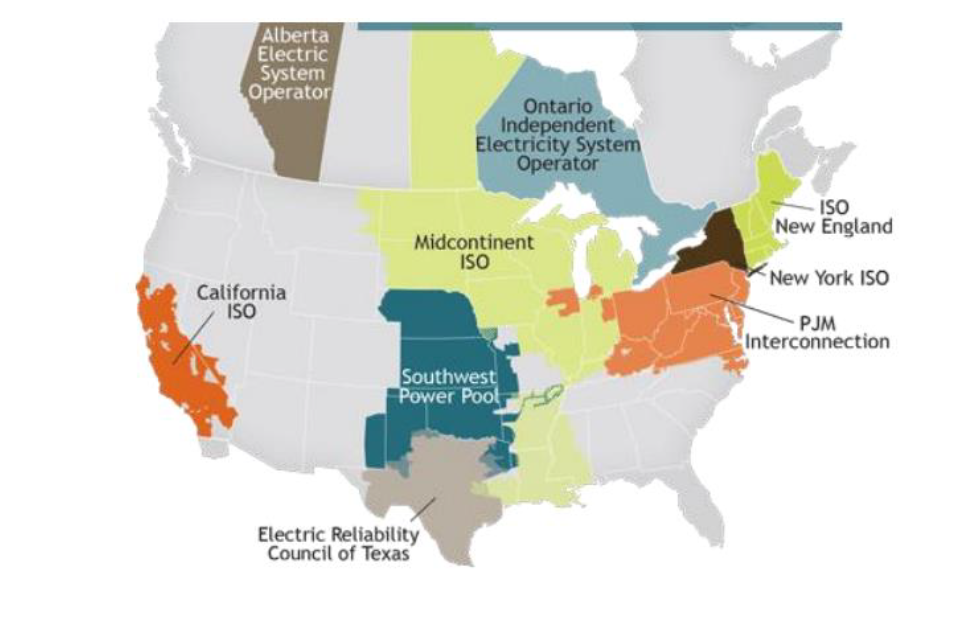
In the files listed below I have tried to compile U.S. merchant electricity price data since various markets began to be published in the 1990’s. You can find day-by-day on-peak data from the EIA website (it does not have hourly detail and you cannot examine on-peak versus off-peak prices). The EIA website has different regions and with a some work you can get a history of prices and it includes a lot of data on comparative natural gas prices for the different regions. The different U.S. regions for electricity price data is illustrated on the screenshot below.
.
In the database that you can download below there are prices beginning in 1996 for the California markets; back to 1997 for the Midwest markets; and back through 1999 for the New England region. I have put together data on prices that I have complied since various markets began to be published in the 1990’s. You can go to the ISO New England, ISO New York and PJM websites and collect hourly data these days. You can also get day by day on-peak data from the EIA website (it does not have hourly detail and you cannot examine on-peak versus off-peak prices).
In creating merchant U.S. electricity prices I have included a database file with historic prices and also a file with the ability to update prices. The databases are in the following files: Current EIA Format and Database.xlsm Retrieve US Regional Natural Gas Prices.xlsm US On-Peak History.xlsx
How to Update U.S. Merchant Electric Power Price Database by Yourself
I wrongly thought that the EIA would be a really good source of data. They seem to put wholesale prices together and better yet, they put the regional gas prices together with the electricity prices. I was wrong. The prices are generally only on-peak prices which does not give you a picture of the value of different types of plants including gas plants or wind plants or even solar projects. These prices come from a vendor who compiles prices that are not necessarily the same as real time and day ahead prices from the ISO’s. The wonderful feature about having gas prices has disappeared. To put together electricity prices I first show how to get analysis from the EIA website which can be updated in a reasonably automated way. This EIA website can be used to get both natural gas and electricity prices by region. A link to the website and files that read the electricity and gas data in an automated manner is shown below. To put the natural gas and electricity data together with history can be a little tricky. For example I had to arrange gas prices by region next to electricity prices from the same region is an important issue in computing spark spreads and in computing implied heat rates. So, here is the current process for automatically updating all of the natural gas and electricity data: The philosophy of this and other files is to put together a file with a whole bunch of history that does not have to be modified. Then you can just update the file. This is the same with the gas and electricity file. Here is the EIA link that you can use to download both the electricity and gas data:
Possibility of Changing Web Links
To put on-peak prices together and update the database, you can do the following (it is pretty easy).
1. Go to the natural gas file and press the button to read the pricing at the regional hub pricing files (you only really need the files for the years after the year in the file) as well as the button to read the Henry Hub prices. You may have to add lines (copy rows) for the last lines of the various hubs. This should only take a minute or two.
2. Copy and paste the page of natural gas basis differentials to the electricity price file that is named Current EIA Format and Database — the first file below. I have kept the electricity and gas files separate to make them easier to understand.
3. Press the button to read updated prices in the electricity price file. This should be automated and not pose problems and be finished in seconds.
Lessons from Historical Analysis of U.S. Prices
.
The U.S. has many electricity markets with published prices that have now been around for a long time. The prices can be used to study many case studies including: (1) sudden spikes in the Midwest U.S. followed by lower prices for many years; (2) the California power crisis of 2000-2001 with lower hydro, high plant outages; game playing in natural gas and electricity markets; (3) depressed prices in the NEPOOL market after new combined cycle capacity was built 2001-2002; (4) declining prices in ERCOT resulting in the TXU bankruptcy — one of the largest bankruptcies in history after 2008; (5) transmission constraints and differential prices between MID-CON and California driven by renewables after 2010; and (6) increasing prices in PJM driven by retirement of coal capacity. I have tried to put all of the markets with gas and electricity prices into a single file so all of these issues can be studied.
For electricity price to be relevant in valuing plants and evaluating new additions, natural gas coal and even oil prices may be relevant. The data demonstrates that U.S. natural gas market can be very different in different regions. For example, gas prices in New England sometimes reach very high levels because of limited natural gas pipeline capacity at something called the Algonquin hub. Not too far away in Pennsylvania, the gas prices can be very low because this is a region where shale gas is produced. The future prices in NEPOOL are therefore highly influenced by what will happen to pipeline capacity.
This is the same for other markets below including the WESM market in the Philippines, the UK market; the Australian markets and the Nordpool market.
ERCOT
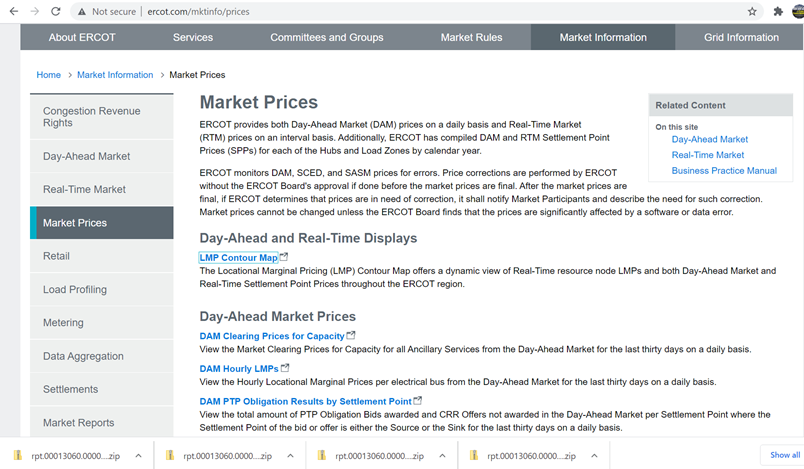
You can find the ERCOT prices fairly easy and you can get hourly data since 2011. The website to get the excel files is included below. The screenshot shows that you want to go to get the DAM Hourly LMP’s — the day ahead locational market prices. When you click on this link you will get a list of zipped files. I have put the historic prices in the file. All you need to do is get the latest file.
The market for ERCOT includes:
- Energy only market
- DA hourly and Real Time
- No term capacity market
- Use what they call scarcity pricing
- USD 9000/MWH energy offer cap
- ORDC adder
| http://www.ercot.com/mktinfo/prices |
Once you download the file, there are a couple of things to do. You can put together a new file with a year’s worth of data. Get the file named ECOT Read and then put the files together using the items below. I have saved the different nodes in the file so that you can evaluate the basis risk of corporate PPA’s and other issues associated with location of wind farms and other issues. If you want to evaluate different locations, I have left this up to you. But at least you have all of the data compiled.
| 1. Get the files from ERCOT |
| 2. Select the sheets |
| 3. Move to this sheet |
| 4. Use the January and use the CNTL A |
| 5. Sort main file |
| 6. Copy 8760 or 8784 rows to Hub (Use the EIS to put in the row number) |
The screenshot below illustrates the end of this process where you first sort on the settlement point and then put in 8760 or 8784 with ALT, E, I S so that you can copy the hub to a separate sheet. This sheet will be put together with the rest of the database.
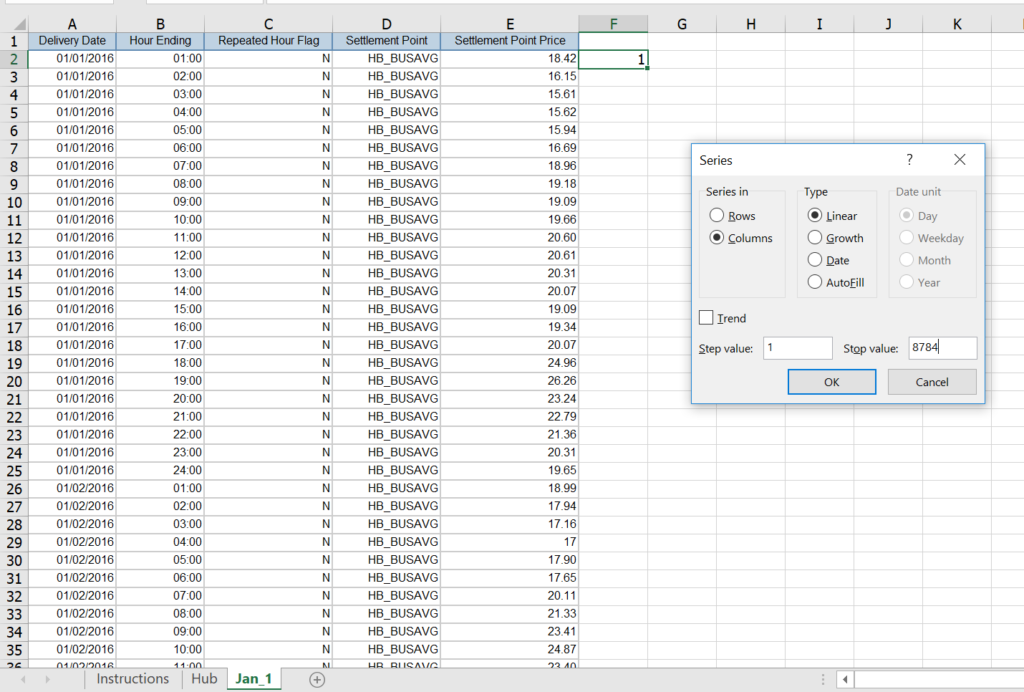
If you are careful with 8760 and 8784 hours, you can create a start date and then you can create a date using the prior date plus 1/24. If you want to format the date could use the format below and you will get the list shown in the screenshot below. I also think it is very important to put the year in the first column so you can navigate among years. For the current year, you can count the number of hours for the year and then link the file.
d-mmm-yy h:mm;@
Once you have read in the data, you can graph all of the hourly data and see how the ERCOT region has price spikes. Indeed, the 2021 was not all that different from some of the other spikes. You can use this data to evaluate the operation of batteries for example and see if a merchant battery that stores energy would be effective as an investment.
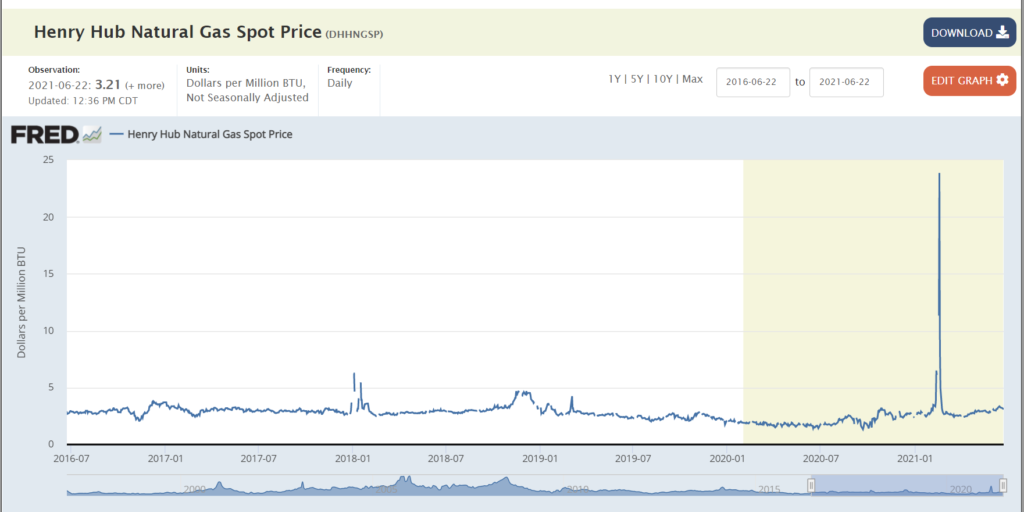
After acquiring the historic data, you can add gas prices. I have used the daily gas prices available from FRED. As usual, you can find the FRED code and copy one of the macros from the other sheets that gathers the data. Then you can use LOOKUP with INDIRECT to update the data. You should use the INDIRECT even though it does slow down excel because you can then re-upload the data and you will not get a REF problem. The code for the daily henry hub prices is shown in the link below.
DHHNGSP
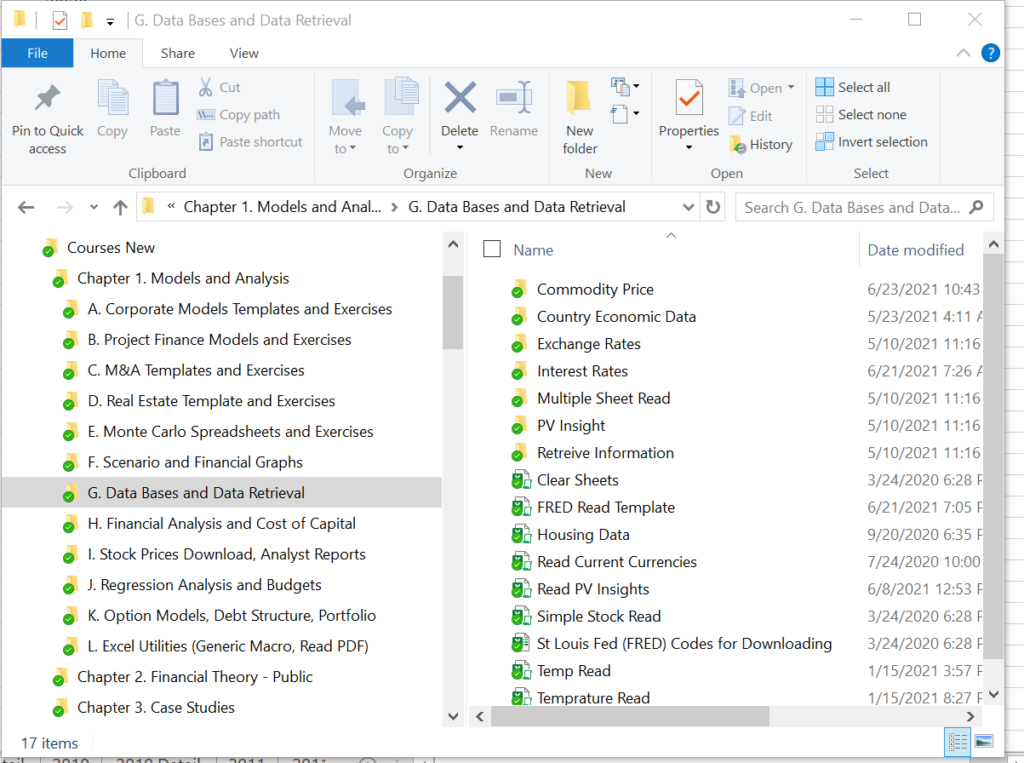
You can go to the simple template for reading FRED. This is in Chapter 1 as shown below. Get the file named FRED Read Template.
The output is put into a page named Natural Gas Prices. It is combined with the hourly price using LOOKUP and INDIRECT with the date. Once you have the natural gas price, you can make your hourly, monthly and annual analysis. For this I suggest you understand how things work and not worry too much about my simplistic equations. To graph a lot of the hourly data begin by making a date list (without hours) and then you can add a combo box so that you can use different start dates and end dates. This is shown in the screenshot below. Here are a few points about making the chart very flexible.
- Get the dates with the INDEX function on the list shown in column P.
- Count the number of rows from the start to the end so that you can use the NA() function and make the graph flexible.
- Make a counter with the maximum of rows you will present
- Use a TRUE/FALSE flag to limit the number of rows graphed
- Use the MATCH function with the start date to find the row in the detailed sheet
- Add the row counter to the initial match function by using the F4 function to lock the first value.
- Once you have the row, create a date function with NA() function to limit the graph
- Use the NA() on the gas and electric price
To make a monthly graph with trends in implied heat rates you should be begin by using the EOMONTH function in the detailed hour by hour page. Use the EOMONTH with a zero. Then you can use this with the AVERAGEIF to compute the average electricity and natural gas prices. You can begin by copying the hourly analysis so you won’t have to spend so much time in adding the drop down boxes. You can then use the EOMONTH function to make the list and increment with EOMONTH(prior date,1) as shown in the screenshot below. Unlike other regions, you can see the effect of the price spikes in the graph.
New England ISO
This section describes you you can analyze and update prices for the New England region of the U.S. This region experienced a large over-build around the year 2000 and older steam units were replaced with more efficient combined cycle plants. Natural gas prices can be very different in New England than in other regions and it can be difficult to find the natural gas prices.
Lessons from the New England Database
- You cannot really see things with gas and electricity price graphs even though I like them and they illustrate the correlation very well
- You can see much more with an implied heat rate and the over-capacity that lead to the extreme problems with merchant plants
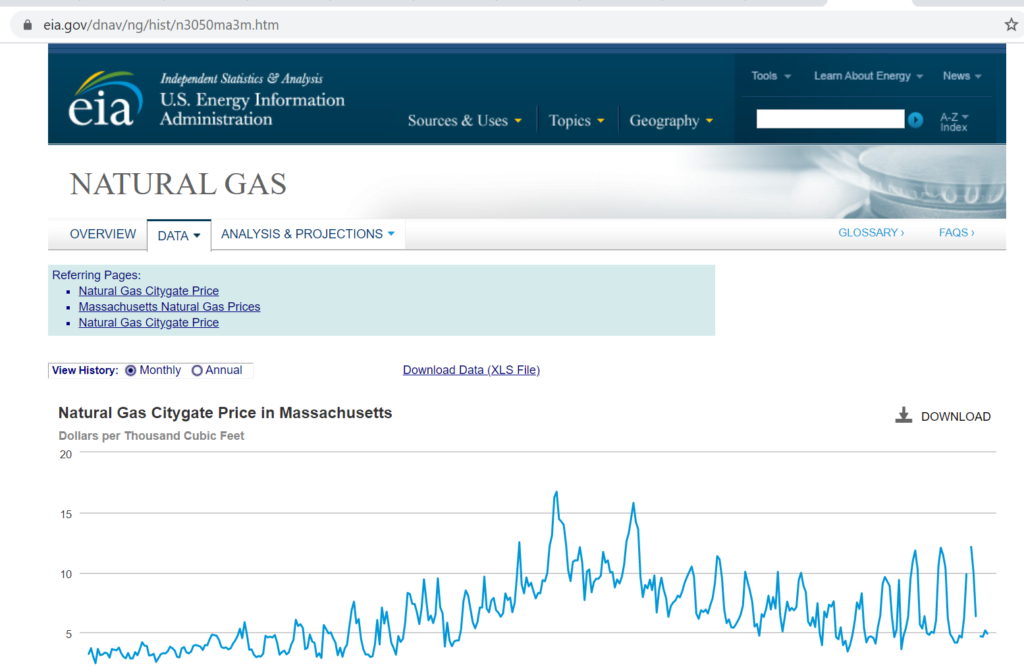
The monthly natural gas and electricity prices are shown on the screenshot below.
Updating NE-ISO prices
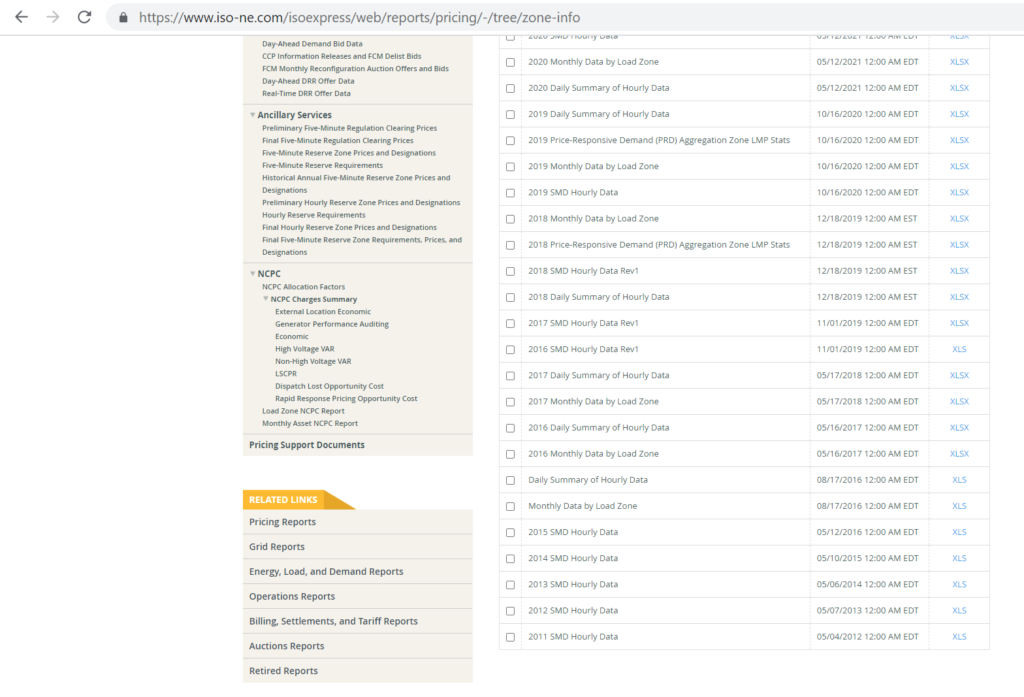
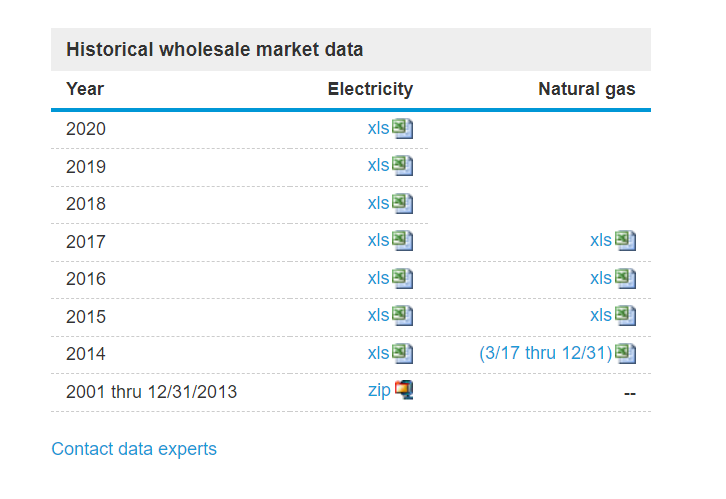
You want to find the file with information shown in the spreadsheet below which contains the day ahead prices that are typically used to demonstrate the electricity price. In this file you can find data for real-time prices, capacity prices and some ancillary services. Once you understand what these prices are supposed to do, you can understand the prices.
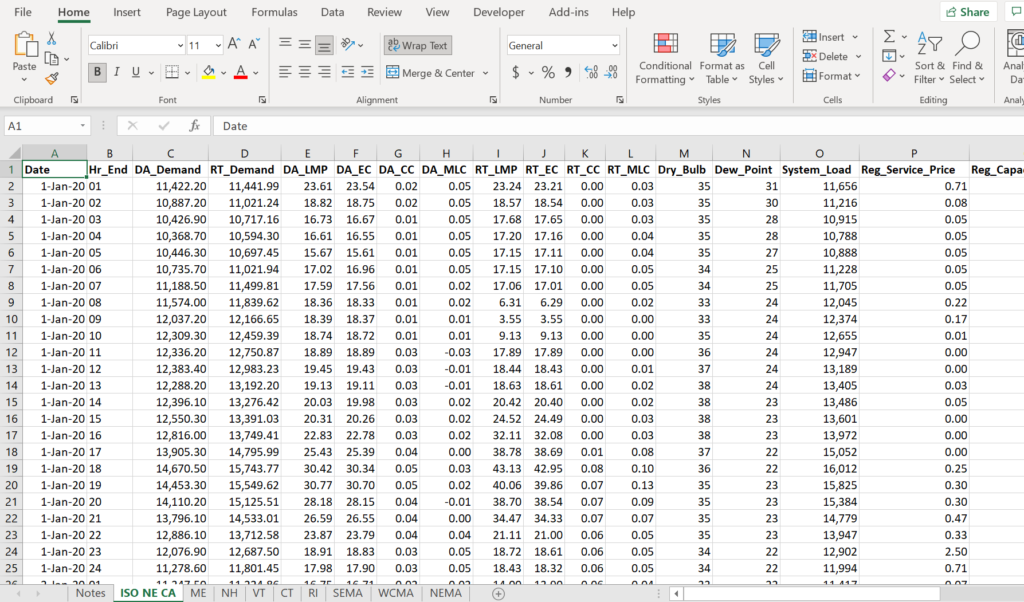
The units and the definition of the prices are shown below.
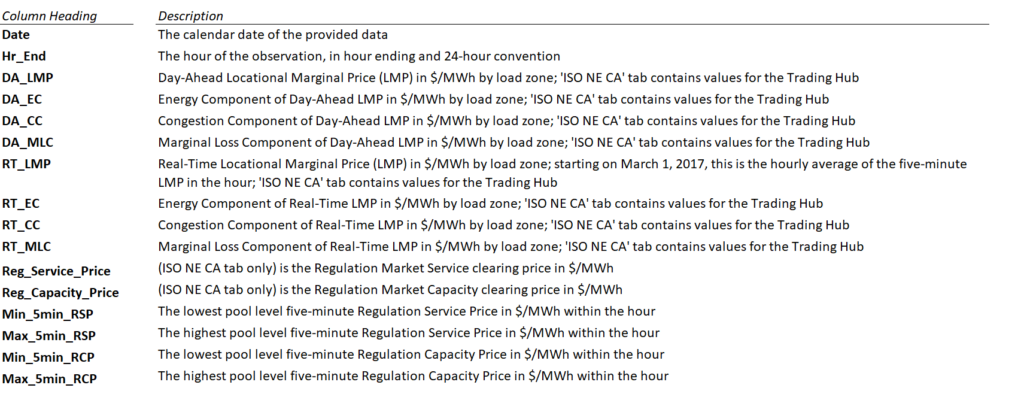
Once you have found the newest file that is called SMD prices as shown above, you can then follow the procedure with the new prices.
- You download the price file from the website.
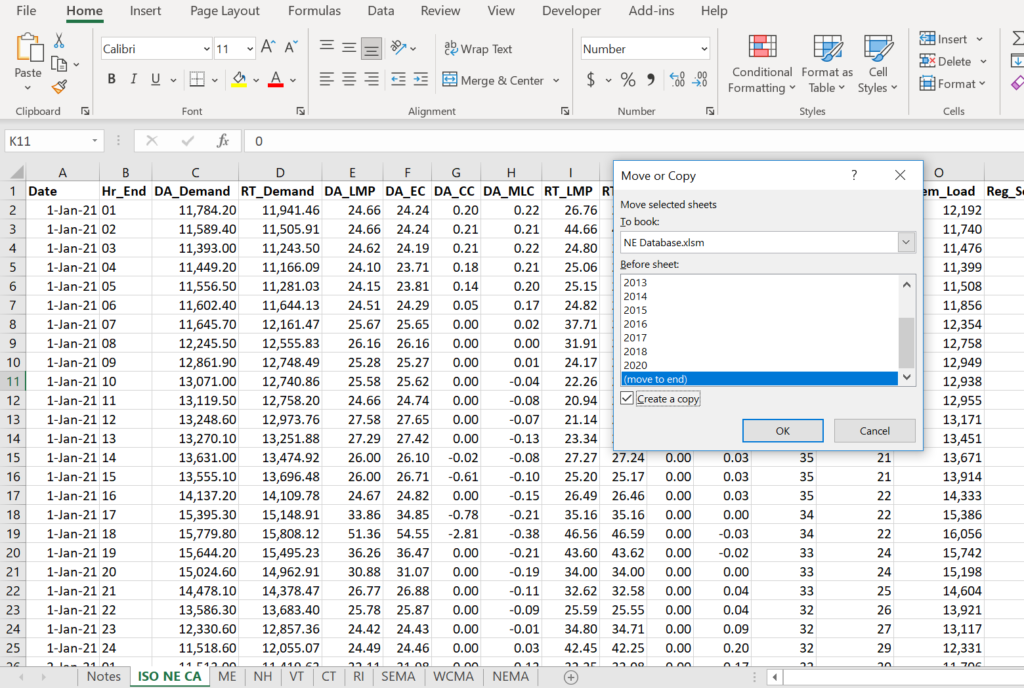
- Then you use the ALT, M, E short-cut to move the ISO NE CA sheet to the database.
- Move the sheet to the end of the database workbook
- Then re-name the sheet in the database with the sheet name
The process to move the sheet is shown in the screenshot below. Get this with ALT, E, M short-cut.
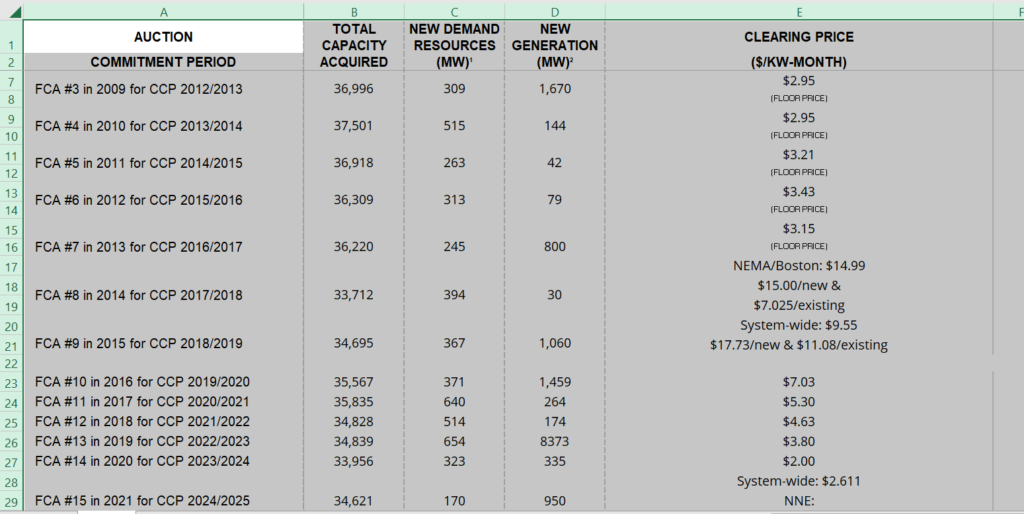
The Forward Capacity Market is abbreviated with (FCM) ensures that the New England power system will have sufficient resources to meet the future demand for electricity.
Forward Capacity Auctions (FCAs) are held annually, three years in advance of the operating period.
Resources obtain a commitment to supply capacity in exchange for a market-priced capacity payment.
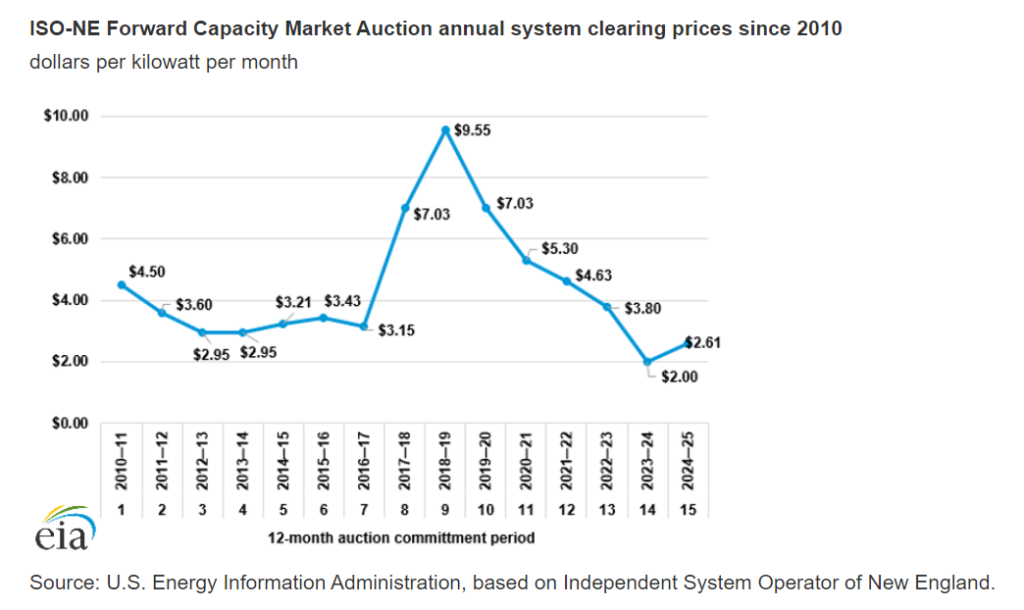
Capacity Prices are illustrated on the sheet below. The underlying data are included in the website at the following link:
The code for reading in FRED and re-formatting is shown below.
New England Natural Gas Prices
Here is something that is very upsetting. Natural gas prices by region were published before 2018 by the EIA. Then they were stopped. Further, it is not easy to find natural gas prices for the Algonquin City gate.
DHHNGSP
https://research.stlouisfed.org/fred2/data/DHHNGSP.txt
'


' You need the following range names
' URL -- Where you are using the index
' CODE -- The index code
' Series_name -- the sheet name associated with the URL
' Total_to_read -- number of series
'
' You also should have a sheet named BREAK Sheet
'
'
' Assign the macro get_all_data
'
Sub GetData()
base_book = ActiveWorkbook.Name
base_sheet = ActiveSheet.Name
num_sheets = Sheets.Count
On Error GoTo exit1:
Workbooks.Open (Range("url"))
temp_book = ActiveWorkbook.Name
temp_sheet = ActiveSheet.Name
'
Columns("A:A").Select
Selection.TextToColumns Destination:=Range("A1"), DataType:=xlDelimited, _
TextQualifier:=xlDoubleQuote, ConsecutiveDelimiter:=True, Tab:=True, _
Semicolon:=False, Comma:=False, Space:=True, Other:=False, FieldInfo _
:=Array(Array(1, 1), Array(2, 1), Array(3, 1), Array(4, 1), Array(5, 1), Array(6, 1), _
Array(7, 1)), TrailingMinusNumbers:=True
Sheets(temp_sheet).Copy after:=Workbooks(base_book).Sheets(num_sheets)
min_date = WorksheetFunction.Min(Range("A:A")) ' get min date data_row_start = WorksheetFunction.Match(min_date, Range("A:A"), 0) ' fin row number For Row = 1 To data_row_start - 1 For col = 2 To 20 Cells(Row, 1) = Cells(Row, 1) & " " & Cells(Row, col) Cells(Row, col) = "" Next col Next Row On Error GoTo problem_reading ActiveSheet.Name = Range("series_name")
GoTo skip2:
problem_reading:
MsgBox "problem with sheet name " & Range("series_name")
On Error GoTo 0
skip2:
Workbooks(temp_book).Close
exit1:
End Sub
VBA Code for Reading Natural Gas Prices
.
Sub read_gas_price()

Application.DisplayAlerts = False

current_calc = Application.Calculation
Application.Calculation = xlCalculationManual

On Error Resume Next

MsgBox "Deleting Sheet to re-create"

Sheets("HenryHub").Delete

base_book = ActiveWorkbook.Name
base_sheet = ActiveSheet.Name
num_sheets = Sheets.Count

Workbooks.Open (Range("gas_url"))

temp_book = ActiveWorkbook.Name
num_sheets1 = Sheets.Count

Sheets(num_sheets1).Select
Sheets(num_sheets1).Move After:=Workbooks(base_book).Sheets(num_sheets)

ActiveSheet.Name = "HenryHub"

Workbooks(temp_book).Close

Application.Calculation = current_calc

End Sub